Bryson Ridge neighborhood in Greensboro, North Carolina (NC), 27405 detailed profile
Settings
X


Business Search - 14 Million verified businesses
Area: 0.114 square miles
Population: 401
Population density:
| Bryson Ridge: | 3,512 people per square mile |
| Greensboro: | 2,876 people per square mile |

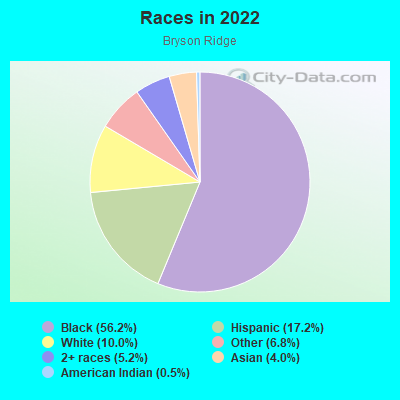
- 22556.2%Black
- 6917.2%Hispanic or Latino
- 4010.0%White
- 276.8%Some other race
- 215.2%Two or more races
- 164.0%Asian
- 20.5%American Indian
Median household income in 2022:
| Bryson Ridge: | $37,039 |
| Greensboro: | $55,120 |
Distribution of median household income
![Distribution of median household income]()
- 28Less than $10,000
- 62$10,000 to $19,999
- 34$20,000 to $29,999
- 11$30,000 to $39,999
- 14$40,000 to $49,999
- 13$50,000 to $59,999
- 13$60,000 to $74,999
- 10$75,000 to $99,999
- 6$100,000 to $124,999
- 3$125,000 to $149,999
- 10$150,000 to $199,999
- 10$200,000 or more

Distribution of owner-occupied house/condo value
![Distribution of owner-occupied house/condo value]()
- 36Less than $50,000
- 35$50,000 to $99,999
- 23$100,000 to $149,999
- 15$150,000 to $199,999
- 11$200,000 to $249,999
- 1$250,000 to $299,999
- 2$300,000 to $399,999
- 3$500,000 to $749,999

Distribution of rent paid by renters
![Distribution of rent paid by renters]()
- 7$100 to $199
- 12$200 to $299
- 7$300 to $399
- 12$400 to $499
- 13$500 to $599
- 23$600 to $699
- 17$700 to $799
- 31$800 to $899
- 5$900 to $999
- 16$1,000 to $1,249
- 11$1,250 to $1,499
- 5$1,500 to $1,999

Median rent in 2022:
| Bryson Ridge: | $819 |
| Greensboro: | $915 |
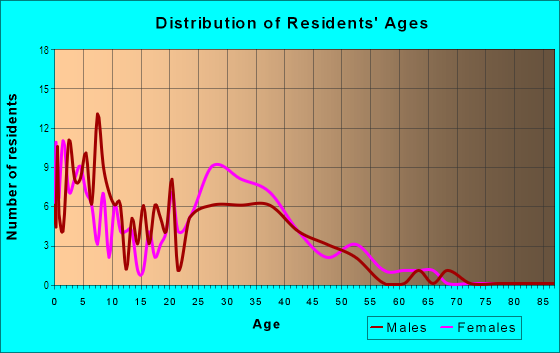
| Males: | 172 |
| Females: | 228 |
Males:
| This neighborhood: | 34.5 years |
| Whole city: | 32.4 years |
| This neighborhood: | 34.2 years |
| Whole city: | 35.3 years |
Average household size:
| Bryson Ridge: | 2.8 people |
| Greensboro: | 2.3 people |
Percentage of family households:
| Bryson Ridge: | 62.4% |
| Greensboro: | 43.6% |
| Here: | 31.2% |
| Greensboro: | 36.2% |
Percentage of married-couple families with children (among all households):
| Bryson Ridge: | 4.2% |
| Greensboro: | 22.4% |
Percentage of single-mother households (among all households):
| Bryson Ridge: | 34.7% |
| Greensboro: | 15.5% |
Percentage of never married males 15 years old and over:
Percentage of never married females 15 years old and over:
| Bryson Ridge: | 14.2% |
| Greensboro: | 20.8% |
Percentage of never married females 15 years old and over:
| Bryson Ridge: | 27.1% |
| city: | 23.9% |
Percentage of people that speak English not well or not at all:
| Bryson Ridge: | 5.5% |
| Greensboro: | 2.7% |
Percentage of people born in this state:
Percentage of people born in another U.S. state:
Percentage of native residents but born outside the U.S.:
Percentage of foreign born residents:
| Here: | 64.3% |
| Greensboro: | 52.7% |
Percentage of people born in another U.S. state:
| Bryson Ridge: | 23.5% |
| Greensboro: | 33.7% |
Percentage of native residents but born outside the U.S.:
| Here: | 0.3% |
| city: | 1.6% |
Percentage of foreign born residents:
| Here: | 11.9% |
| Greensboro: | 12.0% |
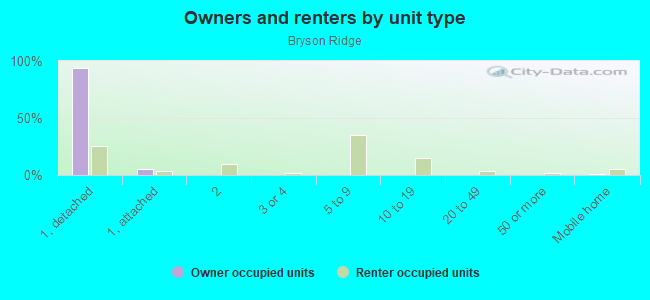
Owner-occupied
Renter-occupied

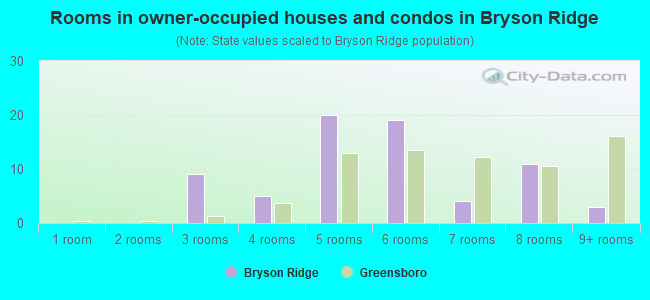
- Rooms in owner-occupied houses and condos in Bryson Ridge
- 01 room
- 02 rooms
- 93 rooms
- 54 rooms
- 205 rooms
- 196 rooms
- 47 rooms
- 118 rooms
- 39+ rooms
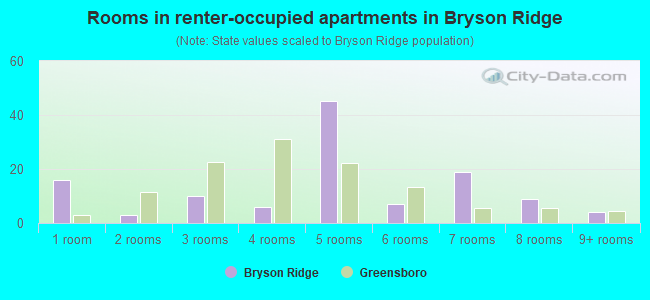
- Rooms in renter-occupied apartments in Bryson Ridge
- 161 room
- 32 rooms
- 103 rooms
- 64 rooms
- 455 rooms
- 76 rooms
- 197 rooms
- 98 rooms
- 49+ rooms
Owner-occupied
Renter-occupied
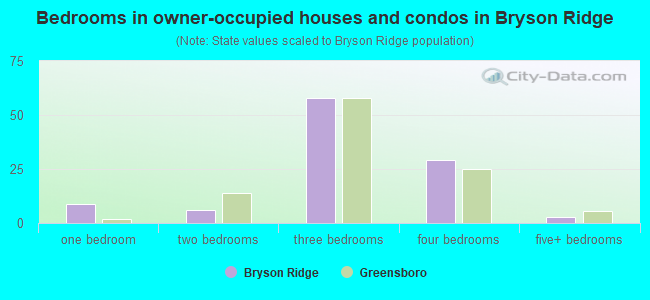
- Bedrooms in owner-occupied houses and condos in Bryson Ridge
- 0no bedroom
- 91 bedroom
- 62 bedrooms
- 583 bedrooms
- 294 bedrooms
- 35+ bedrooms
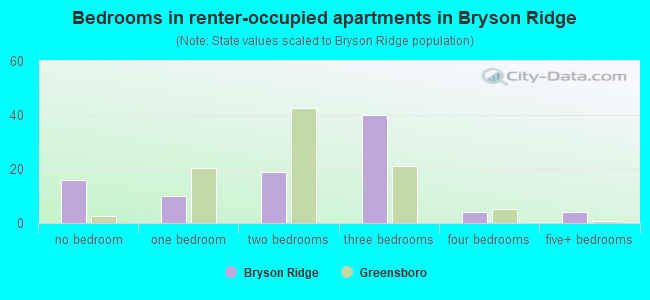
- Bedrooms in renter-occupied apartments in Bryson Ridge
- 16no bedroom
- 101 bedroom
- 192 bedrooms
- 403 bedrooms
- 44 bedrooms
- 45+ bedrooms
Average number of cars or other vehicles available in houses/condos:
Average number of cars or other vehicles available in apartments:
| This neighborhood: | 2.1 |
| Greensboro: | 2.0 |
Average number of cars or other vehicles available in apartments:
| Here: | 1.2 |
| city: | 1.4 |
Percentage of units with a mortgage:
| Bryson Ridge: | 69.3% |
| Greensboro: | 67.4% |
Average estimated value of detached houses in 2022 (56.6% of all units):
| Bryson Ridge: | $104,024 |
| Greensboro: | $297,193 |
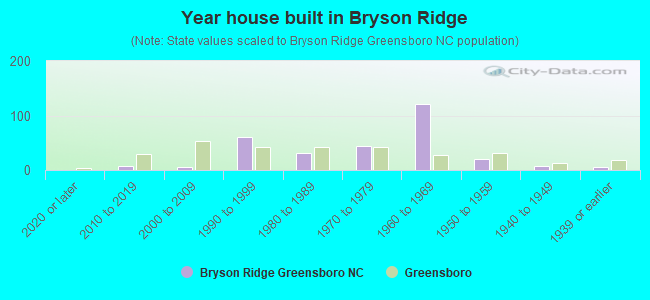
- Year house built in Bryson Ridge
- 02020 or later
- 82010 to 2019
- 52000 to 2009
- 611990 to 1999
- 311980 to 1989
- 441970 to 1979
- 1211960 to 1969
- 211950 to 1959
- 71940 to 1949
- 51939 or earlier
City-data.com crime index for city in 2020 (higher means more crime):
| City: | 435.6 |
| U.S. average: | 219.5 |
Travel time to work (commute)
![Travel time to work (commute)]()
- 5Less than 5 minutes
- 5110 to 14 minutes
- 2715 to 19 minutes
- 3520 to 24 minutes
- 3125 to 29 minutes
- 2330 to 34 minutes
- 835 to 39 minutes
- 140 to 44 minutes
- 1945 to 59 minutes
- 460 to 89 minutes
- 990 or more minutes

Means of transportation to work
![Means of transportation to work]()
- 89.0%167Drove a car alone
- 4.8%9Carpooled
- 1.6%3Bus
- 1.1%2Taxi
- 2.1%4Bicycle
- 1.6%3Walked
- 2.7%5Other means
- 1.6%3Worked at home

Time leaving home to go to work
![Time leaving home to go to work]()
- 1812:00 a.m. to 4:59 a.m.
- 35:00 a.m. to 5:29 a.m.
- 55:30 a.m. to 5:59 a.m.
- 186:00 a.m. to 6:29 a.m.
- 216:30 a.m. to 6:59 a.m.
- 177:00 a.m. to 7:29 a.m.
- 267:30 a.m. to 7:59 a.m.
- 398:00 a.m. to 8:29 a.m.
- 78:30 a.m. to 8:59 a.m.
- 129:00 a.m. to 9:59 a.m.
- 210:00 a.m. to 10:59 a.m.
- 612:00 p.m. to 3:59 p.m.
- 214:00 p.m. to 11:59 p.m.

Occupations of males:
- Percentage of males in business and financial operations occupations:
Here: 3.8% city: 4.8%
- Percentage of males in computer and mathematical occupations:
Here: 13.6% city: 3.9%
- Percentage of males in architecture and engineering occupations:
Here: 1.9% city: 3.1%
- Percentage of males in community and social services occupations:
Here: 3.7% city: 1.4%
- Percentage of males in healthcare practitioners and technical occupations:
Here: 4.9% city: 3.1%
- Percentage of males in service occupations:
Here: 35.0% city: 14.3%
- Percentage of males in sales and office occupations:
Here: 14.6% city: 17.1%
- Percentage of males in construction, extraction, and maintenance occupations:
Here: 12.6% city: 6.0%
- Percentage of males in transportation occupations:
Here: 3.5% city: 6.8%
- Percentage of males in material moving occupations:
Here: 14.3% city: 9.6%
Occupations of females:
- Percentage of females in management occupations (except farmers):
Here: 11.5% city: 7.8%
- Percentage of females in business and financial operations occupations:
Here: 5.2% city: 5.5%
- Percentage of females in architecture and engineering occupations:
Here: 3.3% city: 0.5%
- Percentage of females in community and social services occupations:
Here: 2.8% city: 3.2%
- Percentage of females in healthcare practitioners and technical occupations:
Here: 3.1% city: 8.6%
- Percentage of females in service occupations:
Here: 40.1% city: 19.4%
- Percentage of females in sales and office occupations:
Here: 13.5% city: 29.0%
- Percentage of females in production occupations:
Here: 15.7% city: 5.2%
- Percentage of females in transportation occupations:
Here: 4.7% city: 1.5%
- Percentage of females in material moving occupations:
Here: 1.3% city: 2.7%
Percentage of people 16-64 in Armed Forces:
| Bryson Ridge: | 0.0% |
| Greensboro: | 0.5% |
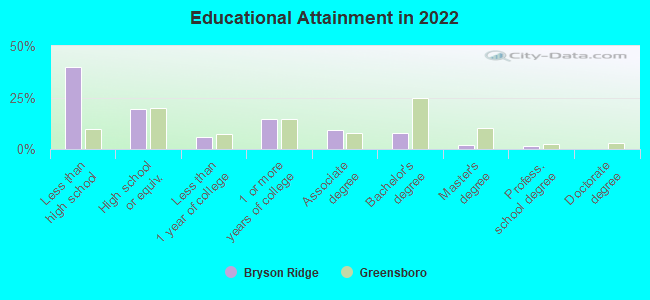
Education in this neighborhood (subdivision or community):
- Percentage of people 3 years and older in K-12 schools:
Bryson Ridge: 52.0% Greensboro: 17.6%
- Percentage of people 3 years and older in undergraduate colleges:
Bryson Ridge: 7.6% Greensboro: 11.2%
- Percentage of people 3 years and older in grad. or professional schools:
Bryson Ridge: 2.2% Greensboro: 2.6%
- Percentage of students K-12 enrolled in private schools:
Bryson Ridge: 2.6% Greensboro: 13.3%
Percentage of population below poverty level:
| Bryson Ridge: | 27.5% |
| Greensboro: | 21.9% |
Median year owner moved in (as recorded in 2022):
Median year renter moved in (as recorded in 2022):
| Bryson Ridge: | 2004 |
| Greensboro: | 2010 |
Median year renter moved in (as recorded in 2022):
| Bryson Ridge: | 2016 |
| Greensboro: | 2020 |
Percentage of married-couple families with both working:
| Bryson Ridge: | 280.5% |
| Greensboro: | 70.9% |
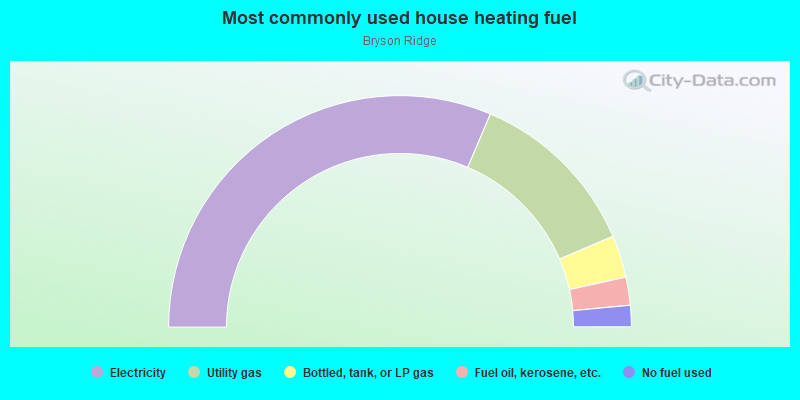
- 62.8%Electricity
- 24.4%Utility gas
- 5.9%Bottled, tank, or LP gas
- 3.9%Fuel oil, kerosene, etc.
- 3.0%No fuel used
Roads and streets:
Saint Charles Ln
Length: 0.43 miles
Directions: E-W, N-S, SE-NW, SW-NE
Address range: 1700 to 1999
Directions: E-W, N-S, SE-NW, SW-NE
Address range: 1700 to 1999
Markham Rd
Length: 0.39 miles
Directions: E-W, N-S, SW-NE
Address range: 3400 to 3699
Directions: E-W, N-S, SW-NE
Address range: 3400 to 3699
Owens St
Length: 0.29 miles
Directions: E-W, SE-NW, SW-NE
Address range: 1800 to 2199
Directions: E-W, SE-NW, SW-NE
Address range: 1800 to 2199
Presley Way
Length: 0.25 miles
Directions: N-S, SE-NW
Address range: 3200 to 3599
Directions: N-S, SE-NW
Address range: 3200 to 3599
Dickerson Ln
Length: 0.18 miles
Direction: N-S
Address range: 3400 to 3425
Direction: N-S
Address range: 3400 to 3425
Spring St
Length: 0.14 miles
Direction: N-S
Address range: 3336 to 3399
Direction: N-S
Address range: 3336 to 3399
Owens Ct
Length: 0.05 miles
Direction: SE-NW
Address range: 1 to 99
Direction: SE-NW
Address range: 1 to 99
Other features:
Jorden Br
Length: 0.39 miles
Directions: E-W, SE-NW, SW-NE
Directions: E-W, SE-NW, SW-NE