Broening Manor neighborhood in Baltimore, Maryland (MD), 21224 detailed profile
Settings
X

Business Search - 14 Million verified businesses
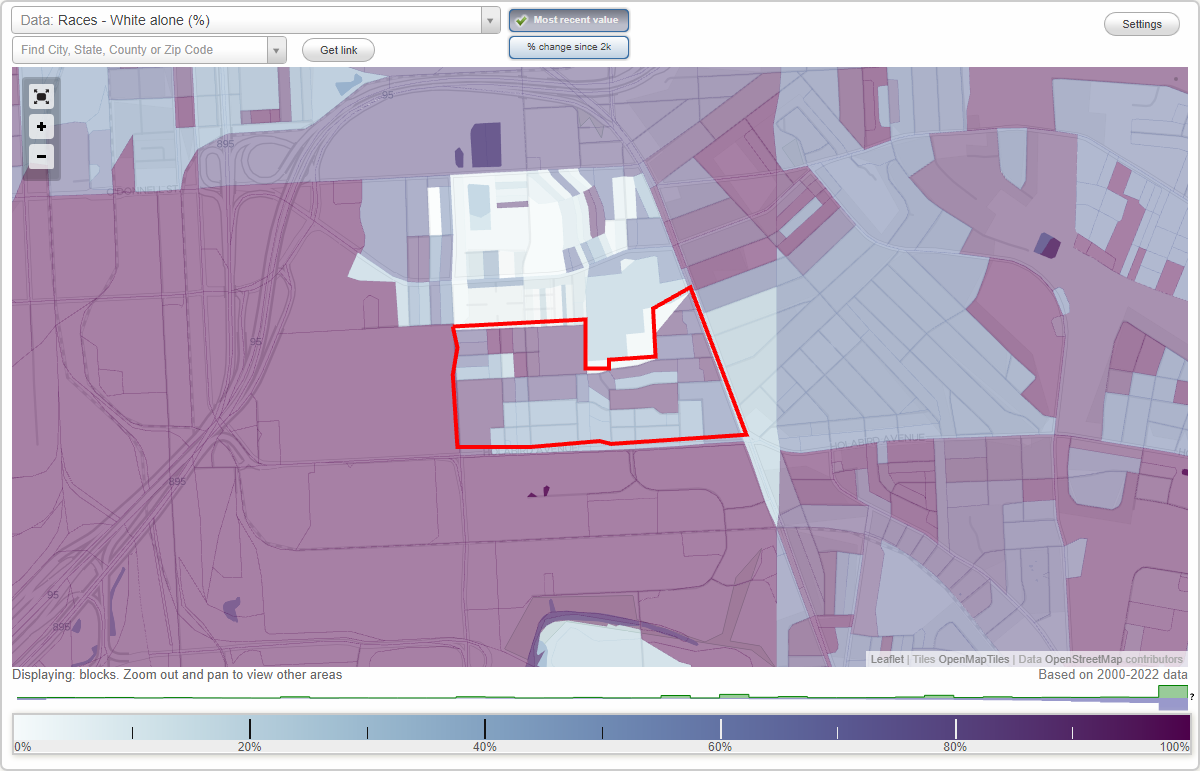
Area: 0.163 square miles
Population: 1,276
Population density:
| Broening Manor: | 7,824 people per square mile |
| Baltimore: | 7,053 people per square mile |

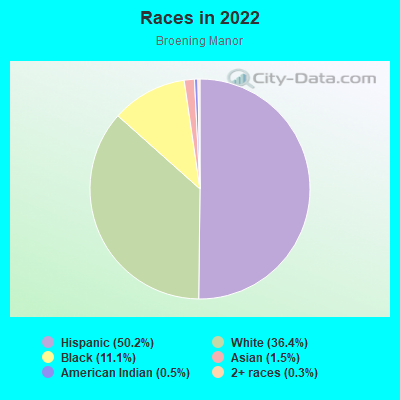
- 64250.2%Hispanic or Latino
- 46536.4%White
- 14211.1%Black
- 191.5%Asian
- 60.5%American Indian
- 40.3%Two or more races
Median household income in 2022:
| Broening Manor: | $49,949 |
| Baltimore: | $55,198 |
Distribution of median household income
![Distribution of median household income]()
- 58Less than $10,000
- 25$10,000 to $19,999
- 187$20,000 to $29,999
- 127$30,000 to $39,999
- 40$40,000 to $49,999
- 25$50,000 to $59,999
- 35$60,000 to $74,999
- 13$75,000 to $99,999
- 31$100,000 to $124,999
- 12$125,000 to $149,999
- 6$150,000 to $199,999
- 7$200,000 or more

Distribution of owner-occupied house/condo value
![Distribution of owner-occupied house/condo value]()
- 13Less than $50,000
- 49$50,000 to $99,999
- 138$100,000 to $149,999
- 93$150,000 to $199,999
- 10$200,000 to $249,999
- 40$250,000 to $299,999
- 27$300,000 to $399,999
- 52$400,000 to $499,999
- 13$1,000,000 or more

Distribution of rent paid by renters
![Distribution of rent paid by renters]()
- 160$100 to $199
- 33$300 to $399
- 179$400 to $499
- 8$500 to $599
- 35$600 to $699
- 198$700 to $799
- 45$800 to $899
- 22$900 to $999
- 24$1,000 to $1,249
- 13$1,250 to $1,499
- 6$1,500 to $1,999
- 32$2,000 or more

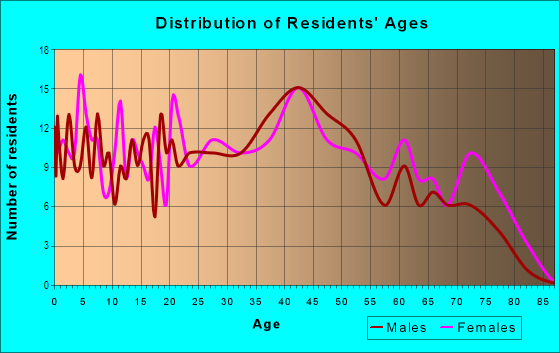
| Males: | 540 |
| Females: | 735 |
Males:
| This neighborhood: | 38.5 years |
| Whole city: | 35.0 years |
| This neighborhood: | 31.2 years |
| Whole city: | 38.2 years |
Average household size:
| Broening Manor: | 3.1 people |
| Baltimore: | 2.2 people |
Percentage of family households:
| Broening Manor: | 52.3% |
| Baltimore: | 34.2% |
| Here: | 30.2% |
| Baltimore: | 23.3% |
Percentage of married-couple families with children (among all households):
| Broening Manor: | 9.9% |
| Baltimore: | 22.4% |
Percentage of single-mother households (among all households):
| Broening Manor: | 22.0% |
| Baltimore: | 18.7% |
Percentage of never married males 15 years old and over:
Percentage of never married females 15 years old and over:
| Broening Manor: | 22.4% |
| Baltimore: | 25.1% |
Percentage of never married females 15 years old and over:
| Broening Manor: | 14.6% |
| city: | 27.5% |
Percentage of people that speak English not well or not at all:
| Broening Manor: | 10.2% |
| Baltimore: | 2.3% |
Percentage of people born in this state:
Percentage of people born in another U.S. state:
Percentage of native residents but born outside the U.S.:
Percentage of foreign born residents:
| Here: | 67.7% |
| Baltimore: | 64.4% |
Percentage of people born in another U.S. state:
| Broening Manor: | 13.5% |
| Baltimore: | 25.0% |
Percentage of native residents but born outside the U.S.:
| Here: | 1.9% |
| city: | 0.9% |
Percentage of foreign born residents:
| Here: | 16.9% |
| Baltimore: | 9.7% |
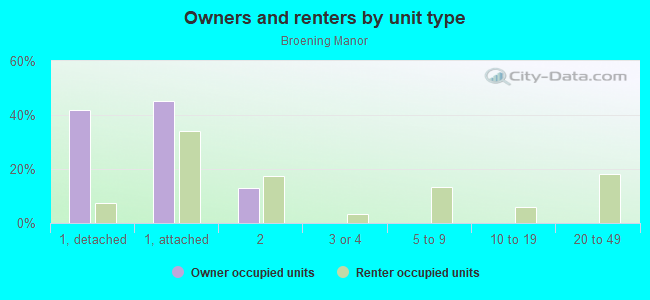
Owner-occupied
Renter-occupied

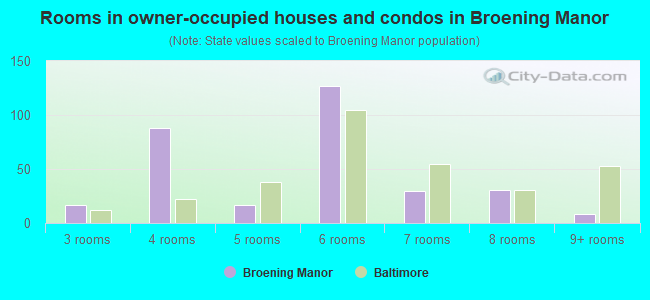
- Rooms in owner-occupied houses and condos in Broening Manor
- 01 room
- 02 rooms
- 173 rooms
- 884 rooms
- 175 rooms
- 1276 rooms
- 307 rooms
- 318 rooms
- 89+ rooms
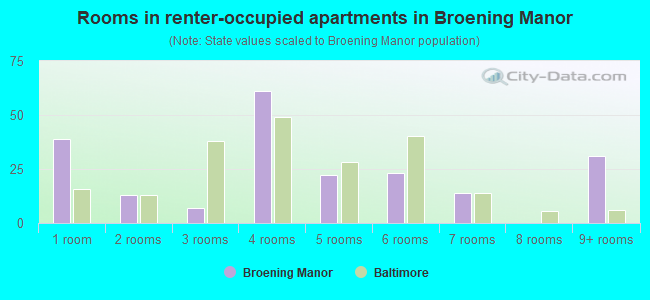
- Rooms in renter-occupied apartments in Broening Manor
- 391 room
- 132 rooms
- 73 rooms
- 614 rooms
- 225 rooms
- 236 rooms
- 147 rooms
- 08 rooms
- 319+ rooms
Owner-occupied
Renter-occupied
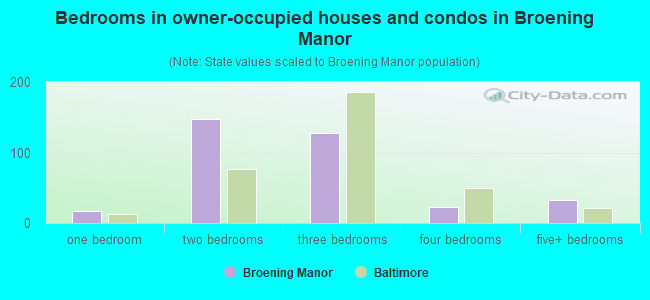
- Bedrooms in owner-occupied houses and condos in Broening Manor
- 0no bedroom
- 171 bedroom
- 1482 bedrooms
- 1273 bedrooms
- 224 bedrooms
- 325+ bedrooms
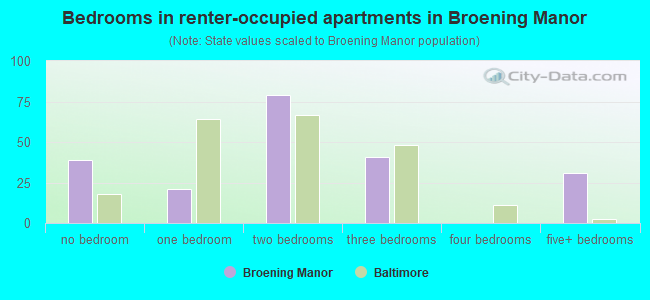
- Bedrooms in renter-occupied apartments in Broening Manor
- 39no bedroom
- 211 bedroom
- 792 bedrooms
- 413 bedrooms
- 04 bedrooms
- 315+ bedrooms
Average number of cars or other vehicles available in houses/condos:
Average number of cars or other vehicles available in apartments:
| This neighborhood: | 1.6 |
| Baltimore: | 1.5 |
Average number of cars or other vehicles available in apartments:
| Here: | 0.7 |
| city: | 0.8 |
Percentage of units with a mortgage:
| Broening Manor: | 50.0% |
| Baltimore: | 64.3% |
Housing prices:
- Average estimated value of detached houses in 2022 (32.5% of all units):
Broening Manor: $255,140 Baltimore: $350,815
- Average estimated value of townhouses or other attached units in 2022 (48.4% of all units):
This neighborhood: $112,651 city: $206,258
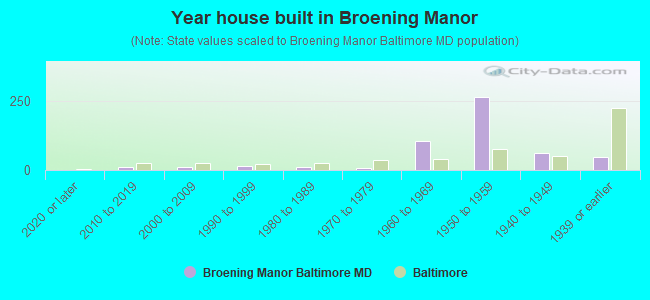
- Year house built in Broening Manor
- 02020 or later
- 112010 to 2019
- 122000 to 2009
- 131990 to 1999
- 111980 to 1989
- 81970 to 1979
- 1051960 to 1969
- 2631950 to 1959
- 611940 to 1949
- 471939 or earlier
Travel time to work (commute)
![Travel time to work (commute)]()
- 7Less than 5 minutes
- 695 to 9 minutes
- 3910 to 14 minutes
- 9115 to 19 minutes
- 5120 to 24 minutes
- 2925 to 29 minutes
- 11430 to 34 minutes
- 1840 to 44 minutes
- 745 to 59 minutes
- 5860 to 89 minutes
- 2890 or more minutes

Means of transportation to work
![Means of transportation to work]()
- 62.4%248Drove a car alone
- 20.9%83Carpooled
- 4.8%19Bus
- 5.3%21Taxi
- 7.5%30Walked
- 1.8%7Worked at home

Time leaving home to go to work
![Time leaving home to go to work]()
- 4012:00 a.m. to 4:59 a.m.
- 235:00 a.m. to 5:29 a.m.
- 265:30 a.m. to 5:59 a.m.
- 366:00 a.m. to 6:29 a.m.
- 506:30 a.m. to 6:59 a.m.
- 627:00 a.m. to 7:29 a.m.
- 917:30 a.m. to 7:59 a.m.
- 608:00 a.m. to 8:29 a.m.
- 628:30 a.m. to 8:59 a.m.
- 169:00 a.m. to 9:59 a.m.
- 2310:00 a.m. to 10:59 a.m.
- 411:00 a.m. to 11:59 a.m.
- 4312:00 p.m. to 3:59 p.m.
- 204:00 p.m. to 11:59 p.m.

Occupations of males:
- Percentage of males in management occupations (except farmers):
Here: 14.1% city: 10.7%
- Percentage of males in business and financial operations occupations:
Here: 4.8% city: 5.9%
- Percentage of males in computer and mathematical occupations:
Here: 6.0% city: 6.1%
- Percentage of males in community and social services occupations:
Here: 3.9% city: 1.6%
- Percentage of males in arts, design, entertainment, sports, and media occupations:
Here: 2.2% city: 2.8%
- Percentage of males in service occupations:
Here: 17.6% city: 14.7%
- Percentage of males in sales and office occupations:
Here: 24.3% city: 14.2%
- Percentage of males in construction, extraction, and maintenance occupations:
Here: 22.9% city: 5.6%
- Percentage of males in transportation occupations:
Here: 4.8% city: 6.8%
Occupations of females:
- Percentage of females in management occupations (except farmers):
Here: 4.8% city: 10.1%
- Percentage of females in life, physical, and social science occupations:
Here: 1.9% city: 2.5%
- Percentage of females in healthcare practitioners and technical occupations:
Here: 1.4% city: 9.8%
- Percentage of females in service occupations:
Here: 55.5% city: 20.4%
- Percentage of females in sales and office occupations:
Here: 24.7% city: 22.3%
- Percentage of females in production occupations:
Here: 4.2% city: 2.3%
- Percentage of females in material moving occupations:
Here: 9.0% city: 1.9%
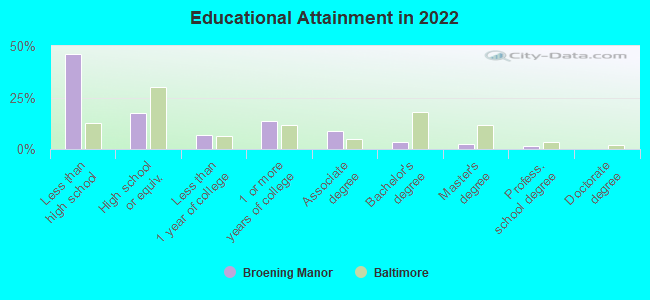
Education in this neighborhood (subdivision or community):
- Percentage of people 3 years and older in K-12 schools:
Broening Manor: 36.1% Baltimore: 14.7%
- Percentage of people 3 years and older in undergraduate colleges:
Broening Manor: 12.9% Baltimore: 6.0%
- Percentage of people 3 years and older in grad. or professional schools:
Broening Manor: 2.5% Baltimore: 2.8%
- Percentage of students K-12 enrolled in private schools:
Broening Manor: 0.0% Baltimore: 12.7%
Percentage of population below poverty level:
| Broening Manor: | 26.5% |
| Baltimore: | 18.5% |
Percentage of married-couple families with both working:
| Broening Manor: | 50.8% |
| Baltimore: | 79.2% |
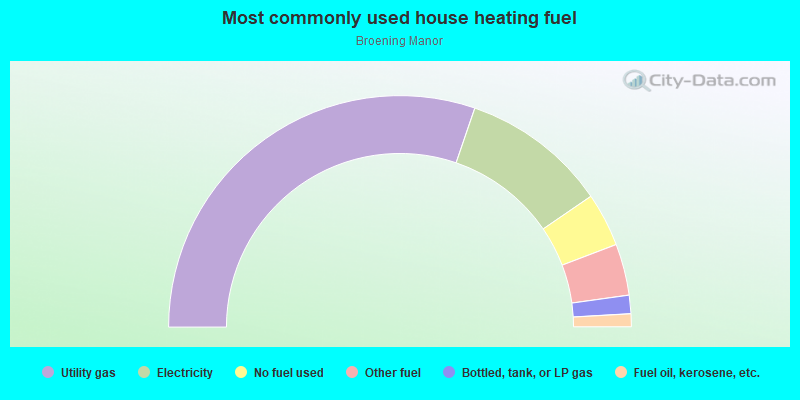
- 60.5%Utility gas
- 20.4%Electricity
- 7.5%No fuel used
- 7.2%Other fuel
- 2.6%Bottled, tank, or LP gas
- 1.8%Fuel oil, kerosene, etc.
Roads and streets:
Danville Ave
Length: 0.76 miles
Directions: E-W, SW-NE
Address range: 6100 to 6699
Directions: E-W, SW-NE
Address range: 6100 to 6699
Brown Ave
Length: 0.66 miles
Directions: E-W, SE-NW
Address range: 6100 to 6599
Directions: E-W, SE-NW
Address range: 6100 to 6599
Eastbourne Ave
Length: 0.50 miles
Direction: E-W
Address range: 6100 to 6599
Direction: E-W
Address range: 6100 to 6599
Cardiff Ave
Length: 0.41 miles
Direction: E-W
Address range: 6117 to 6699
Direction: E-W
Address range: 6117 to 6699
Hartwait St
Length: 0.33 miles
Direction: E-W
Address range: 6400 to 6699
Direction: E-W
Address range: 6400 to 6699
Dundalk Ave
Length: 0.30 miles
Direction: SE-NW
Direction: SE-NW
Elrino St
Length: 0.26 miles
Direction: N-S
Address range: 1500 to 1749
Direction: N-S
Address range: 1500 to 1749
Charlotte Ave
Length: 0.23 miles
Direction: N-S
Address range: 1500 to 1699
Direction: N-S
Address range: 1500 to 1699
Imla St
Length: 0.17 miles
Directions: N-S, SE-NW
Address range: 1500 to 1665
Directions: N-S, SE-NW
Address range: 1500 to 1665
Bessemer Ave
Length: 0.15 miles
Direction: E-W
Address range: 6172 to 6699
Direction: E-W
Address range: 6172 to 6699
Pumphrey St
Length: 0.11 miles
Direction: N-S
Address range: 1600 to 1705
Direction: N-S
Address range: 1600 to 1705
Malvern Ave
Length: 0.10 miles
Direction: N-S
Address range: 1601 to 1718
Direction: N-S
Address range: 1601 to 1718
Joplin St
Length: 0.09 miles
Direction: N-S
Address range: 1600 to 1716
Direction: N-S
Address range: 1600 to 1716
Marne Ave
Length: 0.05 miles
Direction: E-W
Address range: 6666 to 6699
Direction: E-W
Address range: 6666 to 6699
Kane St
Length: 0.04 miles
Direction: N-S
Address range: 1600 to 1699
Direction: N-S
Address range: 1600 to 1699