Brentridge neighborhood in Corona, California (CA), 92882 detailed profile
Settings
X


Business Search - 14 Million verified businesses
Area: 0.092 square miles
Population: 202
Population density:
| Brentridge: | 2,195 people per square mile |
| Corona: | 4,539 people per square mile |

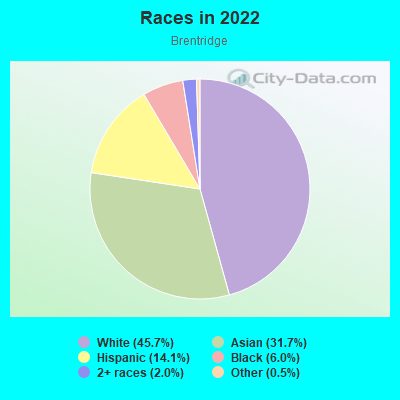
- 9145.7%White
- 6331.7%Asian
- 2814.1%Hispanic or Latino
- 126.0%Black
- 42.0%Two or more races
- 10.5%Some other race
Median household income in 2022:
| Brentridge: | $167,261 |
| Corona: | $99,953 |
Distribution of median household income
![Distribution of median household income]()
- 1Less than $10,000
- 3$20,000 to $29,999
- 1$30,000 to $39,999
- 3$50,000 to $59,999
- 3$60,000 to $74,999
- 2$75,000 to $99,999
- 3$100,000 to $124,999
- 12$125,000 to $149,999
- 11$150,000 to $199,999
- 23$200,000 or more

Distribution of owner-occupied house/condo value
![Distribution of owner-occupied house/condo value]()
- 2Less than $50,000
- 1$50,000 to $99,999
- 2$300,000 to $399,999
- 2$400,000 to $499,999
- 12$500,000 to $749,999
- 23$750,000 to $999,999
- 14$1,000,000 or more

Distribution of rent paid by renters
![Distribution of rent paid by renters]()
- 9$2,000 or more

Median rent in 2022:
| Brentridge: | $3,501 |
| Corona: | $1,994 |
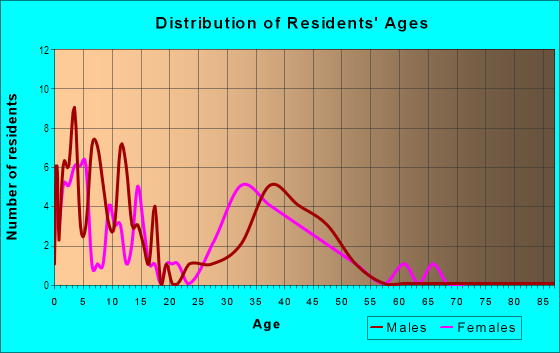
| Males: | 102 |
| Females: | 100 |
Males:
| This neighborhood: | 45.3 years |
| Whole city: | 32.2 years |
| This neighborhood: | 39.7 years |
| Whole city: | 38.1 years |
Average household size:
| Brentridge: | 3.7 people |
| Corona: | 3.4 people |
Percentage of family households:
| Brentridge: | 73.7% |
| Corona: | 57.2% |
| Here: | 79.3% |
| Corona: | 58.1% |
Percentage of married-couple families with children (among all households):
| Brentridge: | 27.2% |
| Corona: | 22.8% |
Percentage of single-mother households (among all households):
| Brentridge: | 1.1% |
| Corona: | 5.2% |
Percentage of never married males 15 years old and over:
Percentage of never married females 15 years old and over:
| Brentridge: | 18.7% |
| Corona: | 18.9% |
Percentage of never married females 15 years old and over:
| Brentridge: | 13.8% |
| city: | 20.0% |
Percentage of people that speak English not well or not at all:
| Brentridge: | 3.6% |
| Corona: | 8.4% |
Percentage of people born in this state:
Percentage of people born in another U.S. state:
Percentage of native residents but born outside the U.S.:
Percentage of foreign born residents:
| Here: | 66.2% |
| Corona: | 66.3% |
Percentage of people born in another U.S. state:
| Brentridge: | 15.7% |
| Corona: | 7.8% |
Percentage of native residents but born outside the U.S.:
| Here: | 2.0% |
| city: | 1.4% |
Percentage of foreign born residents:
| Here: | 16.1% |
| Corona: | 24.5% |
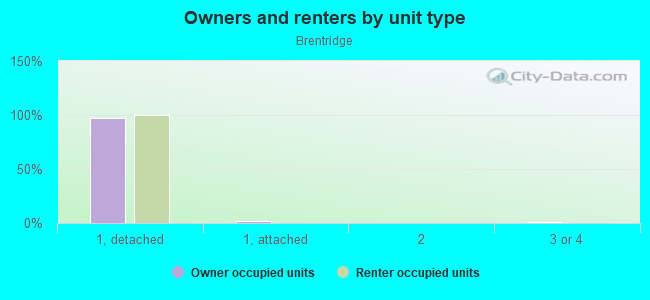
Owner-occupied
Renter-occupied

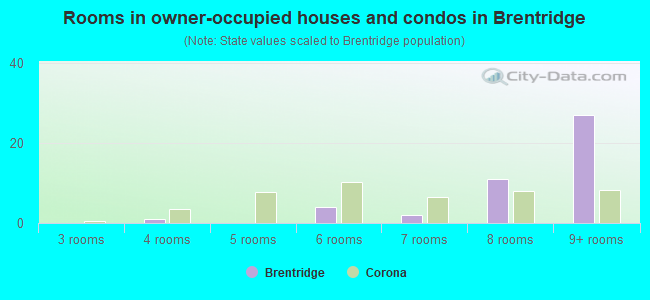
- Rooms in owner-occupied houses and condos in Brentridge
- 01 room
- 02 rooms
- 03 rooms
- 14 rooms
- 05 rooms
- 46 rooms
- 27 rooms
- 118 rooms
- 279+ rooms
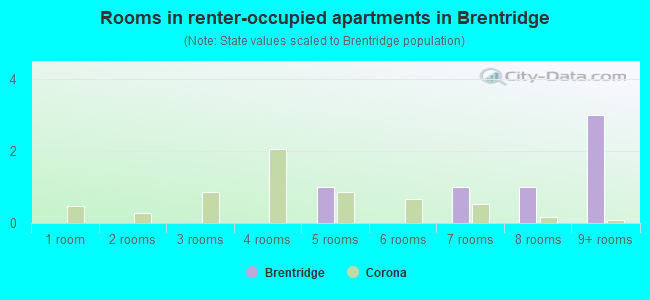
- Rooms in renter-occupied apartments in Brentridge
- 01 room
- 02 rooms
- 03 rooms
- 04 rooms
- 15 rooms
- 06 rooms
- 17 rooms
- 18 rooms
- 39+ rooms
Owner-occupied
Renter-occupied
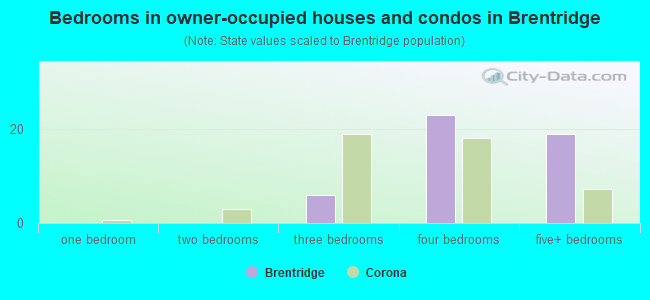
- Bedrooms in owner-occupied houses and condos in Brentridge
- 0no bedroom
- 01 bedroom
- 02 bedrooms
- 63 bedrooms
- 234 bedrooms
- 195+ bedrooms
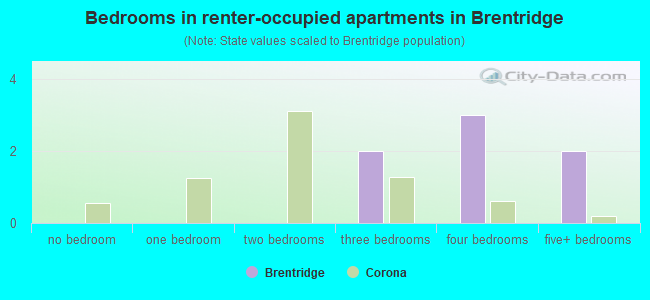
- Bedrooms in renter-occupied apartments in Brentridge
- 0no bedroom
- 01 bedroom
- 02 bedrooms
- 23 bedrooms
- 34 bedrooms
- 25+ bedrooms
Average number of cars or other vehicles available in houses/condos:
Average number of cars or other vehicles available in apartments:
| This neighborhood: | 2.8 |
| Corona: | 2.6 |
Average number of cars or other vehicles available in apartments:
| Here: | 1.0 |
| city: | 1.8 |
Percentage of units with a mortgage:
| Brentridge: | 75.3% |
| Corona: | 73.1% |
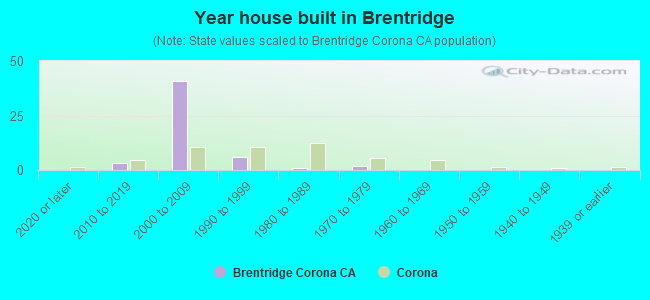
- Year house built in Brentridge
- 02020 or later
- 32010 to 2019
- 412000 to 2009
- 61990 to 1999
- 11980 to 1989
- 21970 to 1979
- 01960 to 1969
- 01950 to 1959
- 01940 to 1949
- 01939 or earlier
City-data.com crime index for city in 2020 (higher means more crime):
| City: | 160.4 |
| U.S. average: | 219.5 |
Travel time to work (commute)
![Travel time to work (commute)]()
- 1Less than 5 minutes
- 85 to 9 minutes
- 1310 to 14 minutes
- 615 to 19 minutes
- 920 to 24 minutes
- 425 to 29 minutes
- 1230 to 34 minutes
- 435 to 39 minutes
- 640 to 44 minutes
- 1245 to 59 minutes
- 1860 to 89 minutes
- 690 or more minutes

Means of transportation to work
![Means of transportation to work]()
- 58.6%60Drove a car alone
- 4.9%5Carpooled
- 1.0%1Long-distance train or commuter rail
- 4.9%5Other means
- 27.4%28Worked at home

Time leaving home to go to work
![Time leaving home to go to work]()
- 512:00 a.m. to 4:59 a.m.
- 35:00 a.m. to 5:29 a.m.
- 95:30 a.m. to 5:59 a.m.
- 126:00 a.m. to 6:29 a.m.
- 106:30 a.m. to 6:59 a.m.
- 217:00 a.m. to 7:29 a.m.
- 27:30 a.m. to 7:59 a.m.
- 178:00 a.m. to 8:29 a.m.
- 18:30 a.m. to 8:59 a.m.
- 79:00 a.m. to 9:59 a.m.
- 310:00 a.m. to 10:59 a.m.
- 512:00 p.m. to 3:59 p.m.
- 44:00 p.m. to 11:59 p.m.

Occupations of males:
- Percentage of males in management occupations (except farmers):
Here: 21.4% city: 11.6%
- Percentage of males in business and financial operations occupations:
Here: 6.4% city: 4.3%
- Percentage of males in computer and mathematical occupations:
Here: 3.5% city: 4.5%
- Percentage of males in architecture and engineering occupations:
Here: 6.0% city: 3.0%
- Percentage of males in community and social services occupations:
Here: 1.3% city: 1.3%
- Percentage of males in education, training, and library occupations:
Here: 11.0% city: 2.3%
- Percentage of males in arts, design, entertainment, sports, and media occupations:
Here: 1.7% city: 2.4%
- Percentage of males in healthcare practitioners and technical occupations:
Here: 5.2% city: 2.8%
- Percentage of males in service occupations:
Here: 9.1% city: 14.3%
- Percentage of males in sales and office occupations:
Here: 24.6% city: 19.0%
- Percentage of males in construction, extraction, and maintenance occupations:
Here: 1.4% city: 8.3%
- Percentage of males in production occupations:
Here: 1.6% city: 7.7%
- Percentage of males in transportation occupations:
Here: 5.1% city: 6.6%
- Percentage of males in material moving occupations:
Here: 1.7% city: 6.0%
Occupations of females:
- Percentage of females in management occupations (except farmers):
Here: 8.3% city: 9.7%
- Percentage of females in business and financial operations occupations:
Here: 3.8% city: 7.1%
- Percentage of females in computer and mathematical occupations:
Here: 4.5% city: 0.9%
- Percentage of females in life, physical, and social science occupations:
Here: 2.4% city: 0.7%
- Percentage of females in community and social services occupations:
Here: 1.6% city: 3.1%
- Percentage of females in legal occupations:
Here: 6.7% city: 1.2%
- Percentage of females in education, training, and library occupations:
Here: 18.7% city: 9.7%
- Percentage of females in arts, design, entertainment, sports, and media occupations:
Here: 1.3% city: 0.7%
- Percentage of females in healthcare practitioners and technical occupations:
Here: 9.0% city: 8.5%
- Percentage of females in service occupations:
Here: 23.0% city: 18.8%
- Percentage of females in sales and office occupations:
Here: 22.0% city: 30.9%
- Percentage of females in production occupations:
Here: 2.4% city: 3.8%
- Percentage of females in material moving occupations:
Here: 4.2% city: 3.1%
Education in this neighborhood (subdivision or community):
- Percentage of people 3 years and older in K-12 schools:
Brentridge: 21.2% Corona: 19.0%
- Percentage of people 3 years and older in undergraduate colleges:
Brentridge: 3.0% Corona: 7.2%
- Percentage of people 3 years and older in grad. or professional schools:
Brentridge: 0.5% Corona: 1.7%
- Percentage of students K-12 enrolled in private schools:
Brentridge: 7.1% Corona: 5.2%
Percentage of population below poverty level:
| Brentridge: | 2.4% |
| Corona: | 7.5% |
Median year owner moved in (as recorded in 2022):
Median year renter moved in (as recorded in 2022):
| Brentridge: | 2012 |
| Corona: | 2011 |
Median year renter moved in (as recorded in 2022):
| Brentridge: | 2015 |
| Corona: | 2019 |
Percentage of married-couple families with both working:
| Brentridge: | 94.4% |
| Corona: | 70.1% |
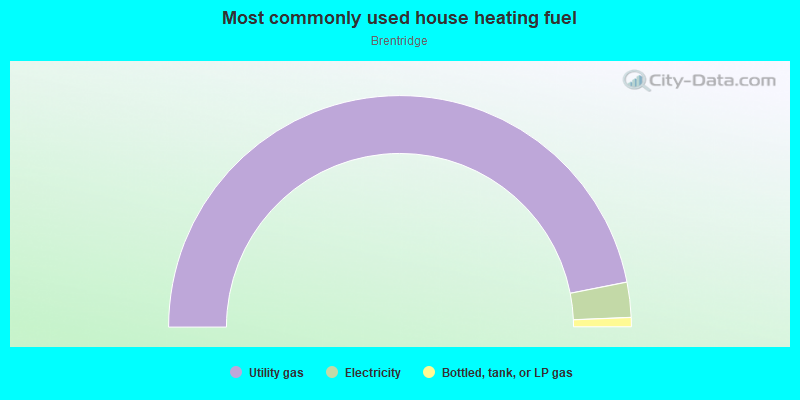
- 93.8%Utility gas
- 4.9%Electricity
- 1.3%Bottled, tank, or LP gas
Roads and streets:
Orange Heights Ln
Length: 0.43 miles
Directions: E-W, SE-NW
Address range: 800 to 999
Directions: E-W, SE-NW
Address range: 800 to 999
Malaga St
Length: 0.21 miles
Directions: N-S, SW-NE
Address range: 3700 to 3898
Directions: N-S, SW-NE
Address range: 3700 to 3898
Feather Peak Dr
Length: 0.18 miles
Directions: E-W, SE-NW
Address range: 800 to 999
Directions: E-W, SE-NW
Address range: 800 to 999
Windy Ridge Dr
Length: 0.13 miles
Direction: E-W
Address range: 800 to 931
Direction: E-W
Address range: 800 to 931
Logan Cir
Length: 0.12 miles
Direction: N-S
Address range: 3600 to 3699
Direction: N-S
Address range: 3600 to 3699
Rafferty Cir
Length: 0.06 miles
Direction: SW-NE
Address range: 3700 to 3799
Direction: SW-NE
Address range: 3700 to 3799
Hilgard St
Length: 0.06 miles
Direction: SW-NE
Address range: 3700 to 3799
Direction: SW-NE
Address range: 3700 to 3799
Atallah Dr
Length: 0.05 miles
Direction: SE-NW
Direction: SE-NW
Bear Pass Dr
Length: 0.04 miles
Directions: N-S, SE-NW
Address range: 3700 to 3799
Directions: N-S, SE-NW
Address range: 3700 to 3799
Mountain Gate Dr
Length: 0.04 miles
Direction: N-S
Direction: N-S
Huxley Cir
Length: 0.03 miles
Direction: SW-NE
Address range: 3600 to 3699
Direction: SW-NE
Address range: 3600 to 3699
Jepson Cir
Length: 0.03 miles
Direction: SW-NE
Address range: 3600 to 3699
Direction: SW-NE
Address range: 3600 to 3699
Solar Cir
Length: 0.03 miles
Direction: SW-NE
Address range: 1100 to 1145
Direction: SW-NE
Address range: 1100 to 1145
Fletcher Dr
Length: 0.01 miles
Direction: SE-NW
Direction: SE-NW