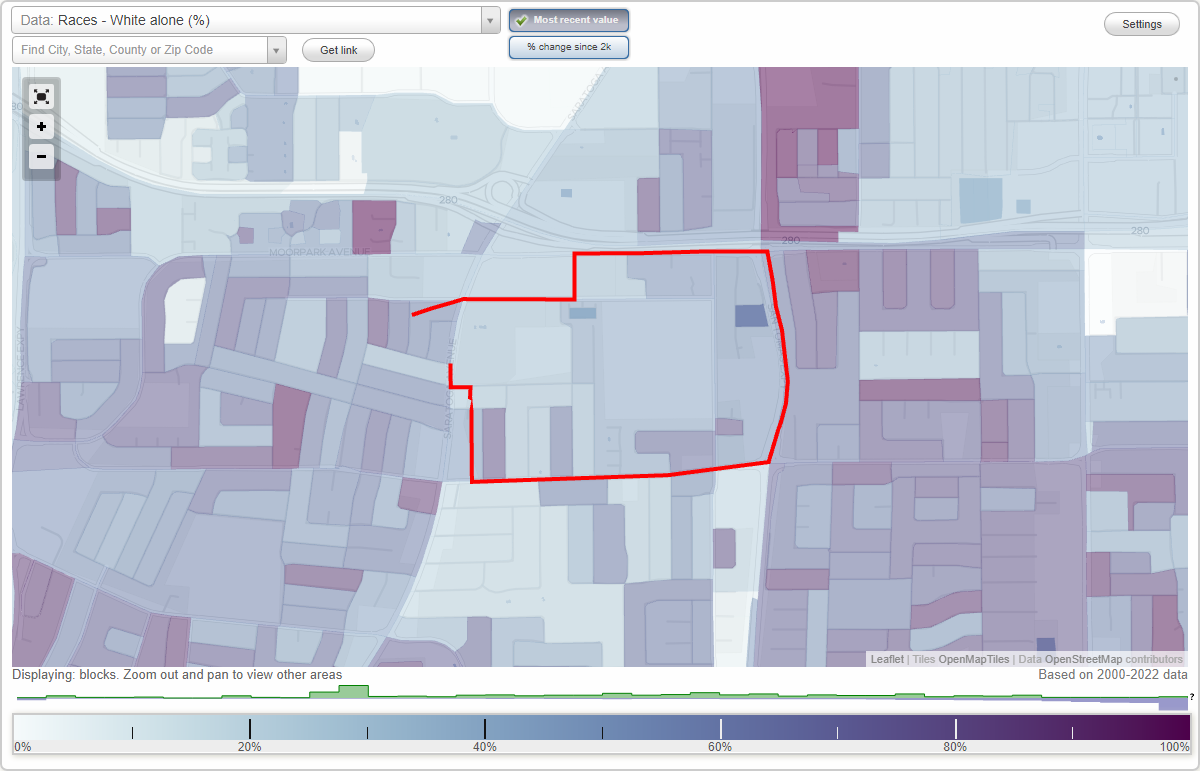
Blackford neighborhood in San Jose, California (CA), 95117 detailed profile
Settings
X

Business Search - 14 Million verified businesses
Area: 0.362 square miles
Population: 3,778
Population density:
| Blackford: | 10,447 people per square mile |
| San Jose: | 5,554 people per square mile |

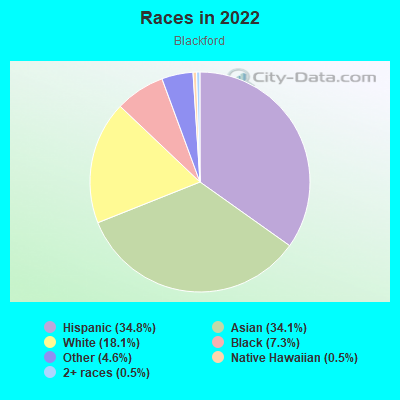
- 1,42734.8%Hispanic or Latino
- 1,39734.1%Asian
- 74218.1%White
- 2997.3%Black
- 1894.6%Some other race
- 210.5%Native Hawaiian and Other
Pacific Islander - 200.5%Two or more races
Median household income in 2022:
| Blackford: | $131,294 |
| San Jose: | $133,835 |
Distribution of median household income
![Distribution of median household income]()
- 103Less than $10,000
- 188$10,000 to $19,999
- 154$20,000 to $29,999
- 62$30,000 to $39,999
- 259$40,000 to $49,999
- 119$50,000 to $59,999
- 47$60,000 to $74,999
- 255$75,000 to $99,999
- 77$100,000 to $124,999
- 70$125,000 to $149,999
- 104$150,000 to $199,999
- 338$200,000 or more

Distribution of owner-occupied house/condo value
![Distribution of owner-occupied house/condo value]()
- 30Less than $50,000
- 5$50,000 to $99,999
- 4$100,000 to $149,999
- 57$500,000 to $749,999
- 64$750,000 to $999,999
- 458$1,000,000 or more

Distribution of rent paid by renters
![Distribution of rent paid by renters]()
- 16Less than $100
- 45$200 to $299
- 4$300 to $399
- 48$400 to $499
- 355$1,000 to $1,249
- 67$1,250 to $1,499
- 48$1,500 to $1,999
- 629$2,000 or more

Median rent in 2022:
| Blackford: | $2,375 |
| San Jose: | $2,001 |
| Males: | 2,224 |
| Females: | 1,554 |
Males:
| This neighborhood: | 38.4 years |
| Whole city: | 37.6 years |
| This neighborhood: | 41.2 years |
| Whole city: | 39.1 years |
Average household size:
| Blackford: | 8.3 people |
| San Jose: | 2.9 people |
Percentage of family households:
| Blackford: | 61.6% |
| San Jose: | 49.9% |
| Here: | 50.4% |
| San Jose: | 53.0% |
Percentage of married-couple families with children (among all households):
| Blackford: | 16.1% |
| San Jose: | 25.8% |
Percentage of single-mother households (among all households):
| Blackford: | 12.8% |
| San Jose: | 5.2% |
Percentage of never married males 15 years old and over:
Percentage of never married females 15 years old and over:
| Blackford: | 24.6% |
| San Jose: | 20.9% |
Percentage of never married females 15 years old and over:
| Blackford: | 9.2% |
| city: | 16.7% |
Percentage of people that speak English not well or not at all:
| Blackford: | 16.1% |
| San Jose: | 11.4% |
Percentage of people born in this state:
Percentage of people born in another U.S. state:
Percentage of native residents but born outside the U.S.:
Percentage of foreign born residents:
| Here: | 39.6% |
| San Jose: | 46.1% |
Percentage of people born in another U.S. state:
| Blackford: | 9.1% |
| San Jose: | 10.4% |
Percentage of native residents but born outside the U.S.:
| Here: | 0.8% |
| city: | 1.7% |
Percentage of foreign born residents:
| Here: | 51.4% |
| San Jose: | 41.8% |
Owner-occupied
Renter-occupied

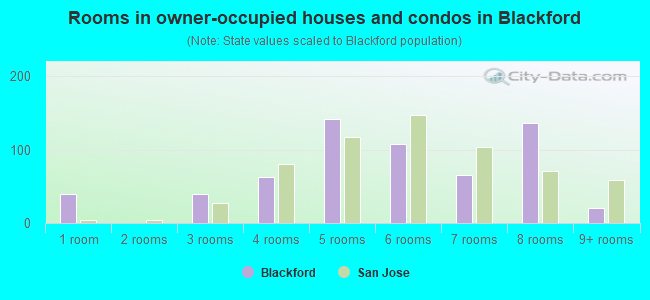
- Rooms in owner-occupied houses and condos in Blackford
- 401 room
- 02 rooms
- 393 rooms
- 634 rooms
- 1415 rooms
- 1086 rooms
- 667 rooms
- 1368 rooms
- 209+ rooms
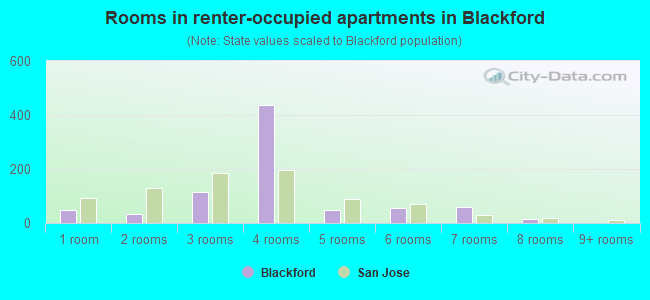
- Rooms in renter-occupied apartments in Blackford
- 501 room
- 352 rooms
- 1163 rooms
- 4384 rooms
- 505 rooms
- 566 rooms
- 607 rooms
- 168 rooms
- 09+ rooms
Owner-occupied
Renter-occupied
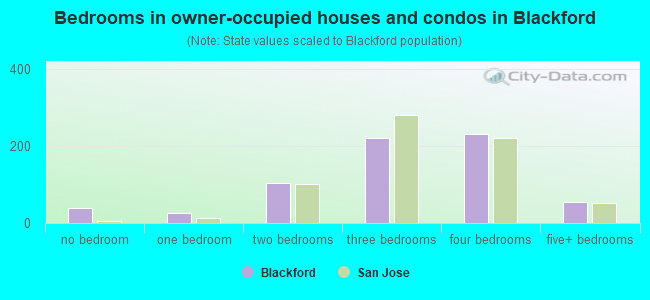
- Bedrooms in owner-occupied houses and condos in Blackford
- 40no bedroom
- 261 bedroom
- 1032 bedrooms
- 2203 bedrooms
- 2314 bedrooms
- 545+ bedrooms
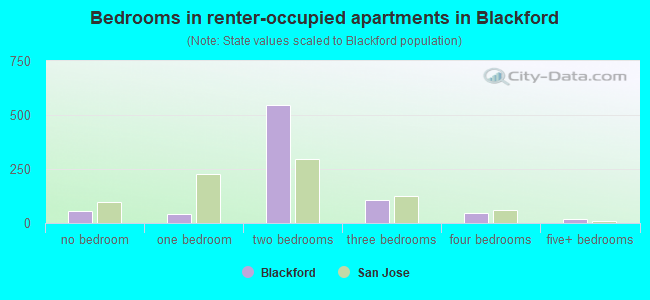
- Bedrooms in renter-occupied apartments in Blackford
- 56no bedroom
- 401 bedroom
- 5452 bedrooms
- 1083 bedrooms
- 474 bedrooms
- 195+ bedrooms
Average number of cars or other vehicles available in houses/condos:
Average number of cars or other vehicles available in apartments:
| This neighborhood: | 1.9 |
| San Jose: | 2.3 |
Average number of cars or other vehicles available in apartments:
| Here: | 1.9 |
| city: | 1.6 |
Percentage of units with a mortgage:
| Blackford: | 65.3% |
| San Jose: | 66.9% |
Average estimated value of detached houses in 2022 (39.3% of all units):
| Blackford: | $1,571,040 |
| San Jose: | $1,532,815 |
- Year house built in Blackford
- 162020 or later
- 1702010 to 2019
- 372000 to 2009
- 1791990 to 1999
- 1401980 to 1989
- 5781970 to 1979
- 3221960 to 1969
- 1031950 to 1959
- 321940 to 1949
- 401939 or earlier
City-data.com crime index for city in 2020 (higher means more crime):
| City: | 268.4 |
| U.S. average: | 219.5 |
Travel time to work (commute)
![Travel time to work (commute)]()
- 215 to 9 minutes
- 13110 to 14 minutes
- 30215 to 19 minutes
- 8420 to 24 minutes
- 16525 to 29 minutes
- 30930 to 34 minutes
- 1935 to 39 minutes
- 540 to 44 minutes
- 11145 to 59 minutes
- 11460 to 89 minutes
- 5590 or more minutes

Means of transportation to work
![Means of transportation to work]()
- 69.6%1,201Drove a car alone
- 12.9%223Carpooled
- 3.1%53Bus
- 0.8%13Subway or elevated rail
- 1.2%21Long-distance train or commuter rail
- 1.1%19Motorcycle
- 2.2%38Bicycle
- 0.9%16Walked
- 1.0%17Other means
- 17.7%306Worked at home

Time leaving home to go to work
![Time leaving home to go to work]()
- 912:00 a.m. to 4:59 a.m.
- 195:00 a.m. to 5:29 a.m.
- 185:30 a.m. to 5:59 a.m.
- 546:00 a.m. to 6:29 a.m.
- 2236:30 a.m. to 6:59 a.m.
- 1017:00 a.m. to 7:29 a.m.
- 1167:30 a.m. to 7:59 a.m.
- 1638:00 a.m. to 8:29 a.m.
- 1638:30 a.m. to 8:59 a.m.
- 2219:00 a.m. to 9:59 a.m.
- 5710:00 a.m. to 10:59 a.m.
- 2111:00 a.m. to 11:59 a.m.
- 1512:00 p.m. to 3:59 p.m.
- 794:00 p.m. to 11:59 p.m.

Occupations of males:
- Percentage of males in management occupations (except farmers):
Here: 10.3% city: 13.0%
- Percentage of males in computer and mathematical occupations:
Here: 9.1% city: 13.6%
- Percentage of males in architecture and engineering occupations:
Here: 11.2% city: 10.2%
- Percentage of males in life, physical, and social science occupations:
Here: 7.2% city: 1.1%
- Percentage of males in community and social services occupations:
Here: 1.3% city: 0.8%
- Percentage of males in legal occupations:
Here: 2.1% city: 0.8%
- Percentage of males in service occupations:
Here: 14.0% city: 12.7%
- Percentage of males in sales and office occupations:
Here: 12.4% city: 12.8%
- Percentage of males in construction, extraction, and maintenance occupations:
Here: 16.2% city: 7.8%
- Percentage of males in production occupations:
Here: 13.1% city: 5.5%
- Percentage of males in transportation occupations:
Here: 2.0% city: 3.6%
Occupations of females:
- Percentage of females in management occupations (except farmers):
Here: 4.4% city: 11.0%
- Percentage of females in business and financial operations occupations:
Here: 7.6% city: 8.6%
- Percentage of females in computer and mathematical occupations:
Here: 4.9% city: 5.4%
- Percentage of females in architecture and engineering occupations:
Here: 15.4% city: 2.8%
- Percentage of females in life, physical, and social science occupations:
Here: 1.1% city: 1.7%
- Percentage of females in legal occupations:
Here: 3.3% city: 1.3%
- Percentage of females in education, training, and library occupations:
Here: 3.4% city: 8.1%
- Percentage of females in arts, design, entertainment, sports, and media occupations:
Here: 7.2% city: 2.0%
- Percentage of females in healthcare practitioners and technical occupations:
Here: 2.4% city: 6.8%
- Percentage of females in service occupations:
Here: 7.5% city: 21.7%
- Percentage of females in sales and office occupations:
Here: 33.7% city: 22.0%
- Percentage of females in production occupations:
Here: 9.1% city: 4.0%
Percentage of people 16-64 in Armed Forces:
| Blackford: | 0.5% |
| San Jose: | 0.0% |
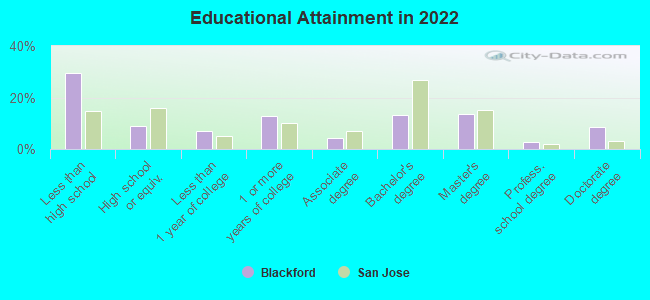
Education in this neighborhood (subdivision or community):
- Percentage of people 3 years and older in K-12 schools:
Blackford: 23.3% San Jose: 16.1%
- Percentage of people 3 years and older in undergraduate colleges:
Blackford: 2.8% San Jose: 6.5%
- Percentage of people 3 years and older in grad. or professional schools:
Blackford: 1.9% San Jose: 2.0%
- Percentage of students K-12 enrolled in private schools:
Blackford: 28.6% San Jose: 14.9%
Percentage of population below poverty level:
| Blackford: | 12.3% |
| San Jose: | 9.0% |
Median year owner moved in (as recorded in 2022):
Median year renter moved in (as recorded in 2022):
| Blackford: | 2001 |
| San Jose: | 2008 |
Median year renter moved in (as recorded in 2022):
| Blackford: | 2016 |
| San Jose: | 2020 |
Percentage of married-couple families with both working:
| Blackford: | 72.0% |
| San Jose: | 72.5% |
- 56.7%Utility gas
- 29.4%Electricity
- 5.3%No fuel used
- 4.9%Solar energy
- 3.7%Bottled, tank, or LP gas
Roads and streets:
Williams Rd
Length: 0.69 miles
Direction: E-W
Address range: 3700 to 4149
Direction: E-W
Address range: 3700 to 4149
Boynton Ave
Length: 0.51 miles
Direction: N-S
Address range: 600 to 999
Direction: N-S
Address range: 600 to 999
Hibiscus Ln
Length: 0.43 miles
Directions: E-W, N-S, SE-NW
Address range: 796 to 999
Directions: E-W, N-S, SE-NW
Address range: 796 to 999
Blackford Ave
Length: 0.39 miles
Direction: E-W
Address range: 3700 to 4152
Direction: E-W
Address range: 3700 to 4152
Daffodil Way
Length: 0.36 miles
Direction: N-S
Address range: 700 to 999
Direction: N-S
Address range: 700 to 999
Manzanita Dr
Length: 0.31 miles
Direction: E-W
Address range: 3900 to 4129
Direction: E-W
Address range: 3900 to 4129
Hamann Dr
Length: 0.25 miles
Direction: N-S
Address range: 600 to 899
Direction: N-S
Address range: 600 to 899
Underwood Dr
Length: 0.24 miles
Directions: E-W, SW-NE
Address range: 3700 to 3899
Directions: E-W, SW-NE
Address range: 3700 to 3899
Desert Isle Dr
Length: 0.22 miles
Direction: N-S
Address range: 800 to 999
Direction: N-S
Address range: 800 to 999
Blackford Cir
Length: 0.22 miles
Directions: E-W, N-S
Address range: 4121 to 4199
Directions: E-W, N-S
Address range: 4121 to 4199
Cabernet Vineyards Cir
Length: 0.20 miles
Directions: E-W, N-S, SE-NW, SW-NE
Address range: 3601 to 3699
Directions: E-W, N-S, SE-NW, SW-NE
Address range: 3601 to 3699
Olga Dr
Length: 0.20 miles
Directions: E-W, SW-NE
Address range: 3900 to 4149
Directions: E-W, SW-NE
Address range: 3900 to 4149
Gretchen Ln
Length: 0.17 miles
Direction: N-S
Address range: 900 to 999
Direction: N-S
Address range: 900 to 999
Camellia Way
Length: 0.17 miles
Direction: N-S
Address range: 900 to 999
Direction: N-S
Address range: 900 to 999
Orchid Way
Length: 0.17 miles
Directions: N-S, SW-NE
Address range: 900 to 999
Directions: N-S, SW-NE
Address range: 900 to 999
Panda Dr
Length: 0.12 miles
Direction: N-S
Direction: N-S
Moorpark Ave
Length: 0.11 miles
Direction: E-W
Address range: 3650 to 3699
Direction: E-W
Address range: 3650 to 3699
Larkmead Rd
Length: 0.10 miles
Directions: N-S, SE-NW, SW-NE
Directions: N-S, SE-NW, SW-NE
Barker Dr
Length: 0.10 miles
Directions: E-W, SE-NW
Address range: 3800 to 3899
Directions: E-W, SE-NW
Address range: 3800 to 3899
Lindenwood Dr
Length: 0.10 miles
Direction: E-W
Address range: 3600 to 3699
Direction: E-W
Address range: 3600 to 3699
Debra Way
Length: 0.08 miles
Directions: E-W, SW-NE
Address range: 3600 to 3699
Directions: E-W, SW-NE
Address range: 3600 to 3699
Hibiscus Pl
Length: 0.07 miles
Directions: E-W, N-S, SE-NW, SW-NE
Address range: 705 to 799
Directions: E-W, N-S, SE-NW, SW-NE
Address range: 705 to 799
Blackford Ct
Length: 0.05 miles
Directions: N-S, SW-NE
Address range: 600 to 699
Directions: N-S, SW-NE
Address range: 600 to 699
Keltner Ave
Length: 0.05 miles
Directions: N-S, SE-NW
Address range: 900 to 999
Directions: N-S, SE-NW
Address range: 900 to 999
Temple Dr
Length: 0.05 miles
Directions: N-S, SE-NW, SW-NE
Address range: 900 to 999
Directions: N-S, SE-NW, SW-NE
Address range: 900 to 999
Panda Ct
Length: 0.04 miles
Direction: E-W
Direction: E-W
Panda Pl
Length: 0.04 miles
Direction: E-W
Address range: 3800 to 3899
Direction: E-W
Address range: 3800 to 3899
Panda Ln
Length: 0.04 miles
Direction: E-W
Address range: 3800 to 3899
Direction: E-W
Address range: 3800 to 3899
Cabernet Vineyards Ct
Length: 0.03 miles
Direction: N-S
Address range: 924 to 999
Direction: N-S
Address range: 924 to 999
Blackford Cl
Length: 0.01 miles
Direction: N-S
Direction: N-S