Beverly (Wilshire) neighborhood in San Jose, California (CA), 95116 detailed profile
Settings
X


Business Search - 14 Million verified businesses
Area: 0.104 square miles
Population: 1,228
Population density:
| Beverly (Wilshire): | 11,770 people per square mile |
| San Jose: | 5,554 people per square mile |

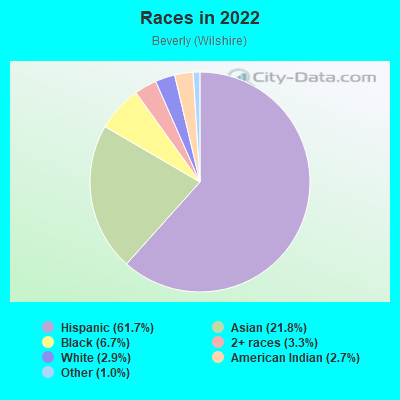
- 78561.7%Hispanic or Latino
- 27721.8%Asian
- 856.7%Black
- 423.3%Two or more races
- 372.9%White
- 342.7%American Indian
- 131.0%Some other race
Median household income in 2022:
| Beverly (Wilshire): | $66,008 |
| San Jose: | $133,835 |
Distribution of median household income
![Distribution of median household income]()
- 24Less than $10,000
- 26$10,000 to $19,999
- 56$20,000 to $29,999
- 59$30,000 to $39,999
- 52$40,000 to $49,999
- 28$50,000 to $59,999
- 38$60,000 to $74,999
- 32$75,000 to $99,999
- 42$100,000 to $124,999
- 29$125,000 to $149,999
- 67$150,000 to $199,999
- 65$200,000 or more

Distribution of owner-occupied house/condo value
![Distribution of owner-occupied house/condo value]()
- 4Less than $50,000
- 2$50,000 to $99,999
- 4$150,000 to $199,999
- 7$200,000 to $249,999
- 29$300,000 to $399,999
- 8$400,000 to $499,999
- 67$500,000 to $749,999
- 52$750,000 to $999,999
- 28$1,000,000 or more

Distribution of rent paid by renters
![Distribution of rent paid by renters]()
- 12Less than $100
- 40$100 to $199
- 61$200 to $299
- 18$300 to $399
- 25$400 to $499
- 28$500 to $599
- 18$600 to $699
- 17$700 to $799
- 6$800 to $899
- 25$900 to $999
- 27$1,000 to $1,249
- 5$1,250 to $1,499
- 62$1,500 to $1,999
- 119$2,000 or more

Median rent in 2022:
| Beverly (Wilshire): | $1,853 |
| San Jose: | $2,001 |
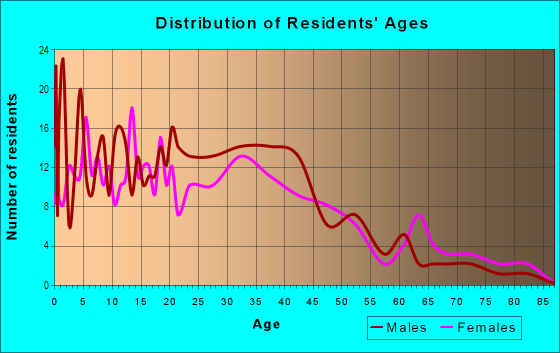
| Males: | 640 |
| Females: | 588 |
Males:
| This neighborhood: | 38.4 years |
| Whole city: | 37.6 years |
| This neighborhood: | 37.8 years |
| Whole city: | 39.1 years |
Average household size:
| Beverly (Wilshire): | 12.1 people |
| San Jose: | 2.9 people |
Percentage of family households:
| Beverly (Wilshire): | 69.3% |
| San Jose: | 49.9% |
| Here: | 63.6% |
| San Jose: | 53.0% |
Percentage of married-couple families with children (among all households):
| Beverly (Wilshire): | 22.2% |
| San Jose: | 25.8% |
Percentage of single-mother households (among all households):
| Beverly (Wilshire): | 2.5% |
| San Jose: | 5.2% |
Percentage of never married males 15 years old and over:
Percentage of never married females 15 years old and over:
| Beverly (Wilshire): | 19.5% |
| San Jose: | 20.9% |
Percentage of never married females 15 years old and over:
| Beverly (Wilshire): | 15.8% |
| city: | 16.7% |
Percentage of people that speak English not well or not at all:
| Beverly (Wilshire): | 17.6% |
| San Jose: | 11.4% |
Percentage of people born in this state:
Percentage of people born in another U.S. state:
Percentage of native residents but born outside the U.S.:
Percentage of foreign born residents:
| Here: | 43.7% |
| San Jose: | 46.1% |
Percentage of people born in another U.S. state:
| Beverly (Wilshire): | 2.6% |
| San Jose: | 10.4% |
Percentage of native residents but born outside the U.S.:
| Here: | 2.3% |
| city: | 1.7% |
Percentage of foreign born residents:
| Here: | 51.3% |
| San Jose: | 41.8% |
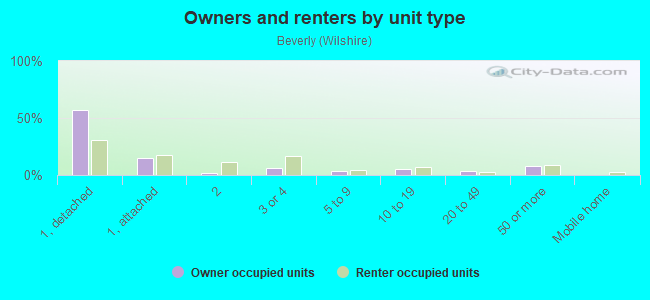
Owner-occupied
Renter-occupied

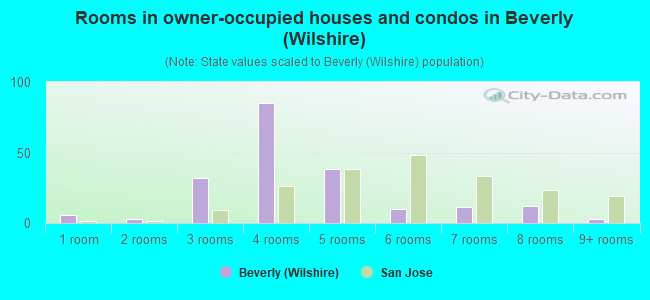
- Rooms in owner-occupied houses and condos in Beverly <
> - 61 room
- 32 rooms
- 323 rooms
- 854 rooms
- 385 rooms
- 106 rooms
- 117 rooms
- 128 rooms
- 39+ rooms
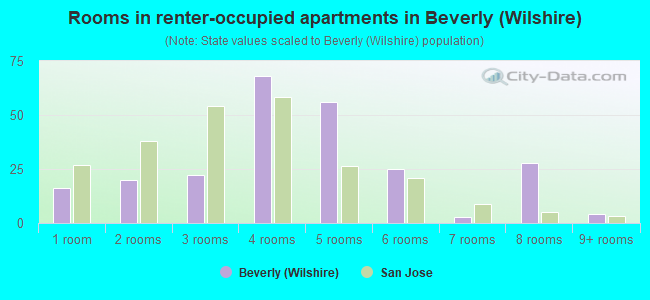
- Rooms in renter-occupied apartments in Beverly <
> - 161 room
- 202 rooms
- 223 rooms
- 684 rooms
- 565 rooms
- 256 rooms
- 37 rooms
- 288 rooms
- 49+ rooms
Owner-occupied
Renter-occupied
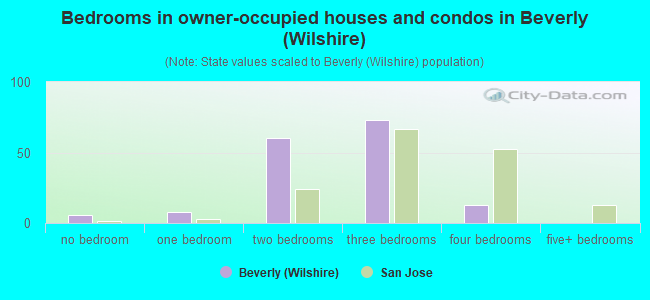
- Bedrooms in owner-occupied houses and condos in Beverly <
> - 6no bedroom
- 81 bedroom
- 602 bedrooms
- 733 bedrooms
- 134 bedrooms
- 05+ bedrooms
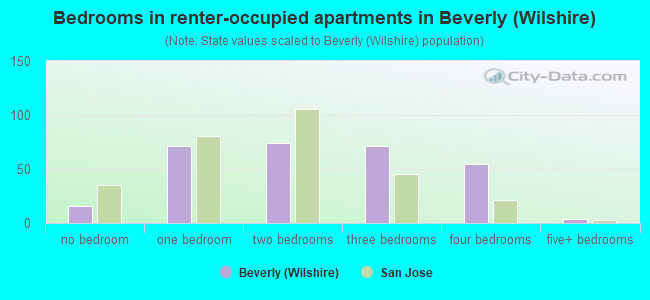
- Bedrooms in renter-occupied apartments in Beverly <
> - 16no bedroom
- 711 bedroom
- 742 bedrooms
- 713 bedrooms
- 554 bedrooms
- 45+ bedrooms
Average number of cars or other vehicles available in houses/condos:
Average number of cars or other vehicles available in apartments:
| This neighborhood: | 2.3 |
| San Jose: | 2.3 |
Average number of cars or other vehicles available in apartments:
| Here: | 2.2 |
| city: | 1.6 |
Percentage of units with a mortgage:
| Beverly (Wilshire): | 51.3% |
| San Jose: | 66.9% |
Average estimated value of detached houses in 2022 (59.2% of all units):
| Beverly (Wilshire): | $876,135 |
| San Jose: | $1,532,815 |
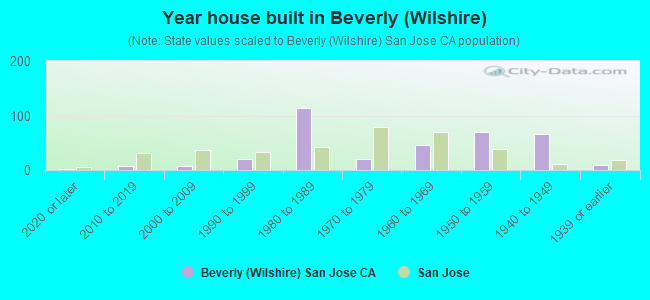
- Year house built in Beverly <
> - 22020 or later
- 82010 to 2019
- 72000 to 2009
- 201990 to 1999
- 1141980 to 1989
- 201970 to 1979
- 451960 to 1969
- 691950 to 1959
- 661940 to 1949
- 101939 or earlier
City-data.com crime index for city in 2020 (higher means more crime):
| City: | 268.4 |
| U.S. average: | 219.5 |
Travel time to work (commute)
![Travel time to work (commute)]()
- 3Less than 5 minutes
- 175 to 9 minutes
- 9010 to 14 minutes
- 10315 to 19 minutes
- 23720 to 24 minutes
- 8225 to 29 minutes
- 9330 to 34 minutes
- 1635 to 39 minutes
- 3040 to 44 minutes
- 2445 to 59 minutes
- 5560 to 89 minutes
- 190 or more minutes

Means of transportation to work
![Means of transportation to work]()
- 67.7%321Drove a car alone
- 22.8%108Carpooled
- 10.3%49Bus
- 1.7%8Subway or elevated rail
- 0.8%4Long-distance train or commuter rail
- 0.4%2Taxi
- 0.4%2Motorcycle
- 6.1%29Walked
- 2.1%10Other means
- 2.1%10Worked at home

Time leaving home to go to work
![Time leaving home to go to work]()
- 2112:00 a.m. to 4:59 a.m.
- 1155:00 a.m. to 5:29 a.m.
- 675:30 a.m. to 5:59 a.m.
- 806:00 a.m. to 6:29 a.m.
- 796:30 a.m. to 6:59 a.m.
- 1017:00 a.m. to 7:29 a.m.
- 207:30 a.m. to 7:59 a.m.
- 668:00 a.m. to 8:29 a.m.
- 288:30 a.m. to 8:59 a.m.
- 519:00 a.m. to 9:59 a.m.
- 1810:00 a.m. to 10:59 a.m.
- 311:00 a.m. to 11:59 a.m.
- 7712:00 p.m. to 3:59 p.m.
- 294:00 p.m. to 11:59 p.m.

Occupations of males:
- Percentage of males in management occupations (except farmers):
Here: 16.7% city: 13.0%
- Percentage of males in community and social services occupations:
Here: 6.1% city: 0.8%
- Percentage of males in education, training, and library occupations:
Here: 14.9% city: 2.8%
- Percentage of males in arts, design, entertainment, sports, and media occupations:
Here: 2.0% city: 1.8%
- Percentage of males in service occupations:
Here: 11.7% city: 12.7%
- Percentage of males in sales and office occupations:
Here: 18.3% city: 12.8%
- Percentage of males in construction, extraction, and maintenance occupations:
Here: 1.7% city: 7.8%
- Percentage of males in production occupations:
Here: 1.5% city: 5.5%
- Percentage of males in transportation occupations:
Here: 10.5% city: 3.6%
- Percentage of males in material moving occupations:
Here: 10.0% city: 3.1%
Occupations of females:
- Percentage of females in management occupations (except farmers):
Here: 14.5% city: 11.0%
- Percentage of females in business and financial operations occupations:
Here: 3.6% city: 8.6%
- Percentage of females in community and social services occupations:
Here: 3.9% city: 1.8%
- Percentage of females in education, training, and library occupations:
Here: 10.1% city: 8.1%
- Percentage of females in healthcare practitioners and technical occupations:
Here: 3.8% city: 6.8%
- Percentage of females in service occupations:
Here: 37.1% city: 21.7%
- Percentage of females in sales and office occupations:
Here: 3.7% city: 22.0%
- Percentage of females in production occupations:
Here: 16.7% city: 4.0%
- Percentage of females in transportation occupations:
Here: 5.3% city: 0.7%
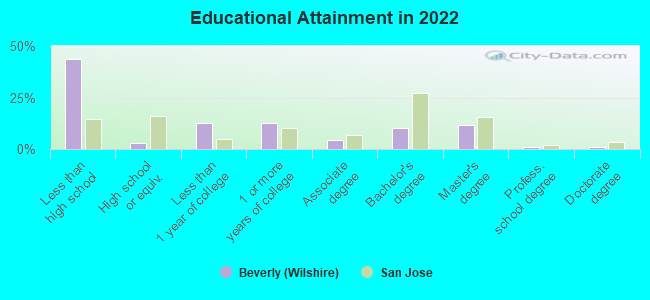
Education in this neighborhood (subdivision or community):
- Percentage of people 3 years and older in K-12 schools:
Beverly (Wilshire): 25.6% San Jose: 16.1%
- Percentage of people 3 years and older in undergraduate colleges:
Beverly (Wilshire): 3.5% San Jose: 6.5%
- Percentage of people 3 years and older in grad. or professional schools:
Beverly (Wilshire): 2.4% San Jose: 2.0%
- Percentage of students K-12 enrolled in private schools:
Beverly (Wilshire): 8.6% San Jose: 14.9%
Percentage of population below poverty level:
| Beverly (Wilshire): | 6.4% |
| San Jose: | 9.0% |
Median year owner moved in (as recorded in 2022):
Median year renter moved in (as recorded in 2022):
| Beverly (Wilshire): | 2005 |
| San Jose: | 2008 |
Median year renter moved in (as recorded in 2022):
| Beverly (Wilshire): | 2013 |
| San Jose: | 2020 |
Percentage of married-couple families with both working:
| Beverly (Wilshire): | 52.7% |
| San Jose: | 72.5% |
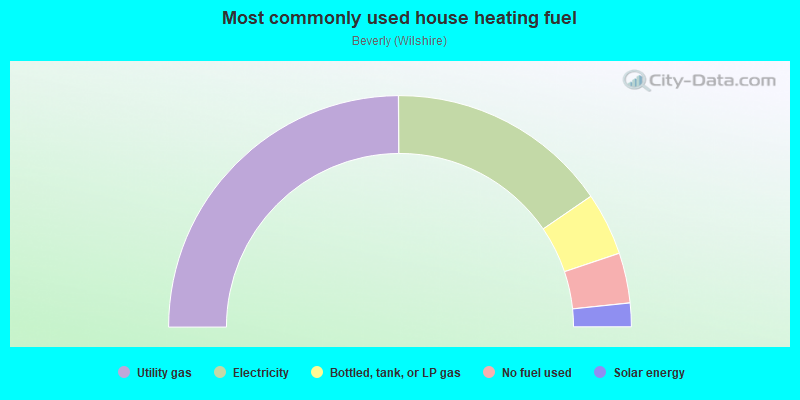
- 49.8%Utility gas
- 31.1%Electricity
- 8.8%Bottled, tank, or LP gas
- 7.0%No fuel used
- 3.3%Solar energy
Roads and streets:
Silcreek Dr
Length: 0.27 miles
Directions: E-W, N-S, SE-NW, SW-NE
Address range: 1 to 299
Directions: E-W, N-S, SE-NW, SW-NE
Address range: 1 to 299
Balboa Ave
Length: 0.27 miles
Directions: N-S, SE-NW, SW-NE
Address range: 1 to 199
Directions: N-S, SE-NW, SW-NE
Address range: 1 to 199
Magellan Ave
Length: 0.26 miles
Direction: SE-NW
Address range: 1 to 199
Direction: SE-NW
Address range: 1 to 199
Beverly Blvd
Length: 0.25 miles
Directions: E-W, SE-NW, SW-NE
Address range: 1700 to 1999
Directions: E-W, SE-NW, SW-NE
Address range: 1700 to 1999
Basch Ave
Length: 0.23 miles
Direction: SE-NW
Address range: 1 to 199
Direction: SE-NW
Address range: 1 to 199
Melrose Ave
Length: 0.22 miles
Direction: SE-NW
Address range: 1 to 199
Direction: SE-NW
Address range: 1 to 199
E St James St
Length: 0.17 miles
Directions: E-W, SW-NE
Address range: 1800 to 1999
Directions: E-W, SW-NE
Address range: 1800 to 1999
Wilshire Blvd
Length: 0.12 miles
Direction: SW-NE
Address range: 1750 to 1899
Direction: SW-NE
Address range: 1750 to 1899
Cll de Plata
Length: 0.10 miles
Directions: E-W, SE-NW
Address range: 1727 to 1745
Directions: E-W, SE-NW
Address range: 1727 to 1745
Checkers Dr
Length: 0.07 miles
Directions: SE-NW, SW-NE
Directions: SE-NW, SW-NE
Other features:
Silver Crk
Length: 0.20 miles
Directions: E-W, SE-NW
Directions: E-W, SE-NW