Berkeley Hills neighborhood in Denver, Colorado (CO), 80221 detailed profile
Settings
X


Business Search - 14 Million verified businesses
Area: 0.051 square miles
Population: 244
Population density:
| Berkeley Hills: | 4,829 people per square mile |
| Denver: | 4,651 people per square mile |

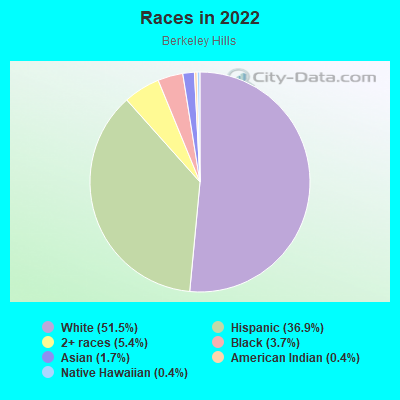
- 12451.5%White
- 8936.9%Hispanic or Latino
- 135.4%Two or more races
- 93.7%Black
- 41.7%Asian
- 10.4%American Indian
- 10.4%Native Hawaiian and Other
Pacific Islander
Median household income in 2022:
| Berkeley Hills: | $40,682 |
| Denver: | $88,213 |
Distribution of median household income
![Distribution of median household income]()
- 14Less than $10,000
- 28$10,000 to $19,999
- 15$20,000 to $29,999
- 20$30,000 to $39,999
- 8$40,000 to $49,999
- 16$50,000 to $59,999
- 10$60,000 to $74,999
- 21$75,000 to $99,999
- 5$100,000 to $124,999
- 3$125,000 to $149,999
- 10$150,000 to $199,999
- 5$200,000 or more

Distribution of owner-occupied house/condo value
![Distribution of owner-occupied house/condo value]()
- 2Less than $50,000
- 2$50,000 to $99,999
- 2$150,000 to $199,999
- 5$250,000 to $299,999
- 21$300,000 to $399,999
- 18$400,000 to $499,999
- 23$500,000 to $749,999
- 3$750,000 to $999,999
- 3$1,000,000 or more

Distribution of rent paid by renters
![Distribution of rent paid by renters]()
- 11$100 to $199
- 3$500 to $599
- 2$600 to $699
- 13$700 to $799
- 20$800 to $899
- 15$1,000 to $1,249
- 8$1,250 to $1,499
- 3$1,500 to $1,999
- 10$2,000 or more

Median rent in 2022:
| Berkeley Hills: | $860 |
| Denver: | $1,623 |
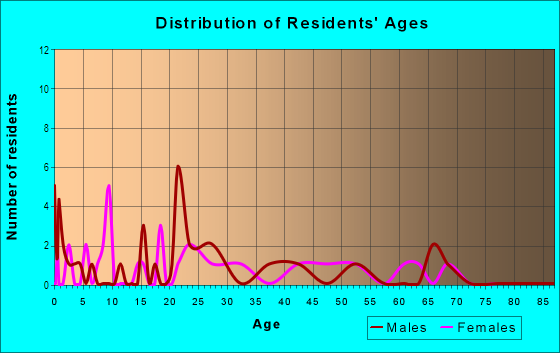
| Males: | 94 |
| Females: | 149 |
Males:
| This neighborhood: | 43.3 years |
| Whole city: | 35.2 years |
| This neighborhood: | 59.7 years |
| Whole city: | 35.1 years |
Average household size:
| Berkeley Hills: | 1.5 people |
| Denver: | 28.0 people |
Percentage of family households:
| Berkeley Hills: | 22.0% |
| Denver: | 35.1% |
| Here: | 25.3% |
| Denver: | 32.5% |
Percentage of married-couple families with children (among all households):
| Berkeley Hills: | 40.9% |
| Denver: | 32.4% |
Percentage of single-mother households (among all households):
| Berkeley Hills: | 19.7% |
| Denver: | 10.3% |
Percentage of never married males 15 years old and over:
Percentage of never married females 15 years old and over:
| Berkeley Hills: | 12.8% |
| Denver: | 25.0% |
Percentage of never married females 15 years old and over:
| Berkeley Hills: | 18.2% |
| city: | 20.8% |
Percentage of people that speak English not well or not at all:
| Berkeley Hills: | 0.0% |
| Denver: | 3.9% |
Percentage of people born in this state:
Percentage of people born in another U.S. state:
Percentage of native residents but born outside the U.S.:
Percentage of foreign born residents:
| Here: | 43.5% |
| Denver: | 38.5% |
Percentage of people born in another U.S. state:
| Berkeley Hills: | 42.4% |
| Denver: | 46.1% |
Percentage of native residents but born outside the U.S.:
| Here: | 3.3% |
| city: | 1.7% |
Percentage of foreign born residents:
| Here: | 10.8% |
| Denver: | 13.8% |
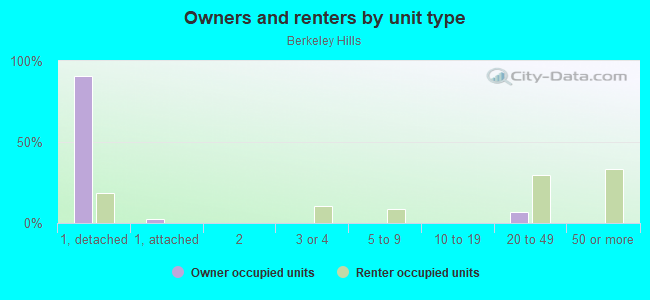
Owner-occupied
Renter-occupied

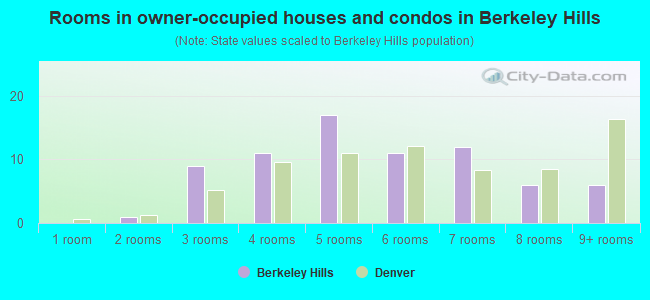
- Rooms in owner-occupied houses and condos in Berkeley Hills
- 01 room
- 12 rooms
- 93 rooms
- 114 rooms
- 175 rooms
- 116 rooms
- 127 rooms
- 68 rooms
- 69+ rooms
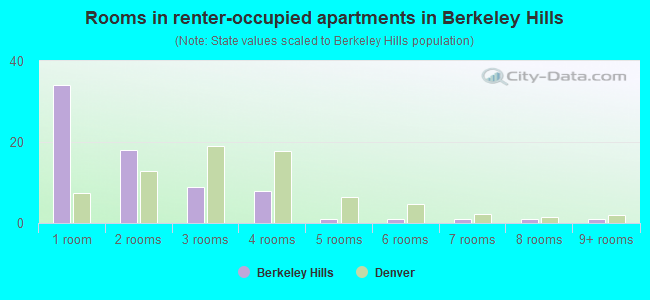
- Rooms in renter-occupied apartments in Berkeley Hills
- 341 room
- 182 rooms
- 93 rooms
- 84 rooms
- 15 rooms
- 16 rooms
- 17 rooms
- 18 rooms
- 19+ rooms
Owner-occupied
Renter-occupied
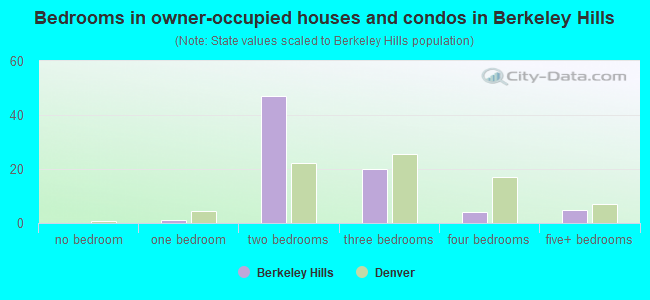
- Bedrooms in owner-occupied houses and condos in Berkeley Hills
- 0no bedroom
- 11 bedroom
- 472 bedrooms
- 203 bedrooms
- 44 bedrooms
- 55+ bedrooms
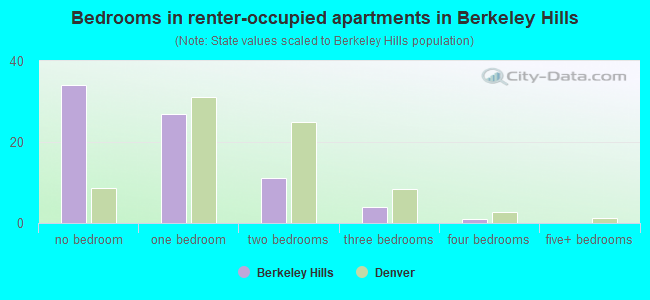
- Bedrooms in renter-occupied apartments in Berkeley Hills
- 34no bedroom
- 271 bedroom
- 112 bedrooms
- 43 bedrooms
- 14 bedrooms
- 05+ bedrooms
Average number of cars or other vehicles available in houses/condos:
Average number of cars or other vehicles available in apartments:
| This neighborhood: | 1.8 |
| Denver: | 1.9 |
Average number of cars or other vehicles available in apartments:
| Here: | 1.1 |
| city: | 1.3 |
Percentage of units with a mortgage:
| Berkeley Hills: | 71.6% |
| Denver: | 75.6% |
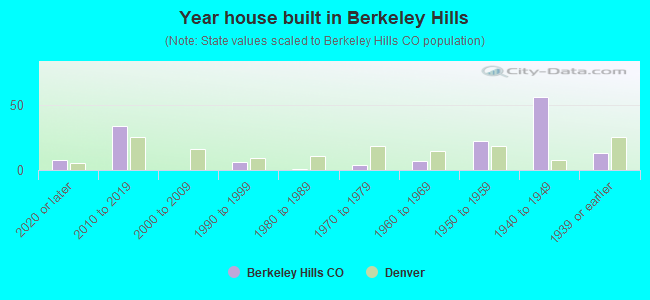
- Year house built in Berkeley Hills
- 82020 or later
- 342010 to 2019
- 02000 to 2009
- 61990 to 1999
- 11980 to 1989
- 41970 to 1979
- 71960 to 1969
- 221950 to 1959
- 561940 to 1949
- 131939 or earlier
City-data.com crime index for city in 2020 (higher means more crime):
| City: | 519.0 |
| U.S. average: | 219.5 |
Travel time to work (commute)
![Travel time to work (commute)]()
- 15 to 9 minutes
- 2010 to 14 minutes
- 2015 to 19 minutes
- 2020 to 24 minutes
- 625 to 29 minutes
- 2830 to 34 minutes
- 135 to 39 minutes
- 840 to 44 minutes
- 1045 to 59 minutes
- 460 to 89 minutes

Means of transportation to work
![Means of transportation to work]()
- 64.3%70Drove a car alone
- 14.7%16Carpooled
- 1.8%2Bus
- 0.9%1Bicycle
- 15.6%17Worked at home

Time leaving home to go to work
![Time leaving home to go to work]()
- 312:00 a.m. to 4:59 a.m.
- 85:00 a.m. to 5:29 a.m.
- 35:30 a.m. to 5:59 a.m.
- 136:00 a.m. to 6:29 a.m.
- 86:30 a.m. to 6:59 a.m.
- 137:00 a.m. to 7:29 a.m.
- 137:30 a.m. to 7:59 a.m.
- 98:00 a.m. to 8:29 a.m.
- 168:30 a.m. to 8:59 a.m.
- 49:00 a.m. to 9:59 a.m.
- 210:00 a.m. to 10:59 a.m.
- 111:00 a.m. to 11:59 a.m.
- 1212:00 p.m. to 3:59 p.m.
- 124:00 p.m. to 11:59 p.m.

Occupations of males:
- Percentage of males in management occupations (except farmers):
Here: 7.2% city: 15.4%
- Percentage of males in business and financial operations occupations:
Here: 10.4% city: 8.3%
- Percentage of males in computer and mathematical occupations:
Here: 5.2% city: 7.4%
- Percentage of males in architecture and engineering occupations:
Here: 2.3% city: 4.5%
- Percentage of males in life, physical, and social science occupations:
Here: 2.6% city: 1.4%
- Percentage of males in community and social services occupations:
Here: 1.1% city: 0.9%
- Percentage of males in education, training, and library occupations:
Here: 2.9% city: 3.1%
- Percentage of males in arts, design, entertainment, sports, and media occupations:
Here: 10.1% city: 3.1%
- Percentage of males in service occupations:
Here: 21.5% city: 11.9%
- Percentage of males in sales and office occupations:
Here: 10.4% city: 15.4%
- Percentage of males in farming, fishing, and forestry occupations:
Here: 1.6% city: 0.3%
- Percentage of males in construction, extraction, and maintenance occupations:
Here: 24.4% city: 8.0%
- Percentage of males in production occupations:
Here: 3.6% city: 3.2%
- Percentage of males in transportation occupations:
Here: 2.2% city: 4.2%
- Percentage of males in material moving occupations:
Here: 14.5% city: 3.5%
Occupations of females:
- Percentage of females in management occupations (except farmers):
Here: 23.5% city: 14.0%
- Percentage of females in business and financial operations occupations:
Here: 1.5% city: 10.0%
- Percentage of females in computer and mathematical occupations:
Here: 1.3% city: 2.9%
- Percentage of females in architecture and engineering occupations:
Here: 4.0% city: 1.5%
- Percentage of females in community and social services occupations:
Here: 6.7% city: 3.0%
- Percentage of females in education, training, and library occupations:
Here: 7.3% city: 7.9%
- Percentage of females in healthcare practitioners and technical occupations:
Here: 10.7% city: 10.2%
- Percentage of females in service occupations:
Here: 27.8% city: 16.2%
- Percentage of females in sales and office occupations:
Here: 14.7% city: 21.4%
- Percentage of females in production occupations:
Here: 5.2% city: 1.7%
- Percentage of females in material moving occupations:
Here: 2.4% city: 1.4%
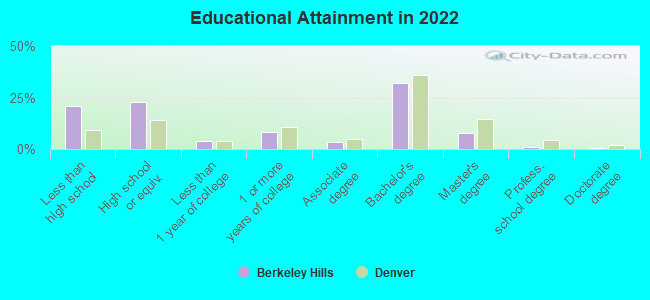
Education in this neighborhood (subdivision or community):
- Percentage of people 3 years and older in K-12 schools:
Berkeley Hills: 4.6% Denver: 12.7%
- Percentage of people 3 years and older in undergraduate colleges:
Berkeley Hills: 2.9% Denver: 4.1%
- Percentage of people 3 years and older in grad. or professional schools:
Berkeley Hills: 0.8% Denver: 2.2%
- Percentage of students K-12 enrolled in private schools:
Berkeley Hills: 0.0% Denver: 11.0%
Percentage of population below poverty level:
| Berkeley Hills: | 10.3% |
| Denver: | 11.8% |
Median year owner moved in (as recorded in 2022):
Median year renter moved in (as recorded in 2022):
| Berkeley Hills: | 2012 |
| Denver: | 2014 |
Median year renter moved in (as recorded in 2022):
| Berkeley Hills: | 2017 |
| Denver: | 2021 |
Percentage of married-couple families with both working:
| Berkeley Hills: | 135.7% |
| Denver: | 74.1% |
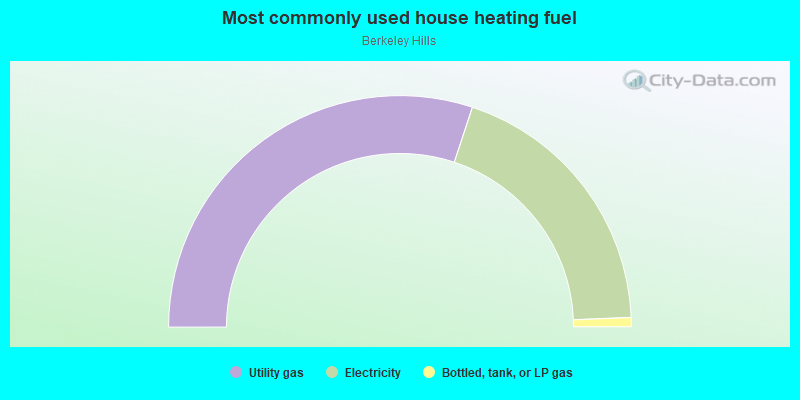
- 60.2%Utility gas
- 38.6%Electricity
- 1.3%Bottled, tank, or LP gas
Roads and streets:
Columbine Rd
Length: 0.05 miles
Directions: N-S, SW-NE
Directions: N-S, SW-NE