Belmont Heights neighborhood in Long Beach, California (CA), 90803, 90814 detailed profile
Settings
X


Business Search - 14 Million verified businesses
Area: 0.934 square miles
Population: 13,118
Population density:
| Belmont Heights: | 14,046 people per square mile |
| Long Beach: | 8,948 people per square mile |

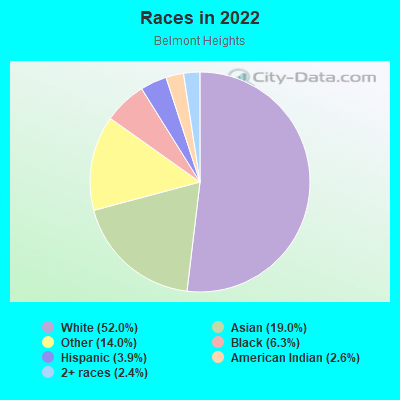
- 7,99656.8%White
- 3,46424.6%Hispanic or Latino
- 7575.4%Two or more races
- 6584.7%Asian
- 6384.5%Black
- 3692.6%American Indian
- 2071.5%Some other race
Median household income in 2022:
| Belmont Heights: | $107,062 |
| Long Beach: | $80,493 |
Distribution of median household income
![Distribution of median household income]()
- 586Less than $10,000
- 963$10,000 to $19,999
- 568$20,000 to $29,999
- 443$30,000 to $39,999
- 526$40,000 to $49,999
- 555$50,000 to $59,999
- 824$60,000 to $74,999
- 976$75,000 to $99,999
- 761$100,000 to $124,999
- 600$125,000 to $149,999
- 887$150,000 to $199,999
- 1,003$200,000 or more

Distribution of owner-occupied house/condo value
![Distribution of owner-occupied house/condo value]()
- 66Less than $50,000
- 148$100,000 to $149,999
- 138$150,000 to $199,999
- 207$300,000 to $399,999
- 359$400,000 to $499,999
- 450$500,000 to $749,999
- 398$750,000 to $999,999
- 1,290$1,000,000 or more

Distribution of rent paid by renters
![Distribution of rent paid by renters]()
- 510$200 to $299
- 128$500 to $599
- 305$700 to $799
- 370$800 to $899
- 219$900 to $999
- 616$1,000 to $1,249
- 744$1,250 to $1,499
- 1,545$1,500 to $1,999
- 1,927$2,000 or more

Median rent in 2022:
| Belmont Heights: | $1,797 |
| Long Beach: | $1,643 |
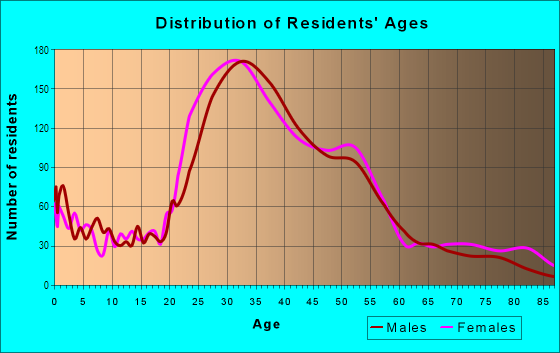
| Males: | 6,472 |
| Females: | 6,645 |
Males:
| This neighborhood: | 39.0 years |
| Whole city: | 35.5 years |
| This neighborhood: | 41.0 years |
| Whole city: | 37.7 years |
Average household size:
| Belmont Heights: | 3.9 people |
| Long Beach: | 2.6 people |
Percentage of family households:
| Belmont Heights: | 33.8% |
| Long Beach: | 43.1% |
| Here: | 34.7% |
| Long Beach: | 35.6% |
Percentage of married-couple families with children (among all households):
| Belmont Heights: | 40.9% |
| Long Beach: | 21.4% |
Percentage of single-mother households (among all households):
| Belmont Heights: | 11.8% |
| Long Beach: | 12.6% |
Percentage of never married males 15 years old and over:
Percentage of never married females 15 years old and over:
| Belmont Heights: | 24.0% |
| Long Beach: | 24.6% |
Percentage of never married females 15 years old and over:
| Belmont Heights: | 23.7% |
| city: | 23.9% |
Percentage of people that speak English not well or not at all:
| Belmont Heights: | 0.8% |
| Long Beach: | 7.4% |
Percentage of people born in this state:
Percentage of people born in another U.S. state:
Percentage of native residents but born outside the U.S.:
Percentage of foreign born residents:
| Here: | 60.5% |
| Long Beach: | 62.4% |
Percentage of people born in another U.S. state:
| Belmont Heights: | 29.5% |
| Long Beach: | 12.5% |
Percentage of native residents but born outside the U.S.:
| Here: | 2.4% |
| city: | 1.4% |
Percentage of foreign born residents:
| Here: | 7.7% |
| Long Beach: | 23.7% |
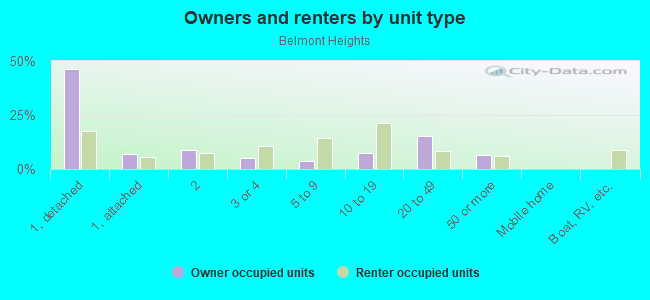
Owner-occupied
Renter-occupied

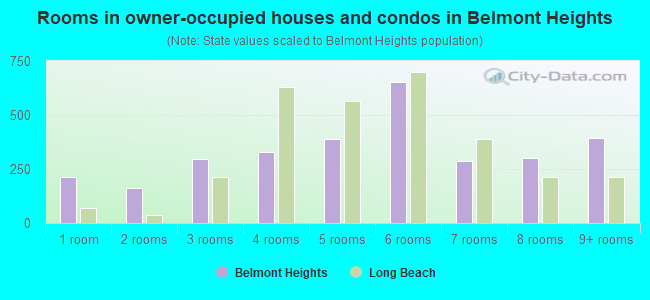
- Rooms in owner-occupied houses and condos in Belmont Heights
- 2141 room
- 1602 rooms
- 2983 rooms
- 3294 rooms
- 3875 rooms
- 6556 rooms
- 2887 rooms
- 3008 rooms
- 3949+ rooms
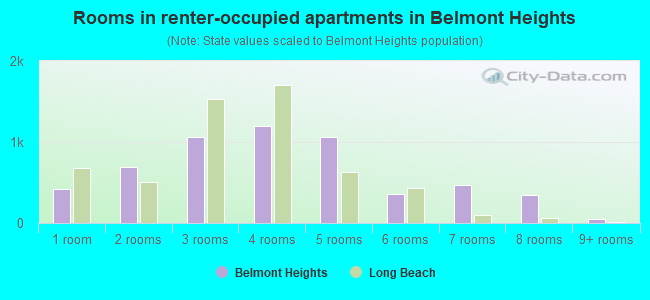
- Rooms in renter-occupied apartments in Belmont Heights
- 4221 room
- 6952 rooms
- 1,0643 rooms
- 1,1994 rooms
- 1,0605 rooms
- 3616 rooms
- 4637 rooms
- 3508 rooms
- 449+ rooms
Owner-occupied
Renter-occupied
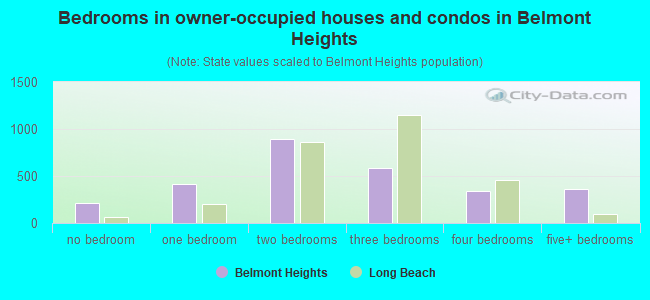
- Bedrooms in owner-occupied houses and condos in Belmont Heights
- 214no bedroom
- 4151 bedroom
- 8972 bedrooms
- 5863 bedrooms
- 3454 bedrooms
- 3615+ bedrooms
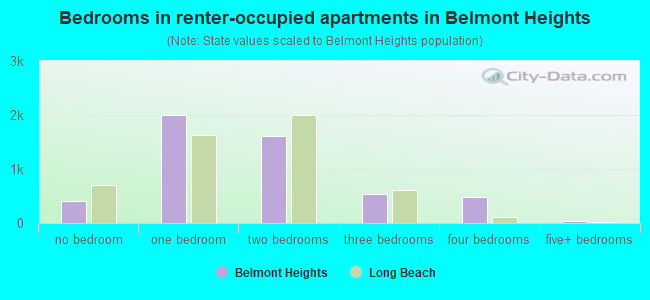
- Bedrooms in renter-occupied apartments in Belmont Heights
- 413no bedroom
- 2,0041 bedroom
- 1,6042 bedrooms
- 5403 bedrooms
- 4904 bedrooms
- 395+ bedrooms
Average number of cars or other vehicles available in houses/condos:
Average number of cars or other vehicles available in apartments:
| This neighborhood: | 1.8 |
| Long Beach: | 2.1 |
Average number of cars or other vehicles available in apartments:
| Here: | 1.4 |
| city: | 1.4 |
Percentage of units with a mortgage:
| Belmont Heights: | 70.0% |
| Long Beach: | 70.2% |
Housing prices:
- Average estimated value of detached houses in 2022 (34.6% of all units):
Belmont Heights: $1,274,500 Long Beach: $840,606
- Average estimated '22 value of housing units in 5-or-more-unit structures (8.4% of all units):
Belmont Heights: $376,985 Long Beach: $496,465
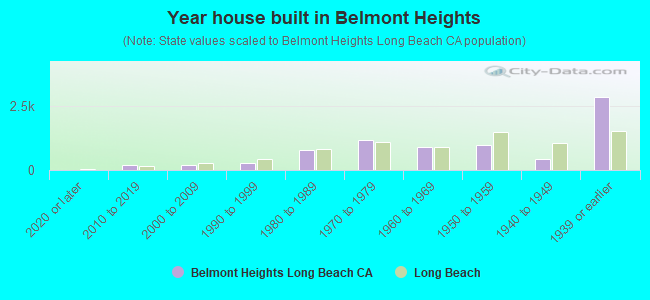
- Year house built in Belmont Heights
- 02020 or later
- 1892010 to 2019
- 2062000 to 2009
- 2841990 to 1999
- 7831980 to 1989
- 1,1841970 to 1979
- 8761960 to 1969
- 9591950 to 1959
- 4281940 to 1949
- 2,8291939 or earlier
City-data.com crime index for city in 2020 (higher means more crime):
| City: | 312.7 |
| U.S. average: | 219.5 |
Travel time to work (commute)
![Travel time to work (commute)]()
- 178Less than 5 minutes
- 5625 to 9 minutes
- 51910 to 14 minutes
- 1,12715 to 19 minutes
- 1,20320 to 24 minutes
- 28825 to 29 minutes
- 83830 to 34 minutes
- 29735 to 39 minutes
- 28040 to 44 minutes
- 67845 to 59 minutes
- 95460 to 89 minutes
- 20190 or more minutes

Means of transportation to work
![Means of transportation to work]()
- 67.9%5,789Drove a car alone
- 6.0%514Carpooled
- 3.3%281Bus
- 0.2%13Subway or elevated rail
- 2.6%225Taxi
- 4.9%415Motorcycle
- 3.0%259Bicycle
- 5.4%460Walked
- 1.6%140Other means
- 19.4%1,655Worked at home

Time leaving home to go to work
![Time leaving home to go to work]()
- 40912:00 a.m. to 4:59 a.m.
- 845:00 a.m. to 5:29 a.m.
- 3205:30 a.m. to 5:59 a.m.
- 6186:00 a.m. to 6:29 a.m.
- 8016:30 a.m. to 6:59 a.m.
- 1,1187:00 a.m. to 7:29 a.m.
- 5797:30 a.m. to 7:59 a.m.
- 9398:00 a.m. to 8:29 a.m.
- 7558:30 a.m. to 8:59 a.m.
- 5069:00 a.m. to 9:59 a.m.
- 28110:00 a.m. to 10:59 a.m.
- 2111:00 a.m. to 11:59 a.m.
- 28912:00 p.m. to 3:59 p.m.
- 3694:00 p.m. to 11:59 p.m.

Occupations of males:
- Percentage of males in management occupations (except farmers):
Here: 18.1% city: 10.3%
- Percentage of males in business and financial operations occupations:
Here: 12.1% city: 5.1%
- Percentage of males in computer and mathematical occupations:
Here: 2.5% city: 4.1%
- Percentage of males in architecture and engineering occupations:
Here: 2.9% city: 3.2%
- Percentage of males in life, physical, and social science occupations:
Here: 1.6% city: 1.0%
- Percentage of males in education, training, and library occupations:
Here: 5.2% city: 3.8%
- Percentage of males in arts, design, entertainment, sports, and media occupations:
Here: 8.5% city: 4.0%
- Percentage of males in healthcare practitioners and technical occupations:
Here: 2.8% city: 3.0%
- Percentage of males in service occupations:
Here: 11.8% city: 16.3%
- Percentage of males in sales and office occupations:
Here: 13.2% city: 15.7%
- Percentage of males in construction, extraction, and maintenance occupations:
Here: 5.6% city: 7.8%
- Percentage of males in production occupations:
Here: 7.4% city: 6.4%
- Percentage of males in transportation occupations:
Here: 2.8% city: 6.8%
- Percentage of males in material moving occupations:
Here: 1.2% city: 5.9%
Occupations of females:
- Percentage of females in management occupations (except farmers):
Here: 12.4% city: 9.5%
- Percentage of females in business and financial operations occupations:
Here: 9.4% city: 6.5%
- Percentage of females in computer and mathematical occupations:
Here: 5.2% city: 1.7%
- Percentage of females in life, physical, and social science occupations:
Here: 1.4% city: 1.0%
- Percentage of females in community and social services occupations:
Here: 5.5% city: 3.3%
- Percentage of females in legal occupations:
Here: 1.5% city: 1.3%
- Percentage of females in education, training, and library occupations:
Here: 10.6% city: 8.3%
- Percentage of females in arts, design, entertainment, sports, and media occupations:
Here: 4.1% city: 3.2%
- Percentage of females in healthcare practitioners and technical occupations:
Here: 7.5% city: 7.4%
- Percentage of females in service occupations:
Here: 13.8% city: 21.6%
- Percentage of females in sales and office occupations:
Here: 25.7% city: 27.8%
- Percentage of females in material moving occupations:
Here: 2.0% city: 2.5%
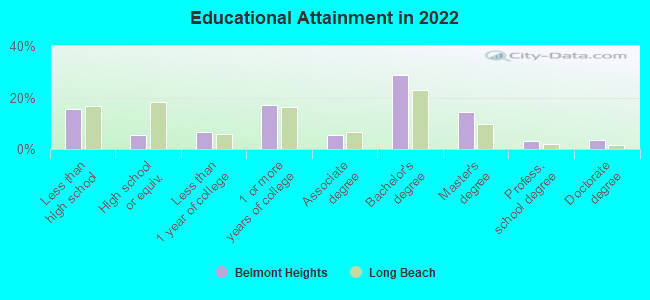
Education in this neighborhood (subdivision or community):
- Percentage of people 3 years and older in K-12 schools:
Belmont Heights: 14.4% Long Beach: 15.8%
- Percentage of people 3 years and older in undergraduate colleges:
Belmont Heights: 10.2% Long Beach: 7.2%
- Percentage of people 3 years and older in grad. or professional schools:
Belmont Heights: 4.1% Long Beach: 1.4%
- Percentage of students K-12 enrolled in private schools:
Belmont Heights: 4.9% Long Beach: 4.5%
Percentage of population below poverty level:
| Belmont Heights: | 11.4% |
| Long Beach: | 13.8% |
Median year owner moved in (as recorded in 2022):
Median year renter moved in (as recorded in 2022):
| Belmont Heights: | 2010 |
| Long Beach: | 2007 |
Median year renter moved in (as recorded in 2022):
| Belmont Heights: | 2016 |
| Long Beach: | 2018 |
Percentage of married-couple families with both working:
| Belmont Heights: | 109.8% |
| Long Beach: | 68.2% |
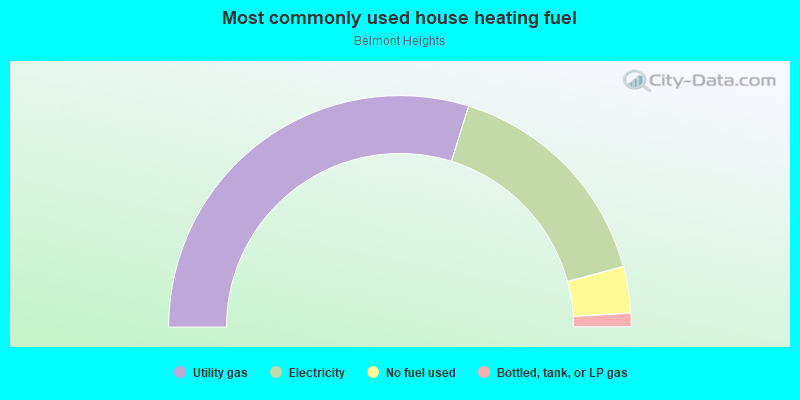
- 59.6%Utility gas
- 32.0%Electricity
- 6.5%No fuel used
- 1.9%Bottled, tank, or LP gas
Roads and streets:
E 3rd St
Length: 1.27 miles
Direction: E-W
Address range: 3500 to 5199
Direction: E-W
Address range: 3500 to 5199
E Broadway
Length: 1.27 miles
Direction: E-W
Address range: 3500 to 5099
Direction: E-W
Address range: 3500 to 5099
E Vista St
Length: 1.27 miles
Direction: E-W
Address range: 3500 to 5199
Direction: E-W
Address range: 3500 to 5199
E Colorado St
Length: 1.05 miles
Direction: E-W
Address range: 3500 to 4899
Direction: E-W
Address range: 3500 to 4899
N Termino Ave
Length: 0.93 miles
Direction: N-S
Address range: 100 to 649
Direction: N-S
Address range: 100 to 649
E 4th St
Length: 0.90 miles
Direction: E-W
Address range: 3500 to 4699
Direction: E-W
Address range: 3500 to 4699
N Grand Ave
Length: 0.89 miles
Direction: N-S
Address range: 1 to 599
Direction: N-S
Address range: 1 to 599
E 6th St
Length: 0.86 miles
Direction: E-W
Address range: 3500 to 4699
Direction: E-W
Address range: 3500 to 4699
N Roswell Ave
Length: 0.85 miles
Direction: N-S
Address range: 200 to 688
Direction: N-S
Address range: 200 to 688
Ximeno Ave
Length: 0.83 miles
Direction: N-S
Address range: 200 to 679
Direction: N-S
Address range: 200 to 679
N Loma Ave
Length: 0.80 miles
Directions: N-S, SW-NE
Address range: 100 to 599
Directions: N-S, SW-NE
Address range: 100 to 599
E 2nd St
Length: 0.79 miles
Direction: E-W
Address range: 3400 to 4499
Direction: E-W
Address range: 3400 to 4499
Miramar Ave
Length: 0.72 miles
Direction: N-S
Address range: 100 to 399
Direction: N-S
Address range: 100 to 399
E 5th St
Length: 0.71 miles
Direction: E-W
Address range: 3600 to 4599
Direction: E-W
Address range: 3600 to 4599
N Newport Ave
Length: 0.71 miles
Direction: N-S
Address range: 200 to 599
Direction: N-S
Address range: 200 to 599
Roycroft Ave
Length: 0.63 miles
Directions: N-S, SE-NW
Address range: 212 to 599
Directions: N-S, SE-NW
Address range: 212 to 599
N Euclid Ave
Length: 0.61 miles
Directions: N-S, SE-NW
Address range: 5 to 399
Directions: N-S, SE-NW
Address range: 5 to 399
E Vermont St
Length: 0.56 miles
Direction: E-W
Address range: 3600 to 4599
Direction: E-W
Address range: 3600 to 4599
E Shaw St
Length: 0.52 miles
Direction: E-W
Address range: 4100 to 4799
Direction: E-W
Address range: 4100 to 4799
Prospect Ave
Length: 0.52 miles
Direction: N-S
Address range: 201 to 399
Direction: N-S
Address range: 201 to 399
E 1st St
Length: 0.45 miles
Direction: E-W
Address range: 3400 to 3999
Direction: E-W
Address range: 3400 to 3999
Quincy Ave
Length: 0.44 miles
Direction: N-S
Address range: 212 to 399
Direction: N-S
Address range: 212 to 399
Park Ave
Length: 0.44 miles
Direction: N-S
Address range: 229 to 351
Direction: N-S
Address range: 229 to 351
Bennett Ave
Length: 0.39 miles
Direction: N-S
Address range: 200 to 299
Direction: N-S
Address range: 200 to 299
Belmont Ave
Length: 0.39 miles
Direction: N-S
Address range: 200 to 299
Direction: N-S
Address range: 200 to 299
Saint Joseph Ave
Length: 0.37 miles
Direction: N-S
Address range: 247 to 399
Direction: N-S
Address range: 247 to 399
E Massachusetts St
Length: 0.34 miles
Direction: E-W
Address range: 3900 to 4399
Direction: E-W
Address range: 3900 to 4399
N Granada Ave
Length: 0.33 miles
Direction: N-S
Address range: 248 to 399
Direction: N-S
Address range: 248 to 399
Argonne Ave
Length: 0.28 miles
Direction: N-S
Address range: 241 to 299
Direction: N-S
Address range: 241 to 299
E Theresa St
Length: 0.26 miles
Direction: E-W
Address range: 4000 to 4399
Direction: E-W
Address range: 4000 to 4399
Nieto Ave
Length: 0.25 miles
Direction: N-S
Address range: 253 to 299
Direction: N-S
Address range: 253 to 299
Tremont Ave
Length: 0.18 miles
Direction: N-S
Address range: 300 to 599
Direction: N-S
Address range: 300 to 599
E Elko St
Length: 0.15 miles
Direction: E-W
Address range: 4200 to 4399
Direction: E-W
Address range: 4200 to 4399
E Dodge Way
Length: 0.12 miles
Direction: E-W
Address range: 3600 to 3699
Direction: E-W
Address range: 3600 to 3699
E Barker Way
Length: 0.12 miles
Directions: E-W, SW-NE
Address range: 4400 to 4699
Directions: E-W, SW-NE
Address range: 4400 to 4699
Appian Way
Length: 0.09 miles
Direction: SE-NW
Address range: 5030 to 5099
Direction: SE-NW
Address range: 5030 to 5099
E Livingston Dr
Length: 0.06 miles
Directions: E-W, SE-NW
Address range: 3701 to 3799
Directions: E-W, SE-NW
Address range: 3701 to 3799
Lucille Ave
Length: 0.06 miles
Direction: N-S
Address range: 300 to 399
Direction: N-S
Address range: 300 to 399
Theresa St
Length: 0.05 miles
Direction: SE-NW
Address range: 4368 to 4449
Direction: SE-NW
Address range: 4368 to 4449
Granada Ave
Length: 0.02 miles
Direction: N-S
Address range: 338 to 349
Direction: N-S
Address range: 338 to 349
E Ocean Blvd
Length: 0.02 miles
Direction: E-W
Address range: 3806 to 3835
Direction: E-W
Address range: 3806 to 3835