Belmont neighborhood in Dallas, Texas (TX), 75206 detailed profile
Settings
X


Business Search - 14 Million verified businesses
Area: 0.357 square miles
Population: 2,580
Population density:
| Belmont: | 7,218 people per square mile |
| Dallas: | 3,794 people per square mile |

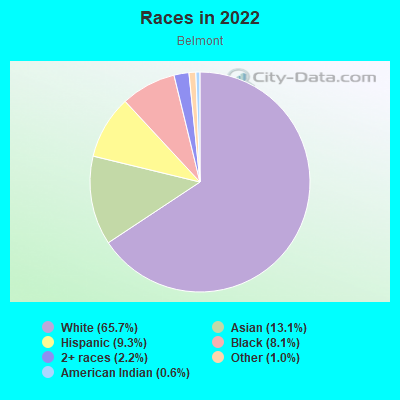
- 2,01565.7%White
- 40213.1%Asian
- 2849.3%Hispanic or Latino
- 2488.1%Black
- 662.2%Two or more races
- 321.0%Some other race
- 190.6%American Indian
Median household income in 2022:
| Belmont: | $149,094 |
| Dallas: | $65,400 |
Distribution of median household income
![Distribution of median household income]()
- 107Less than $10,000
- 100$10,000 to $19,999
- 222$20,000 to $29,999
- 79$30,000 to $39,999
- 214$40,000 to $49,999
- 80$50,000 to $59,999
- 203$60,000 to $74,999
- 177$75,000 to $99,999
- 79$100,000 to $124,999
- 89$125,000 to $149,999
- 187$150,000 to $199,999
- 429$200,000 or more

Distribution of owner-occupied house/condo value
![Distribution of owner-occupied house/condo value]()
- 33$100,000 to $149,999
- 49$150,000 to $199,999
- 42$200,000 to $249,999
- 36$250,000 to $299,999
- 54$300,000 to $399,999
- 257$400,000 to $499,999
- 187$500,000 to $749,999
- 159$750,000 to $999,999
- 566$1,000,000 or more

Distribution of rent paid by renters
![Distribution of rent paid by renters]()
- 25$400 to $499
- 12$700 to $799
- 33$800 to $899
- 37$900 to $999
- 248$1,000 to $1,249
- 270$1,250 to $1,499
- 256$1,500 to $1,999
- 227$2,000 or more

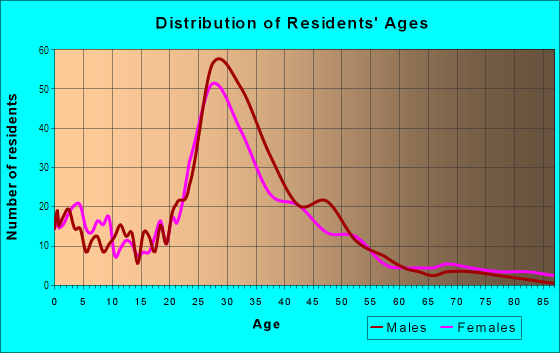
| Males: | 1,410 |
| Females: | 1,169 |
Males:
| This neighborhood: | 32.4 years |
| Whole city: | 32.8 years |
| This neighborhood: | 34.3 years |
| Whole city: | 33.4 years |
Average household size:
| Belmont: | 2.1 people |
| Dallas: | 2.4 people |
Percentage of family households:
| Belmont: | 39.8% |
| Dallas: | 42.6% |
| Here: | 31.6% |
| Dallas: | 33.8% |
Percentage of married-couple families with children (among all households):
| Belmont: | 34.4% |
| Dallas: | 24.8% |
Percentage of single-mother households (among all households):
| Belmont: | 16.8% |
| Dallas: | 13.3% |
Percentage of never married males 15 years old and over:
Percentage of never married females 15 years old and over:
| Belmont: | 33.0% |
| Dallas: | 22.1% |
Percentage of never married females 15 years old and over:
| Belmont: | 15.0% |
| city: | 21.8% |
Percentage of people that speak English not well or not at all:
| Belmont: | 0.4% |
| Dallas: | 10.7% |
Percentage of people born in this state:
Percentage of people born in another U.S. state:
Percentage of native residents but born outside the U.S.:
Percentage of foreign born residents:
| Here: | 51.6% |
| Dallas: | 52.8% |
Percentage of people born in another U.S. state:
| Belmont: | 39.0% |
| Dallas: | 22.0% |
Percentage of native residents but born outside the U.S.:
| Here: | 0.8% |
| city: | 1.3% |
Percentage of foreign born residents:
| Here: | 8.6% |
| Dallas: | 23.9% |
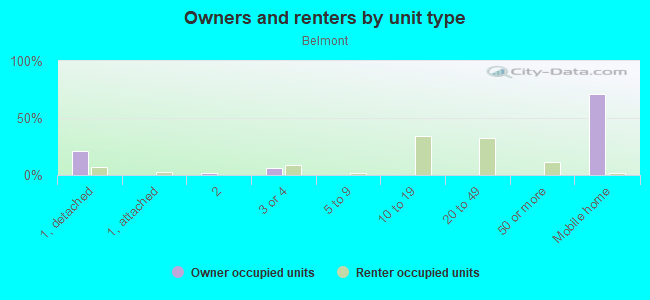
Owner-occupied
Renter-occupied

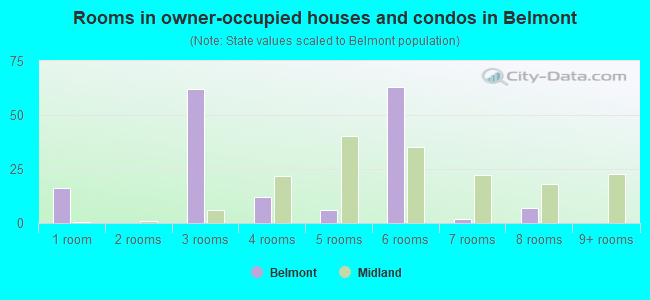
- Rooms in owner-occupied houses and condos in Belmont
- 441 room
- 02 rooms
- 1683 rooms
- 1544 rooms
- 815 rooms
- 1396 rooms
- 677 rooms
- 1248 rooms
- 1199+ rooms
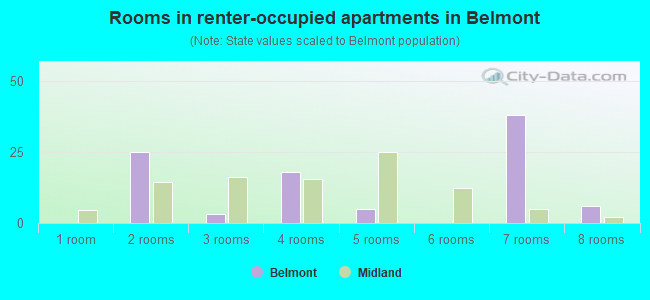
- Rooms in renter-occupied apartments in Belmont
- 841 room
- 1212 rooms
- 1193 rooms
- 2024 rooms
- 735 rooms
- 1396 rooms
- 687 rooms
- 748 rooms
- 279+ rooms
Owner-occupied
Renter-occupied
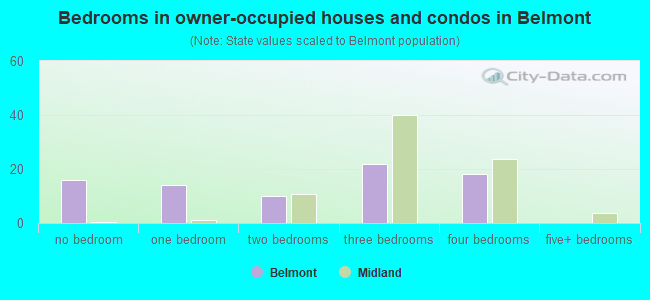
- Bedrooms in owner-occupied houses and condos in Belmont
- 44no bedroom
- 701 bedroom
- 2842 bedrooms
- 2073 bedrooms
- 1864 bedrooms
- 465+ bedrooms
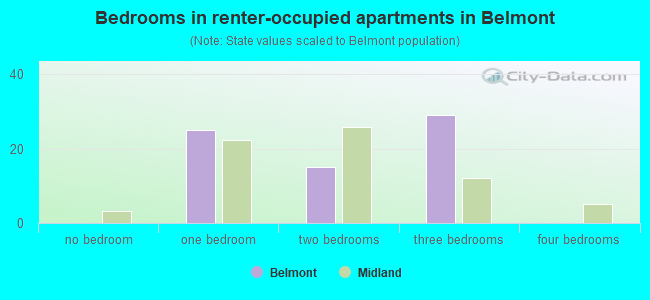
- Bedrooms in renter-occupied apartments in Belmont
- 84no bedroom
- 3101 bedroom
- 3182 bedrooms
- 1293 bedrooms
- 324 bedrooms
- 345+ bedrooms
Average number of cars or other vehicles available in houses/condos:
Average number of cars or other vehicles available in apartments:
| This neighborhood: | 1.7 |
| Dallas: | 2.1 |
Average number of cars or other vehicles available in apartments:
| Here: | 1.3 |
| city: | 1.3 |
Percentage of units with a mortgage:
| Belmont: | 86.0% |
| Dallas: | 53.9% |
Average estimated value of detached houses in 2022 (44.6% of all units):
| Belmont: | $605,708 |
| Dallas: | $423,859 |
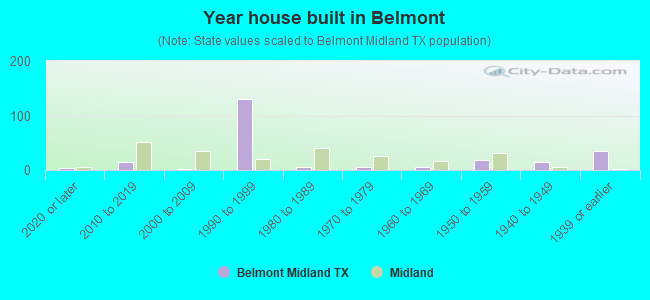
- Year house built in Belmont
- 192020 or later
- 3352010 to 2019
- 1832000 to 2009
- 931990 to 1999
- 2471980 to 1989
- 901970 to 1979
- 2471960 to 1969
- 561950 to 1959
- 821940 to 1949
- 6031939 or earlier
City-data.com crime index for city in 2020 (higher means more crime):
| City: | 439.5 |
| U.S. average: | 219.5 |
Travel time to work (commute)
![Travel time to work (commute)]()
- 23Less than 5 minutes
- 885 to 9 minutes
- 27210 to 14 minutes
- 77515 to 19 minutes
- 29920 to 24 minutes
- 22925 to 29 minutes
- 18330 to 34 minutes
- 8035 to 39 minutes
- 9940 to 44 minutes
- 9545 to 59 minutes
- 7460 to 89 minutes
- 1890 or more minutes

Means of transportation to work
![Means of transportation to work]()
- 59.6%1,181Drove a car alone
- 7.1%140Carpooled
- 4.2%83Bus
- 3.3%66Subway or elevated rail
- 4.3%85Motorcycle
- 1.6%32Bicycle
- 13.5%267Walked
- 1.6%31Other means
- 24.6%487Worked at home

Time leaving home to go to work
![Time leaving home to go to work]()
- 1912:00 a.m. to 4:59 a.m.
- 525:00 a.m. to 5:29 a.m.
- 315:30 a.m. to 5:59 a.m.
- 356:00 a.m. to 6:29 a.m.
- 1206:30 a.m. to 6:59 a.m.
- 4527:00 a.m. to 7:29 a.m.
- 3737:30 a.m. to 7:59 a.m.
- 4728:00 a.m. to 8:29 a.m.
- 2838:30 a.m. to 8:59 a.m.
- 1809:00 a.m. to 9:59 a.m.
- 3710:00 a.m. to 10:59 a.m.
- 5511:00 a.m. to 11:59 a.m.
- 7612:00 p.m. to 3:59 p.m.
- 1544:00 p.m. to 11:59 p.m.

Occupations of males:
- Percentage of males in management occupations (except farmers):
Here: 25.6% city: 10.9%
- Percentage of males in business and financial operations occupations:
Here: 13.6% city: 7.3%
- Percentage of males in computer and mathematical occupations:
Here: 18.1% city: 4.7%
- Percentage of males in architecture and engineering occupations:
Here: 1.6% city: 2.8%
- Percentage of males in life, physical, and social science occupations:
Here: 2.1% city: 0.7%
- Percentage of males in legal occupations:
Here: 3.3% city: 1.8%
- Percentage of males in education, training, and library occupations:
Here: 3.0% city: 2.3%
- Percentage of males in healthcare practitioners and technical occupations:
Here: 1.4% city: 2.7%
- Percentage of males in service occupations:
Here: 13.7% city: 12.3%
- Percentage of males in sales and office occupations:
Here: 12.4% city: 14.9%
- Percentage of males in construction, extraction, and maintenance occupations:
Here: 1.3% city: 15.2%
- Percentage of males in production occupations:
Here: 1.8% city: 5.0%
- Percentage of males in material moving occupations:
Here: 1.4% city: 6.2%
Occupations of females:
- Percentage of females in management occupations (except farmers):
Here: 10.3% city: 9.6%
- Percentage of females in business and financial operations occupations:
Here: 16.7% city: 8.4%
- Percentage of females in computer and mathematical occupations:
Here: 1.1% city: 2.0%
- Percentage of females in architecture and engineering occupations:
Here: 1.3% city: 0.6%
- Percentage of females in community and social services occupations:
Here: 1.8% city: 1.8%
- Percentage of females in legal occupations:
Here: 6.5% city: 1.8%
- Percentage of females in education, training, and library occupations:
Here: 9.9% city: 7.1%
- Percentage of females in arts, design, entertainment, sports, and media occupations:
Here: 3.8% city: 2.9%
- Percentage of females in healthcare practitioners and technical occupations:
Here: 10.8% city: 7.7%
- Percentage of females in service occupations:
Here: 12.4% city: 20.5%
- Percentage of females in sales and office occupations:
Here: 24.2% city: 27.7%
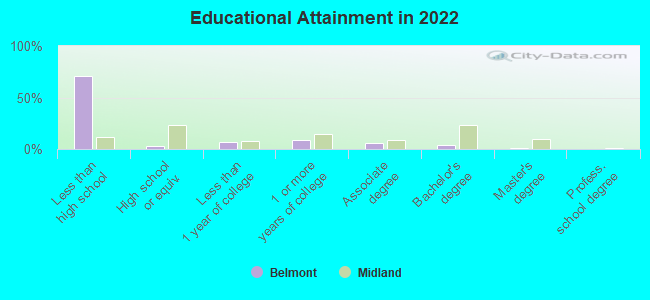
Education in this neighborhood (subdivision or community):
- Percentage of people 3 years and older in K-12 schools:
Belmont: 26.1% Dallas: 17.3%
- Percentage of people 3 years and older in undergraduate colleges:
Belmont: 3.1% Dallas: 4.1%
- Percentage of people 3 years and older in grad. or professional schools:
Belmont: 5.3% Dallas: 1.7%
- Percentage of students K-12 enrolled in private schools:
Belmont: 67.3% Dallas: 10.8%
Percentage of population below poverty level:
| Belmont: | 7.5% |
| Dallas: | 17.8% |
Median year owner moved in (as recorded in 2022):
Median year renter moved in (as recorded in 2022):
| Belmont: | 2013 |
| Dallas: | 2010 |
Median year renter moved in (as recorded in 2022):
| Belmont: | 2018 |
| Dallas: | 2020 |
Percentage of married-couple families with both working:
| Belmont: | 119.7% |
| Dallas: | 58.3% |
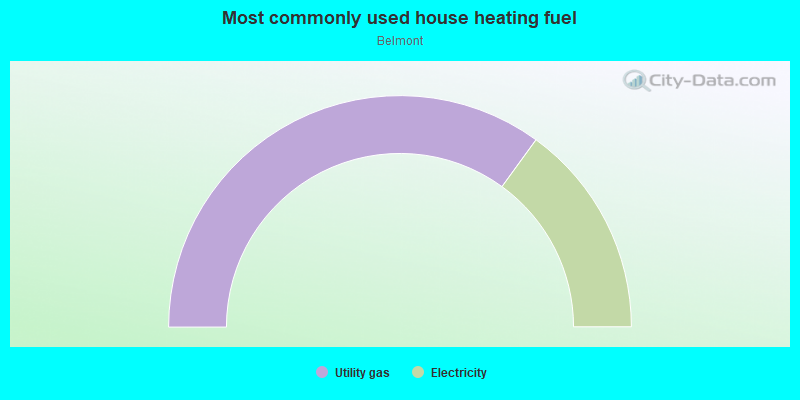
- 52.1%Utility gas
- 41.2%Electricity
- 4.4%Bottled, tank, or LP gas
- 2.4%Wood
Roads and streets:
Greenville Ave
Length: 0.61 miles
Direction: N-S
Address range: 1574 to 2398
Direction: N-S
Address range: 1574 to 2398
Matilda St
Length: 0.60 miles
Directions: N-S, SW-NE
Address range: 1600 to 2399
Directions: N-S, SW-NE
Address range: 1600 to 2399
Belmont Ave
Length: 0.60 miles
Direction: E-W
Address range: 5700 to 6099
Direction: E-W
Address range: 5700 to 6099
Richmond Ave
Length: 0.60 miles
Direction: E-W
Address range: 5700 to 6099
Direction: E-W
Address range: 5700 to 6099
Goliad Ave
Length: 0.60 miles
Direction: E-W
Address range: 5700 to 6099
Direction: E-W
Address range: 5700 to 6099
Prospect Ave
Length: 0.60 miles
Direction: E-W
Address range: 5700 to 6099
Direction: E-W
Address range: 5700 to 6099
Oram St
Length: 0.60 miles
Direction: E-W
Address range: 5700 to 6099
Direction: E-W
Address range: 5700 to 6099
Lewis St
Length: 0.57 miles
Direction: E-W
Address range: 5500 to 6099
Direction: E-W
Address range: 5500 to 6099
Ross Ave
Length: 0.56 miles
Directions: E-W, SE-NW
Address range: 5500 to 6099
Directions: E-W, SE-NW
Address range: 5500 to 6099
Hudson St
Length: 0.48 miles
Directions: E-W, SE-NW, SW-NE
Address range: 5500 to 6199
Directions: E-W, SE-NW, SW-NE
Address range: 5500 to 6199
Skillman St
Length: 0.48 miles
Directions: N-S, SW-NE
Address range: 1700 to 2399
Directions: N-S, SW-NE
Address range: 1700 to 2399
la Vista Dr
Length: 0.39 miles
Direction: E-W
Address range: 5700 to 6099
Direction: E-W
Address range: 5700 to 6099
Delmar Ave
Length: 0.33 miles
Directions: N-S, SE-NW
Address range: 2000 to 2399
Directions: N-S, SE-NW
Address range: 2000 to 2399
Concho St
Length: 0.33 miles
Direction: N-S
Address range: 2000 to 2399
Direction: N-S
Address range: 2000 to 2399
Hope St
Length: 0.31 miles
Direction: N-S
Address range: 1500 to 1999
Direction: N-S
Address range: 1500 to 1999
Hubert St
Length: 0.25 miles
Direction: N-S
Address range: 1600 to 1999
Direction: N-S
Address range: 1600 to 1999
la Vista Ct
Length: 0.23 miles
Direction: E-W
Address range: 5500 to 5899
Direction: E-W
Address range: 5500 to 5899
Mary St
Length: 0.23 miles
Direction: N-S
Address range: 1500 to 1899
Direction: N-S
Address range: 1500 to 1899
Hoskins St
Length: 0.16 miles
Directions: E-W, N-S, SW-NE
Address range: 5800 to 5999
Directions: E-W, N-S, SW-NE
Address range: 5800 to 5999
Live Oak St
Length: 0.16 miles
Direction: SW-NE
Address range: 5700 to 5799
Direction: SW-NE
Address range: 5700 to 5799
Mecca St
Length: 0.12 miles
Direction: N-S
Address range: 1800 to 1999
Direction: N-S
Address range: 1800 to 1999
Stonebriar Ct
Length: 0.08 miles
Direction: N-S
Address range: 1 to 99
Direction: N-S
Address range: 1 to 99