Belmont Addition neighborhood in Dallas, Texas (TX), 75206 detailed profile
Settings
X


Business Search - 14 Million verified businesses
Area: 0.162 square miles
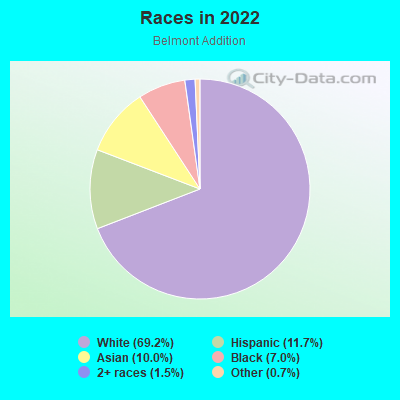
Population: 2,014
Population density:
| Belmont Addition: | 12,439 people per square mile |
| Dallas: | 3,794 people per square mile |

- 1,46469.2%White
- 24711.7%Hispanic or Latino
- 21110.0%Asian
- 1497.0%Black
- 311.5%Two or more races
- 140.7%Some other race
Median household income in 2022:
| Belmont Addition: | $189,934 |
| Dallas: | $65,400 |
Distribution of median household income
![Distribution of median household income]()
- 53Less than $10,000
- 22$10,000 to $19,999
- 62$20,000 to $29,999
- 30$30,000 to $39,999
- 62$40,000 to $49,999
- 36$50,000 to $59,999
- 32$60,000 to $74,999
- 91$75,000 to $99,999
- 37$100,000 to $124,999
- 73$125,000 to $149,999
- 162$150,000 to $199,999
- 462$200,000 or more

Distribution of owner-occupied house/condo value
![Distribution of owner-occupied house/condo value]()
- 5$150,000 to $199,999
- 14$200,000 to $249,999
- 51$300,000 to $399,999
- 327$400,000 to $499,999
- 109$500,000 to $749,999
- 127$750,000 to $999,999
- 317$1,000,000 or more

Distribution of rent paid by renters
![Distribution of rent paid by renters]()
- 5$700 to $799
- 4$800 to $899
- 9$900 to $999
- 64$1,000 to $1,249
- 133$1,250 to $1,499
- 64$1,500 to $1,999
- 159$2,000 or more

Median rent in 2022:
| Belmont Addition: | $1,427 |
| Dallas: | $1,208 |
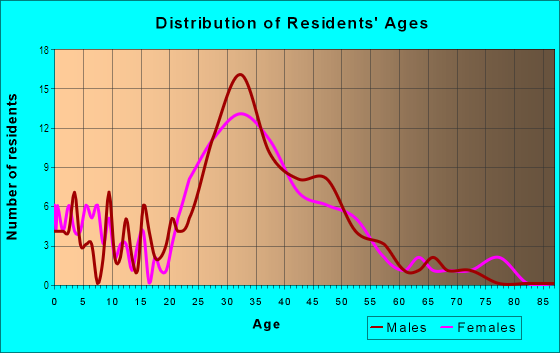
| Males: | 1,245 |
| Females: | 768 |
Males:
| This neighborhood: | 31.9 years |
| Whole city: | 32.8 years |
| This neighborhood: | 31.6 years |
| Whole city: | 33.4 years |
Average household size:
| Belmont Addition: | 2.2 people |
| Dallas: | 2.4 people |
Percentage of family households:
| Belmont Addition: | 49.0% |
| Dallas: | 42.6% |
| Here: | 43.0% |
| Dallas: | 33.8% |
Percentage of married-couple families with children (among all households):
| Belmont Addition: | 39.8% |
| Dallas: | 24.8% |
Percentage of single-mother households (among all households):
| Belmont Addition: | 2.3% |
| Dallas: | 13.3% |
Percentage of never married males 15 years old and over:
Percentage of never married females 15 years old and over:
| Belmont Addition: | 35.6% |
| Dallas: | 22.1% |
Percentage of never married females 15 years old and over:
| Belmont Addition: | 7.7% |
| city: | 21.8% |
Percentage of people that speak English not well or not at all:
| Belmont Addition: | 1.2% |
| Dallas: | 10.7% |
Percentage of people born in this state:
Percentage of people born in another U.S. state:
Percentage of native residents but born outside the U.S.:
Percentage of foreign born residents:
| Here: | 51.7% |
| Dallas: | 52.8% |
Percentage of people born in another U.S. state:
| Belmont Addition: | 38.8% |
| Dallas: | 22.0% |
Percentage of native residents but born outside the U.S.:
| Here: | 0.7% |
| city: | 1.3% |
Percentage of foreign born residents:
| Here: | 8.8% |
| Dallas: | 23.9% |
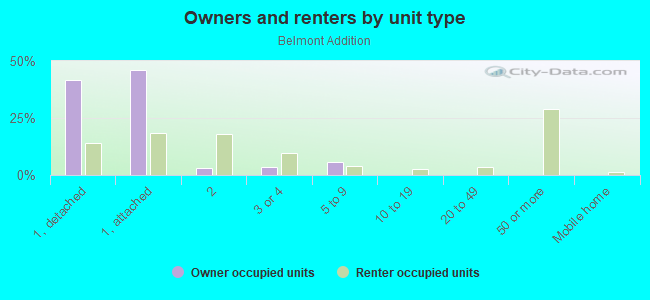
Owner-occupied
Renter-occupied

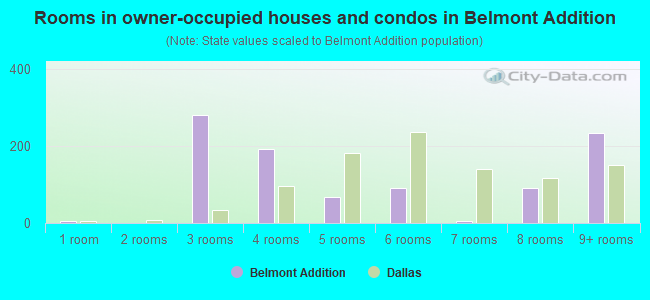
- Rooms in owner-occupied houses and condos in Belmont Addition
- 61 room
- 02 rooms
- 2813 rooms
- 1934 rooms
- 685 rooms
- 916 rooms
- 67 rooms
- 928 rooms
- 2359+ rooms
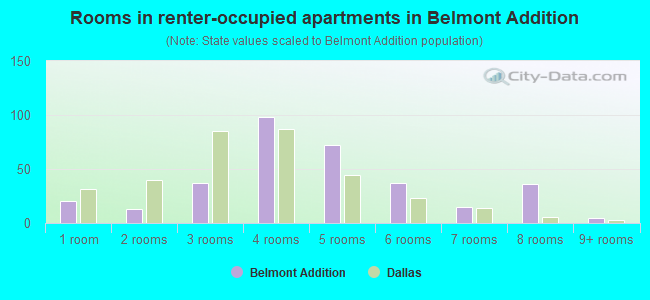
- Rooms in renter-occupied apartments in Belmont Addition
- 201 room
- 132 rooms
- 373 rooms
- 984 rooms
- 725 rooms
- 376 rooms
- 157 rooms
- 368 rooms
- 59+ rooms
Owner-occupied
Renter-occupied
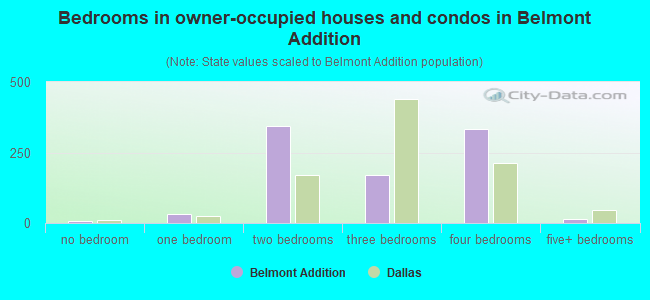
- Bedrooms in owner-occupied houses and condos in Belmont Addition
- 6no bedroom
- 331 bedroom
- 3432 bedrooms
- 1693 bedrooms
- 3324 bedrooms
- 155+ bedrooms
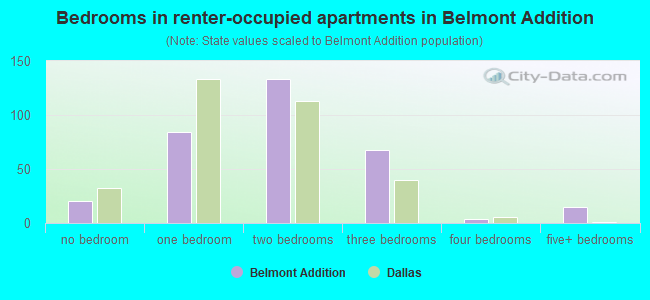
- Bedrooms in renter-occupied apartments in Belmont Addition
- 20no bedroom
- 841 bedroom
- 1332 bedrooms
- 683 bedrooms
- 44 bedrooms
- 155+ bedrooms
Average number of cars or other vehicles available in houses/condos:
Average number of cars or other vehicles available in apartments:
| This neighborhood: | 1.7 |
| Dallas: | 2.1 |
Average number of cars or other vehicles available in apartments:
| Here: | 1.3 |
| city: | 1.3 |
Percentage of units with a mortgage:
| Belmont Addition: | 83.5% |
| Dallas: | 53.9% |
Average estimated value of detached houses in 2022 (68.7% of all units):
| Belmont Addition: | $976,235 |
| Dallas: | $423,859 |
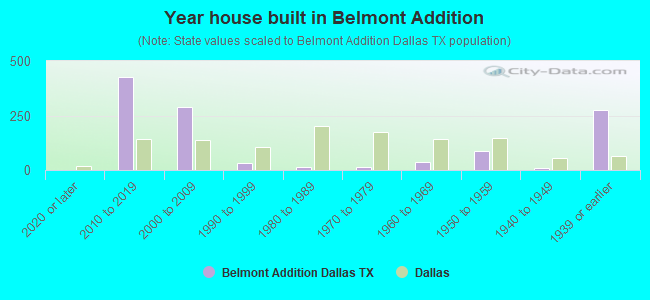
- Year house built in Belmont Addition
- 02020 or later
- 4282010 to 2019
- 2912000 to 2009
- 321990 to 1999
- 131980 to 1989
- 151970 to 1979
- 371960 to 1969
- 851950 to 1959
- 101940 to 1949
- 2771939 or earlier
City-data.com crime index for city in 2020 (higher means more crime):
| City: | 439.5 |
| U.S. average: | 219.5 |
Travel time to work (commute)
![Travel time to work (commute)]()
- 7Less than 5 minutes
- 275 to 9 minutes
- 8910 to 14 minutes
- 28415 to 19 minutes
- 10020 to 24 minutes
- 8125 to 29 minutes
- 6030 to 34 minutes
- 2935 to 39 minutes
- 3540 to 44 minutes
- 5345 to 59 minutes
- 2460 to 89 minutes
- 690 or more minutes

Means of transportation to work
![Means of transportation to work]()
- 56.9%807Drove a car alone
- 6.4%91Carpooled
- 3.0%42Bus
- 2.1%30Subway or elevated rail
- 2.7%38Motorcycle
- 1.5%21Walked
- 1.1%15Other means
- 30.6%434Worked at home

Time leaving home to go to work
![Time leaving home to go to work]()
- 612:00 a.m. to 4:59 a.m.
- 145:00 a.m. to 5:29 a.m.
- 95:30 a.m. to 5:59 a.m.
- 106:00 a.m. to 6:29 a.m.
- 446:30 a.m. to 6:59 a.m.
- 1597:00 a.m. to 7:29 a.m.
- 1277:30 a.m. to 7:59 a.m.
- 1658:00 a.m. to 8:29 a.m.
- 1008:30 a.m. to 8:59 a.m.
- 609:00 a.m. to 9:59 a.m.
- 910:00 a.m. to 10:59 a.m.
- 2011:00 a.m. to 11:59 a.m.
- 2812:00 p.m. to 3:59 p.m.
- 524:00 p.m. to 11:59 p.m.

Occupations of males:
- Percentage of males in management occupations (except farmers):
Here: 36.7% city: 10.9%
- Percentage of males in business and financial operations occupations:
Here: 11.7% city: 7.3%
- Percentage of males in computer and mathematical occupations:
Here: 17.6% city: 4.7%
- Percentage of males in legal occupations:
Here: 3.3% city: 1.8%
- Percentage of males in healthcare practitioners and technical occupations:
Here: 3.0% city: 2.7%
- Percentage of males in service occupations:
Here: 2.3% city: 12.3%
- Percentage of males in sales and office occupations:
Here: 20.6% city: 14.9%
- Percentage of males in material moving occupations:
Here: 3.4% city: 6.2%
Occupations of females:
- Percentage of females in management occupations (except farmers):
Here: 19.8% city: 9.6%
- Percentage of females in business and financial operations occupations:
Here: 18.9% city: 8.4%
- Percentage of females in community and social services occupations:
Here: 1.0% city: 1.8%
- Percentage of females in legal occupations:
Here: 8.0% city: 1.8%
- Percentage of females in arts, design, entertainment, sports, and media occupations:
Here: 3.7% city: 2.9%
- Percentage of females in healthcare practitioners and technical occupations:
Here: 18.9% city: 7.7%
- Percentage of females in service occupations:
Here: 12.4% city: 20.5%
- Percentage of females in sales and office occupations:
Here: 18.4% city: 27.7%
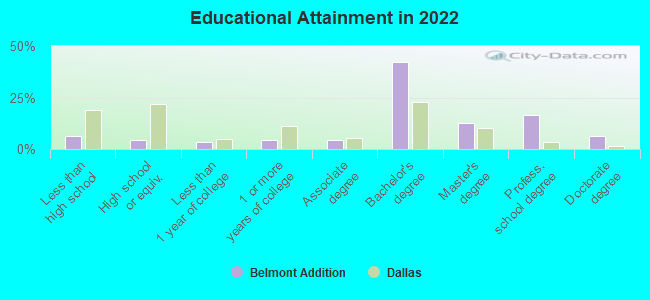
Education in this neighborhood (subdivision or community):
- Percentage of people 3 years and older in K-12 schools:
Belmont Addition: 12.9% Dallas: 17.3%
- Percentage of people 3 years and older in undergraduate colleges:
Belmont Addition: 2.4% Dallas: 4.1%
- Percentage of people 3 years and older in grad. or professional schools:
Belmont Addition: 3.1% Dallas: 1.7%
- Percentage of students K-12 enrolled in private schools:
Belmont Addition: 28.9% Dallas: 10.8%
Percentage of population below poverty level:
| Belmont Addition: | 7.8% |
| Dallas: | 17.8% |
Median year owner moved in (as recorded in 2022):
Median year renter moved in (as recorded in 2022):
| Belmont Addition: | 2017 |
| Dallas: | 2010 |
Median year renter moved in (as recorded in 2022):
| Belmont Addition: | 2017 |
| Dallas: | 2020 |
Percentage of married-couple families with both working:
| Belmont Addition: | 69.9% |
| Dallas: | 58.3% |
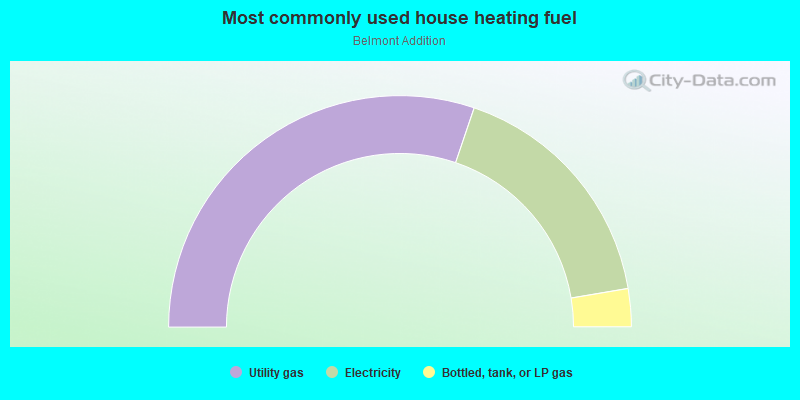
- 60.4%Utility gas
- 34.3%Electricity
- 5.3%Bottled, tank, or LP gas
Roads and streets:
Belmont Ave
Length: 0.45 miles
Direction: E-W
Address range: 5800 to 6099
Direction: E-W
Address range: 5800 to 6099
Goliad Ave
Length: 0.45 miles
Direction: E-W
Address range: 5800 to 6099
Direction: E-W
Address range: 5800 to 6099
Velasco Ave
Length: 0.45 miles
Direction: E-W
Address range: 5800 to 6099
Direction: E-W
Address range: 5800 to 6099
Palo Pinto Ave
Length: 0.45 miles
Direction: E-W
Address range: 5800 to 6099
Direction: E-W
Address range: 5800 to 6099
Concho St
Length: 0.25 miles
Direction: N-S
Address range: 2300 to 2599
Direction: N-S
Address range: 2300 to 2599
Delmar Ave
Length: 0.25 miles
Direction: N-S
Address range: 2300 to 2599
Direction: N-S
Address range: 2300 to 2599
Matilda St
Length: 0.25 miles
Direction: N-S
Address range: 2300 to 2599
Direction: N-S
Address range: 2300 to 2599
Skillman St
Length: 0.09 miles
Direction: N-S
Address range: 2313 to 2399
Direction: N-S
Address range: 2313 to 2399