Bella Vista neighborhood in Vancouver, Washington (WA), 98683 detailed profile
Settings
X

Business Search - 14 Million verified businesses
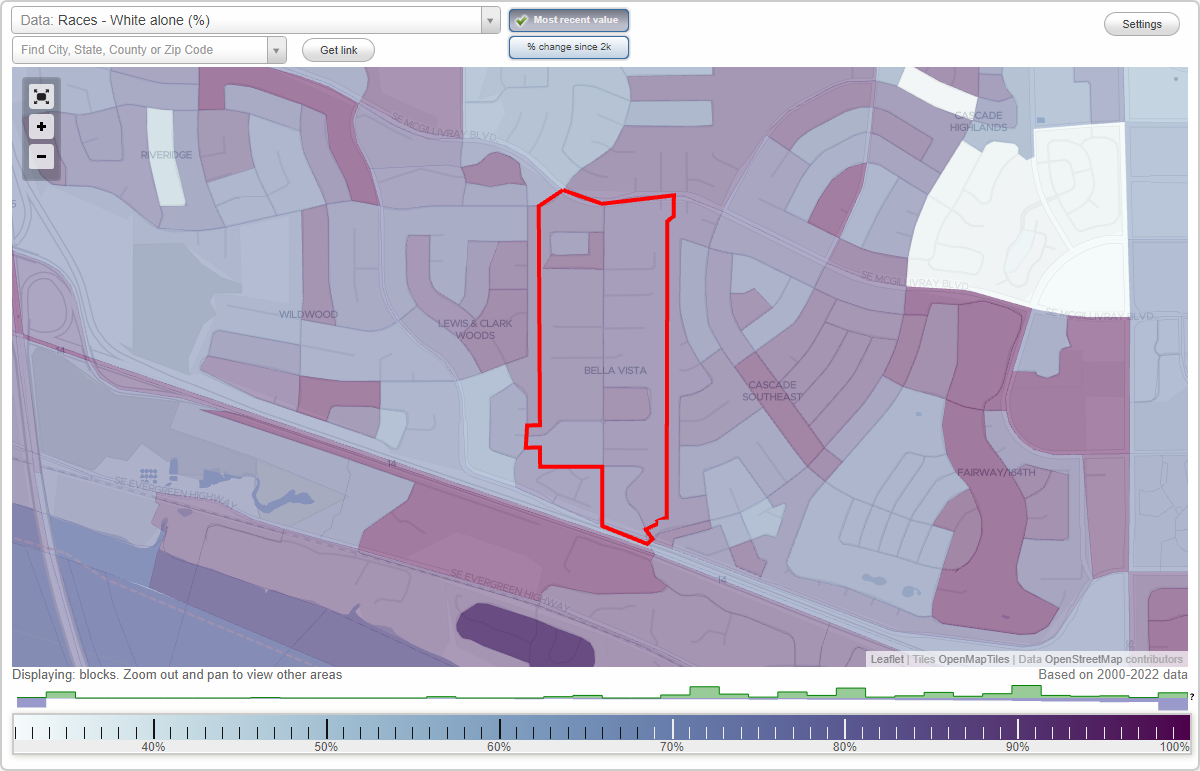
Area: 0.167 square miles
Population: 824
Population density:
| Bella Vista: | 4,927 people per square mile |
| Vancouver: | 4,545 people per square mile |

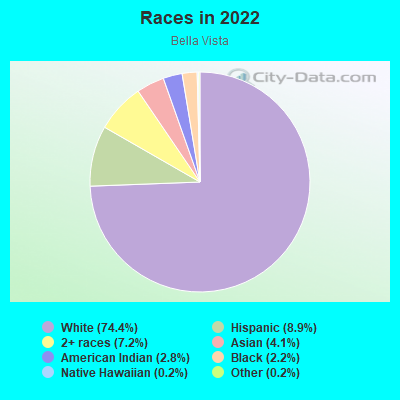
- 69074.4%White
- 838.9%Hispanic or Latino
- 677.2%Two or more races
- 384.1%Asian
- 262.8%American Indian
- 202.2%Black
- 20.2%Native Hawaiian and Other
Pacific Islander - 20.2%Some other race
Median household income in 2022:
| Bella Vista: | $95,359 |
| Vancouver: | $76,799 |
Distribution of median household income
![Distribution of median household income]()
- 8Less than $10,000
- 51$10,000 to $19,999
- 25$20,000 to $29,999
- 28$30,000 to $39,999
- 41$40,000 to $49,999
- 8$50,000 to $59,999
- 24$60,000 to $74,999
- 50$75,000 to $99,999
- 65$100,000 to $124,999
- 32$125,000 to $149,999
- 28$150,000 to $199,999
- 41$200,000 or more

Distribution of owner-occupied house/condo value
![Distribution of owner-occupied house/condo value]()
- 20Less than $50,000
- 9$50,000 to $99,999
- 6$100,000 to $149,999
- 18$150,000 to $199,999
- 2$200,000 to $249,999
- 12$250,000 to $299,999
- 65$300,000 to $399,999
- 70$400,000 to $499,999
- 72$500,000 to $749,999
- 31$750,000 to $999,999
- 12$1,000,000 or more

Distribution of rent paid by renters
![Distribution of rent paid by renters]()
- 10$700 to $799
- 9$800 to $899
- 11$900 to $999
- 16$1,000 to $1,249
- 35$1,250 to $1,499
- 35$1,500 to $1,999
- 45$2,000 or more

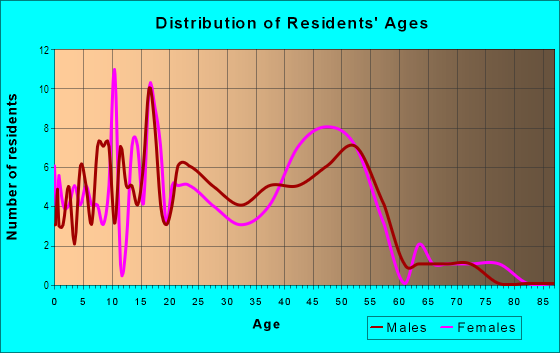
| Males: | 425 |
| Females: | 398 |
Males:
| This neighborhood: | 42.5 years |
| Whole city: | 34.7 years |
| This neighborhood: | 48.8 years |
| Whole city: | 39.9 years |
Average household size:
| Bella Vista: | 8.0 people |
| Vancouver: | 2.4 people |
Percentage of family households:
| Bella Vista: | 61.7% |
| Vancouver: | 40.5% |
| Here: | 64.2% |
| Vancouver: | 40.2% |
Percentage of married-couple families with children (among all households):
| Bella Vista: | 27.6% |
| Vancouver: | 27.2% |
Percentage of single-mother households (among all households):
| Bella Vista: | 3.7% |
| Vancouver: | 9.7% |
Percentage of never married males 15 years old and over:
Percentage of never married females 15 years old and over:
| Bella Vista: | 21.0% |
| Vancouver: | 18.8% |
Percentage of never married females 15 years old and over:
| Bella Vista: | 14.3% |
| city: | 17.6% |
Percentage of people that speak English not well or not at all:
| Bella Vista: | 3.4% |
| Vancouver: | 4.9% |
Percentage of people born in this state:
Percentage of people born in another U.S. state:
Percentage of native residents but born outside the U.S.:
Percentage of foreign born residents:
| Here: | 20.4% |
| Vancouver: | 30.3% |
Percentage of people born in another U.S. state:
| Bella Vista: | 69.7% |
| Vancouver: | 54.5% |
Percentage of native residents but born outside the U.S.:
| Here: | 1.3% |
| city: | 1.4% |
Percentage of foreign born residents:
| Here: | 8.6% |
| Vancouver: | 13.8% |
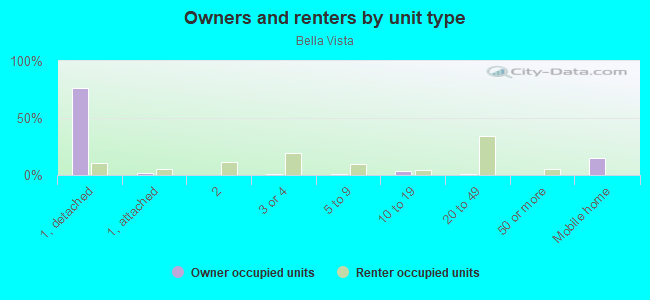
Owner-occupied
Renter-occupied

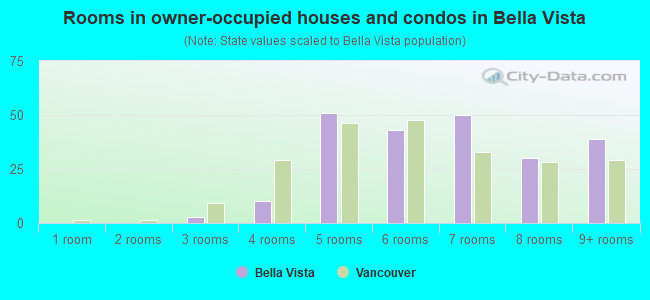
- Rooms in owner-occupied houses and condos in Bella Vista
- 01 room
- 02 rooms
- 33 rooms
- 104 rooms
- 515 rooms
- 436 rooms
- 507 rooms
- 308 rooms
- 399+ rooms
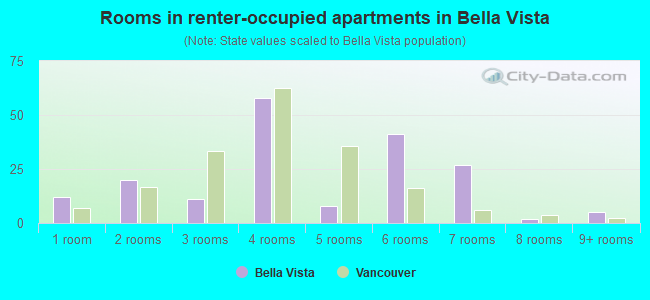
- Rooms in renter-occupied apartments in Bella Vista
- 121 room
- 202 rooms
- 113 rooms
- 584 rooms
- 85 rooms
- 416 rooms
- 277 rooms
- 28 rooms
- 59+ rooms
Owner-occupied
Renter-occupied
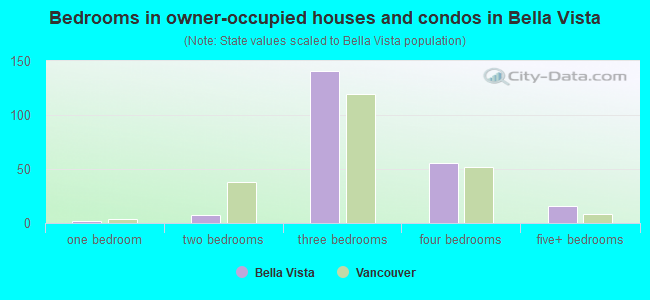
- Bedrooms in owner-occupied houses and condos in Bella Vista
- 0no bedroom
- 21 bedroom
- 72 bedrooms
- 1413 bedrooms
- 564 bedrooms
- 165+ bedrooms
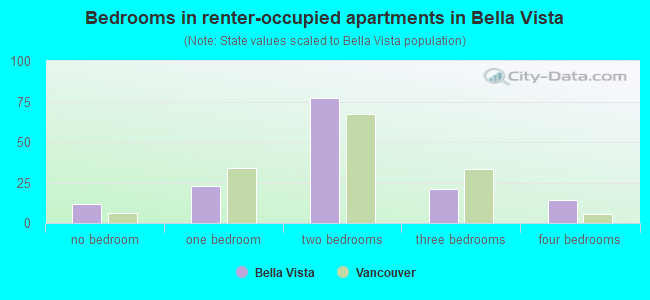
- Bedrooms in renter-occupied apartments in Bella Vista
- 12no bedroom
- 231 bedroom
- 772 bedrooms
- 213 bedrooms
- 144 bedrooms
- 05+ bedrooms
Average number of cars or other vehicles available in houses/condos:
Average number of cars or other vehicles available in apartments:
| This neighborhood: | 2.3 |
| Vancouver: | 2.2 |
Average number of cars or other vehicles available in apartments:
| Here: | 2.2 |
| city: | 1.4 |
Percentage of units with a mortgage:
| Bella Vista: | 72.6% |
| Vancouver: | 64.8% |
Average estimated value of detached houses in 2022 (78.7% of all units):
| Bella Vista: | $519,230 |
| Washington: | $734,307 |
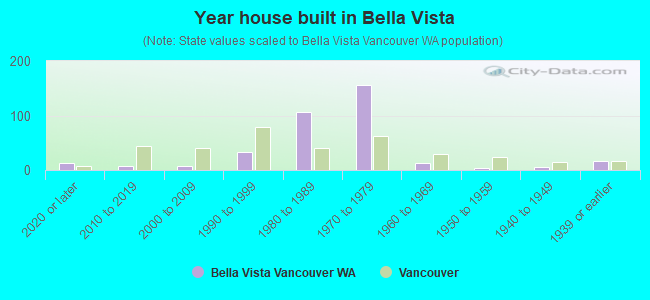
- Year house built in Bella Vista
- 122020 or later
- 72010 to 2019
- 82000 to 2009
- 331990 to 1999
- 1061980 to 1989
- 1561970 to 1979
- 121960 to 1969
- 41950 to 1959
- 51940 to 1949
- 171939 or earlier
City-data.com crime index for city in 2020 (higher means more crime):
| City: | 339.4 |
| U.S. average: | 219.5 |
Travel time to work (commute)
![Travel time to work (commute)]()
- 4Less than 5 minutes
- 285 to 9 minutes
- 4910 to 14 minutes
- 5615 to 19 minutes
- 3020 to 24 minutes
- 4525 to 29 minutes
- 3830 to 34 minutes
- 535 to 39 minutes
- 1440 to 44 minutes
- 2145 to 59 minutes
- 1060 to 89 minutes
- 2690 or more minutes

Means of transportation to work
![Means of transportation to work]()
- 68.6%265Drove a car alone
- 6.5%25Carpooled
- 2.6%10Bus
- 1.3%5Subway or elevated rail
- 0.5%2Motorcycle
- 0.5%2Bicycle
- 1.8%7Walked
- 8.5%33Other means
- 20.5%79Worked at home

Time leaving home to go to work
![Time leaving home to go to work]()
- 1212:00 a.m. to 4:59 a.m.
- 85:00 a.m. to 5:29 a.m.
- 195:30 a.m. to 5:59 a.m.
- 486:00 a.m. to 6:29 a.m.
- 286:30 a.m. to 6:59 a.m.
- 347:00 a.m. to 7:29 a.m.
- 237:30 a.m. to 7:59 a.m.
- 138:00 a.m. to 8:29 a.m.
- 118:30 a.m. to 8:59 a.m.
- 249:00 a.m. to 9:59 a.m.
- 1010:00 a.m. to 10:59 a.m.
- 611:00 a.m. to 11:59 a.m.
- 2212:00 p.m. to 3:59 p.m.
- 324:00 p.m. to 11:59 p.m.

Occupations of males:
- Percentage of males in management occupations (except farmers):
Here: 5.9% city: 9.6%
- Percentage of males in business and financial operations occupations:
Here: 17.4% city: 5.2%
- Percentage of males in computer and mathematical occupations:
Here: 2.1% city: 4.9%
- Percentage of males in architecture and engineering occupations:
Here: 9.8% city: 3.6%
- Percentage of males in community and social services occupations:
Here: 1.8% city: 1.0%
- Percentage of males in education, training, and library occupations:
Here: 4.3% city: 2.4%
- Percentage of males in arts, design, entertainment, sports, and media occupations:
Here: 4.4% city: 1.7%
- Percentage of males in service occupations:
Here: 8.3% city: 12.4%
- Percentage of males in sales and office occupations:
Here: 16.5% city: 15.7%
- Percentage of males in construction, extraction, and maintenance occupations:
Here: 4.7% city: 11.5%
- Percentage of males in transportation occupations:
Here: 11.1% city: 8.9%
- Percentage of males in material moving occupations:
Here: 12.6% city: 5.8%
Occupations of females:
- Percentage of females in management occupations (except farmers):
Here: 9.5% city: 8.2%
- Percentage of females in business and financial operations occupations:
Here: 4.7% city: 7.3%
- Percentage of females in computer and mathematical occupations:
Here: 1.5% city: 2.7%
- Percentage of females in community and social services occupations:
Here: 7.2% city: 1.9%
- Percentage of females in education, training, and library occupations:
Here: 9.4% city: 6.5%
- Percentage of females in healthcare practitioners and technical occupations:
Here: 7.3% city: 9.1%
- Percentage of females in service occupations:
Here: 20.0% city: 24.5%
- Percentage of females in sales and office occupations:
Here: 30.0% city: 26.7%
- Percentage of females in production occupations:
Here: 2.7% city: 3.4%
- Percentage of females in transportation occupations:
Here: 2.9% city: 2.0%
- Percentage of females in material moving occupations:
Here: 2.9% city: 2.3%
Percentage of people 16-64 in Armed Forces:
| Bella Vista: | 0.2% |
| Vancouver: | 0.7% |
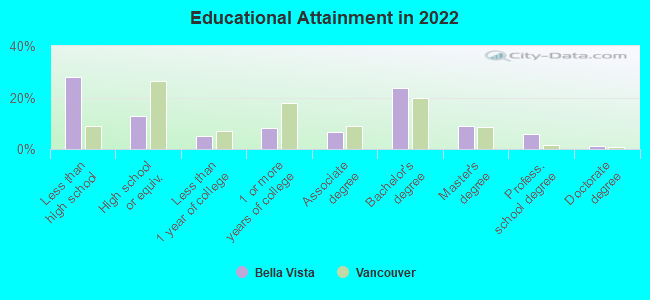
Education in this neighborhood (subdivision or community):
- Percentage of people 3 years and older in K-12 schools:
Bella Vista: 19.2% Vancouver: 16.4%
- Percentage of people 3 years and older in undergraduate colleges:
Bella Vista: 2.5% Vancouver: 4.1%
- Percentage of people 3 years and older in grad. or professional schools:
Bella Vista: 0.1% Vancouver: 1.0%
- Percentage of students K-12 enrolled in private schools:
Bella Vista: 17.2% Vancouver: 6.8%
Percentage of population below poverty level:
| Bella Vista: | 11.2% |
| Vancouver: | 10.0% |
Median year owner moved in (as recorded in 2022):
| Bella Vista: | 2003 |
| Vancouver: | 2012 |
Percentage of married-couple families with both working:
| Bella Vista: | 75.7% |
| Vancouver: | 55.7% |
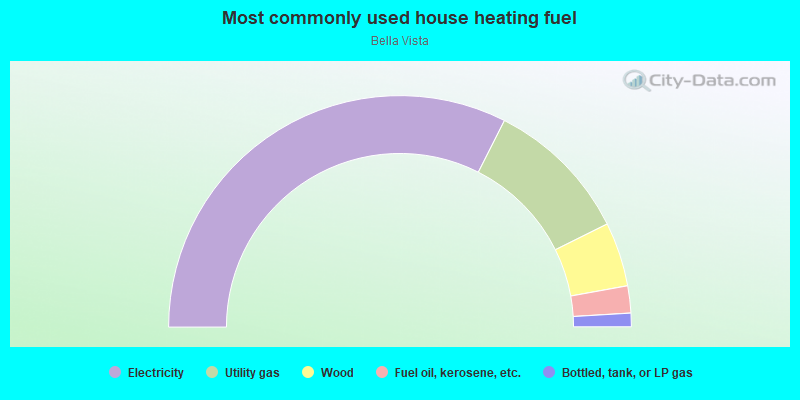
- 65.0%Electricity
- 20.4%Utility gas
- 9.0%Wood
- 3.8%Fuel oil, kerosene, etc.
- 1.9%Bottled, tank, or LP gas
Roads and streets:
SE Bella Vista Rd
Length: 0.93 miles
Directions: E-W, N-S, SE-NW, SW-NE
Address range: 1950 to 3199
Directions: E-W, N-S, SE-NW, SW-NE
Address range: 1950 to 3199
SE Bella Vis Lp
Length: 0.33 miles
Directions: E-W, N-S, SE-NW, SW-NE
Address range: 2600 to 2899
Directions: E-W, N-S, SE-NW, SW-NE
Address range: 2600 to 2899
SE 23rd Cir
Length: 0.26 miles
Direction: E-W
Address range: 13900 to 14399
Direction: E-W
Address range: 13900 to 14399
SE 25th Cir
Length: 0.23 miles
Direction: E-W
Address range: 14000 to 14199
Direction: E-W
Address range: 14000 to 14199
SE 21st St
Length: 0.20 miles
Directions: E-W, SW-NE
Address range: 13913 to 14413
Directions: E-W, SW-NE
Address range: 13913 to 14413
SE 22nd Cir
Length: 0.14 miles
Direction: E-W
Address range: 14200 to 14499
Direction: E-W
Address range: 14200 to 14499
SE 29th Cir
Length: 0.13 miles
Direction: E-W
Address range: 14200 to 14499
Direction: E-W
Address range: 14200 to 14499
SE 141st Pl
Length: 0.13 miles
Direction: SE-NW
Address range: 2001 to 2011
Direction: SE-NW
Address range: 2001 to 2011
SE 20th St
Length: 0.12 miles
Directions: E-W, N-S
Address range: 13900 to 14199
Directions: E-W, N-S
Address range: 13900 to 14199
SE 20th Way
Length: 0.07 miles
Direction: E-W
Address range: 14000 to 14111
Direction: E-W
Address range: 14000 to 14111
SE Cascade Park Dr
Length: 0.06 miles
Direction: E-W
Direction: E-W
SE 140th Ave
Length: 0.05 miles
Direction: N-S
Address range: 200 to 298
Direction: N-S
Address range: 200 to 298
SE 144th Ave
Length: 0.03 miles
Directions: N-S, SW-NE
Address range: 2001 to 14399
Directions: N-S, SW-NE
Address range: 2001 to 14399
SE Mackwood Ct
Length: 0.03 miles
Direction: N-S
Direction: N-S