Bayhill (Bayhill Office Park) neighborhood in San Bruno, California (CA), 94066 detailed profile
Settings
X

Business Search - 14 Million verified businesses
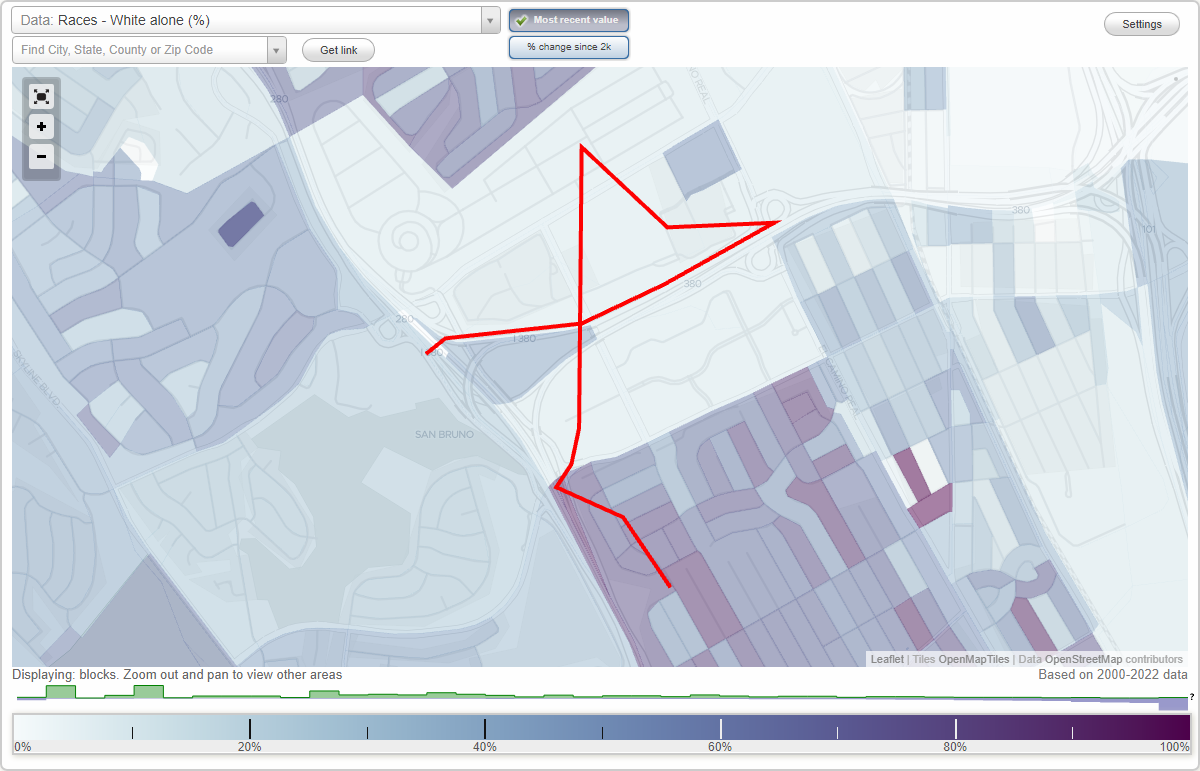
Area: 0.284 square miles
Population: 456
Population density:
| Bayhill (Bayhill Office Park): | 1,605 people per square mile |
| San Bruno: | 7,913 people per square mile |

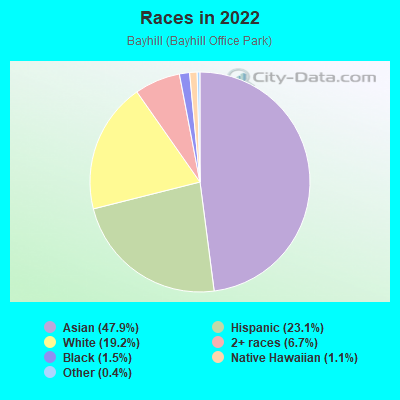
- 22247.9%Asian
- 10723.1%Hispanic or Latino
- 8919.2%White
- 316.7%Two or more races
- 71.5%Black
- 51.1%Native Hawaiian and Other
Pacific Islander - 20.4%Some other race
Median household income in 2022:
| Bayhill (Bayhill Office Park): | $162,754 |
| San Bruno: | $131,669 |
Distribution of median household income
![Distribution of median household income]()
- 25Less than $10,000
- 29$10,000 to $19,999
- 46$20,000 to $29,999
- 10$30,000 to $39,999
- 136$40,000 to $49,999
- 6$50,000 to $59,999
- 3$60,000 to $74,999
- 30$75,000 to $99,999
- 14$100,000 to $124,999
- 12$125,000 to $149,999
- 35$150,000 to $199,999
- 64$200,000 or more

Distribution of owner-occupied house/condo value
![Distribution of owner-occupied house/condo value]()
- 13$100,000 to $149,999
- 3$150,000 to $199,999
- 5$300,000 to $399,999
- 5$400,000 to $499,999
- 12$500,000 to $749,999
- 81$750,000 to $999,999
- 729$1,000,000 or more

Distribution of rent paid by renters
![Distribution of rent paid by renters]()
- 16$100 to $199
- 3$500 to $599
- 1$600 to $699
- 49$700 to $799
- 1$900 to $999
- 8$1,000 to $1,249
- 3$1,250 to $1,499
- 8$1,500 to $1,999
- 123$2,000 or more

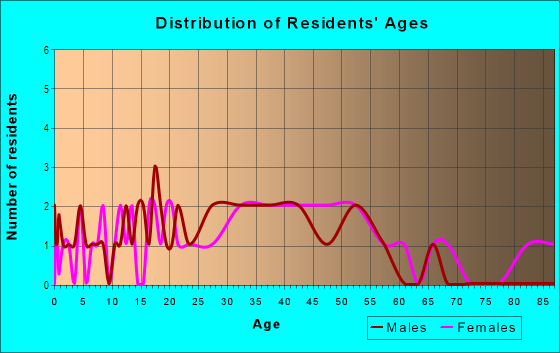
| Males: | 208 |
| Females: | 247 |
Males:
| This neighborhood: | 39.8 years |
| Whole city: | 36.8 years |
| This neighborhood: | 38.3 years |
| Whole city: | 41.6 years |
Average household size:
| Bayhill (Bayhill Office Park): | 2.5 people |
| San Bruno: | 2.8 people |
Percentage of family households:
| Bayhill (Bayhill Office Park): | 43.0% |
| San Bruno: | 45.6% |
| Here: | 49.2% |
| San Bruno: | 52.4% |
Percentage of married-couple families with children (among all households):
| Bayhill (Bayhill Office Park): | 37.2% |
| San Bruno: | 27.4% |
Percentage of single-mother households (among all households):
| Bayhill (Bayhill Office Park): | 132.8% |
| San Bruno: | 5.2% |
Percentage of never married males 15 years old and over:
Percentage of never married females 15 years old and over:
| Bayhill (Bayhill Office Park): | 21.3% |
| San Bruno: | 20.4% |
Percentage of never married females 15 years old and over:
| Bayhill (Bayhill Office Park): | 20.2% |
| city: | 15.1% |
Percentage of people that speak English not well or not at all:
| Bayhill (Bayhill Office Park): | 13.9% |
| San Bruno: | 7.3% |
Percentage of people born in this state:
Percentage of people born in another U.S. state:
Percentage of native residents but born outside the U.S.:
Percentage of foreign born residents:
| Here: | 44.1% |
| San Bruno: | 53.6% |
Percentage of people born in another U.S. state:
| Bayhill (Bayhill Office Park): | 10.9% |
| San Bruno: | 7.8% |
Percentage of native residents but born outside the U.S.:
| Here: | 2.1% |
| city: | 1.5% |
Percentage of foreign born residents:
| Here: | 43.0% |
| San Bruno: | 37.2% |
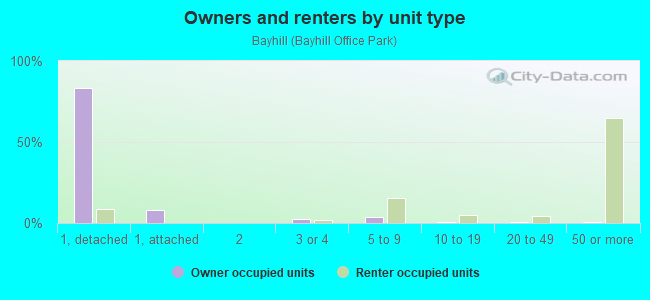
Owner-occupied
Renter-occupied

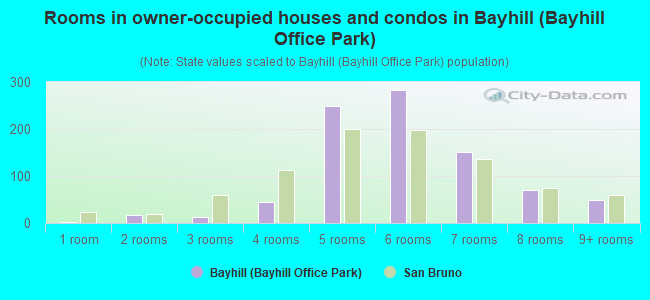
- Rooms in owner-occupied houses and condos in Bayhill <
> - 31 room
- 182 rooms
- 123 rooms
- 444 rooms
- 2495 rooms
- 2836 rooms
- 1517 rooms
- 708 rooms
- 509+ rooms
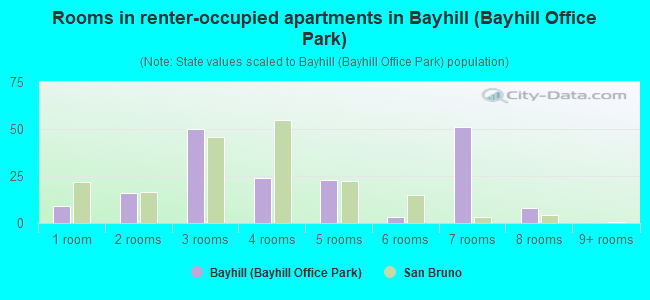
- Rooms in renter-occupied apartments in Bayhill <
> - 91 room
- 162 rooms
- 503 rooms
- 244 rooms
- 235 rooms
- 36 rooms
- 517 rooms
- 88 rooms
- 09+ rooms
Owner-occupied
Renter-occupied
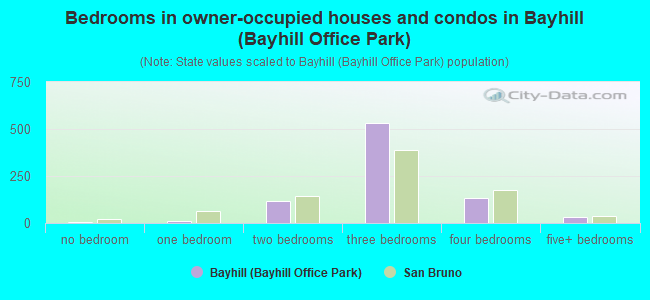
- Bedrooms in owner-occupied houses and condos in Bayhill <
> - 3no bedroom
- 121 bedroom
- 1182 bedrooms
- 5313 bedrooms
- 1354 bedrooms
- 305+ bedrooms
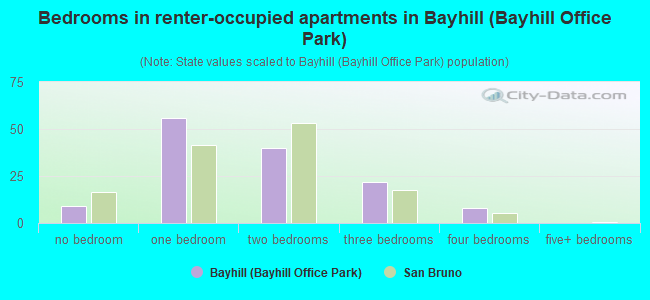
- Bedrooms in renter-occupied apartments in Bayhill <
> - 9no bedroom
- 561 bedroom
- 402 bedrooms
- 223 bedrooms
- 84 bedrooms
- 05+ bedrooms
Average number of cars or other vehicles available in houses/condos:
Average number of cars or other vehicles available in apartments:
| This neighborhood: | 2.0 |
| San Bruno: | 2.2 |
Average number of cars or other vehicles available in apartments:
| Here: | 1.6 |
| city: | 1.6 |
Percentage of units with a mortgage:
| Bayhill (Bayhill Office Park): | 10.7% |
| San Bruno: | 69.6% |
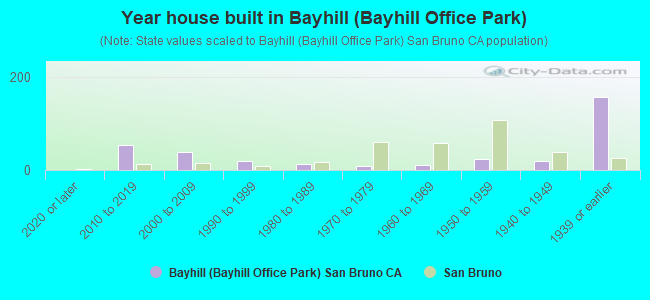
- Year house built in Bayhill <
> - 02020 or later
- 542010 to 2019
- 382000 to 2009
- 201990 to 1999
- 141980 to 1989
- 91970 to 1979
- 111960 to 1969
- 231950 to 1959
- 201940 to 1949
- 1571939 or earlier
City-data.com crime index for city in 2020 (higher means more crime):
| City: | 177.8 |
| U.S. average: | 219.5 |
Travel time to work (commute)
![Travel time to work (commute)]()
- 13Less than 5 minutes
- 535 to 9 minutes
- 6910 to 14 minutes
- 10415 to 19 minutes
- 5320 to 24 minutes
- 2225 to 29 minutes
- 7930 to 34 minutes
- 835 to 39 minutes
- 5240 to 44 minutes
- 2745 to 59 minutes
- 3260 to 89 minutes
- 790 or more minutes

Means of transportation to work
![Means of transportation to work]()
- 55.9%165Drove a car alone
- 9.8%29Carpooled
- 4.7%14Bus
- 5.8%17Subway or elevated rail
- 3.7%11Long-distance train or commuter rail
- 1.0%3Taxi
- 4.1%12Walked
- 23.0%68Other means
- 13.9%41Worked at home

Time leaving home to go to work
![Time leaving home to go to work]()
- 3912:00 a.m. to 4:59 a.m.
- 125:00 a.m. to 5:29 a.m.
- 135:30 a.m. to 5:59 a.m.
- 186:00 a.m. to 6:29 a.m.
- 366:30 a.m. to 6:59 a.m.
- 437:00 a.m. to 7:29 a.m.
- 447:30 a.m. to 7:59 a.m.
- 758:00 a.m. to 8:29 a.m.
- 528:30 a.m. to 8:59 a.m.
- 1039:00 a.m. to 9:59 a.m.
- 2310:00 a.m. to 10:59 a.m.
- 1311:00 a.m. to 11:59 a.m.
- 3712:00 p.m. to 3:59 p.m.
- 414:00 p.m. to 11:59 p.m.

Occupations of males:
- Percentage of males in management occupations (except farmers):
Here: 26.9% city: 12.7%
- Percentage of males in business and financial operations occupations:
Here: 1.1% city: 4.2%
- Percentage of males in computer and mathematical occupations:
Here: 25.6% city: 9.0%
- Percentage of males in architecture and engineering occupations:
Here: 6.9% city: 4.1%
- Percentage of males in life, physical, and social science occupations:
Here: 1.8% city: 2.6%
- Percentage of males in arts, design, entertainment, sports, and media occupations:
Here: 1.3% city: 1.7%
- Percentage of males in service occupations:
Here: 10.5% city: 17.6%
- Percentage of males in sales and office occupations:
Here: 8.2% city: 13.7%
- Percentage of males in construction, extraction, and maintenance occupations:
Here: 6.0% city: 9.3%
- Percentage of males in production occupations:
Here: 8.2% city: 5.4%
Occupations of females:
- Percentage of females in management occupations (except farmers):
Here: 16.9% city: 11.1%
- Percentage of females in business and financial operations occupations:
Here: 10.3% city: 10.4%
- Percentage of females in computer and mathematical occupations:
Here: 10.5% city: 3.0%
- Percentage of females in life, physical, and social science occupations:
Here: 8.7% city: 3.2%
- Percentage of females in community and social services occupations:
Here: 2.0% city: 1.3%
- Percentage of females in education, training, and library occupations:
Here: 8.0% city: 5.5%
- Percentage of females in arts, design, entertainment, sports, and media occupations:
Here: 1.5% city: 1.1%
- Percentage of females in healthcare practitioners and technical occupations:
Here: 5.2% city: 9.0%
- Percentage of females in service occupations:
Here: 11.5% city: 20.3%
- Percentage of females in sales and office occupations:
Here: 18.0% city: 26.0%
- Percentage of females in transportation occupations:
Here: 6.4% city: 2.2%
- Percentage of females in material moving occupations:
Here: 2.3% city: 3.0%
Percentage of people 16-64 in Armed Forces:
| Bayhill (Bayhill Office Park): | 0.4% |
| San Bruno: | 0.2% |
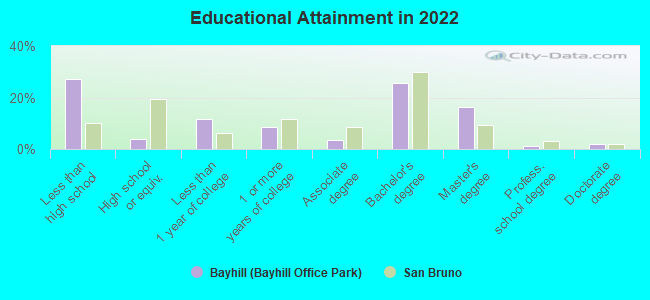
Education in this neighborhood (subdivision or community):
- Percentage of people 3 years and older in K-12 schools:
Bayhill (Bayhill Office Park): 68.8% San Bruno: 13.8%
- Percentage of people 3 years and older in undergraduate colleges:
Bayhill (Bayhill Office Park): 4.9% San Bruno: 6.2%
- Percentage of people 3 years and older in grad. or professional schools:
Bayhill (Bayhill Office Park): 3.8% San Bruno: 1.4%
- Percentage of students K-12 enrolled in private schools:
Bayhill (Bayhill Office Park): 22.8% San Bruno: 22.1%
Percentage of population below poverty level:
| Bayhill (Bayhill Office Park): | 7.9% |
| San Bruno: | 5.6% |
Median year owner moved in (as recorded in 2022):
Median year renter moved in (as recorded in 2022):
| Bayhill (Bayhill Office Park): | 2005 |
| San Bruno: | 2003 |
Median year renter moved in (as recorded in 2022):
| Bayhill (Bayhill Office Park): | 2016 |
| San Bruno: | 2015 |
Percentage of married-couple families with both working:
| Bayhill (Bayhill Office Park): | 258.2% |
| San Bruno: | 80.8% |
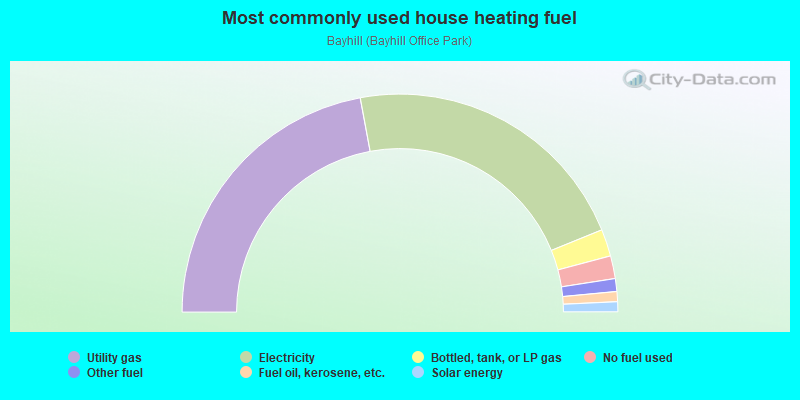
- 44.2%Utility gas
- 43.6%Electricity
- 4.0%Bottled, tank, or LP gas
- 3.4%No fuel used
- 1.9%Other fuel
- 1.5%Fuel oil, kerosene, etc.
- 1.5%Solar energy
Limited-access highways (interstate or state) in this neighborhood:
I- 380
Length: 1.47 miles
Directions: E-W, SE-NW, SW-NE
Directions: E-W, SE-NW, SW-NE
Highways in this neighborhood:
State Hwy 82 (el Camino Real)
Length: 0.33 miles
Directions: N-S, SE-NW
Directions: N-S, SE-NW
Roads and streets:
I- 280
Length: 1.00 miles
Directions: E-W, SE-NW, SW-NE
Directions: E-W, SE-NW, SW-NE
San Bruno Ave W
Length: 0.88 miles
Directions: E-W, SW-NE
Address range: 700 to 1599
Directions: E-W, SW-NE
Address range: 700 to 1599
Bayhill Dr
Length: 0.81 miles
Directions: E-W, N-S, SW-NE
Address range: 900 to 1299
Directions: E-W, N-S, SW-NE
Address range: 900 to 1299
Grundy Ln
Length: 0.41 miles
Directions: E-W, N-S, SW-NE
Address range: 1100 to 1299
Directions: E-W, N-S, SW-NE
Address range: 1100 to 1299
Cherry Ave
Length: 0.35 miles
Directions: N-S, SE-NW
Address range: 776 to 1023
Directions: N-S, SE-NW
Address range: 776 to 1023
Elm Ave
Length: 0.25 miles
Directions: E-W, N-S, SE-NW
Address range: 800 to 999
Directions: E-W, N-S, SE-NW
Address range: 800 to 999
Traeger Ave
Length: 0.10 miles
Direction: SE-NW
Address range: 1 to 299
Direction: SE-NW
Address range: 1 to 299
Other features:
San Bruno Crk
Length: 0.62 miles
Directions: E-W, N-S, SE-NW, SW-NE
Directions: E-W, N-S, SE-NW, SW-NE