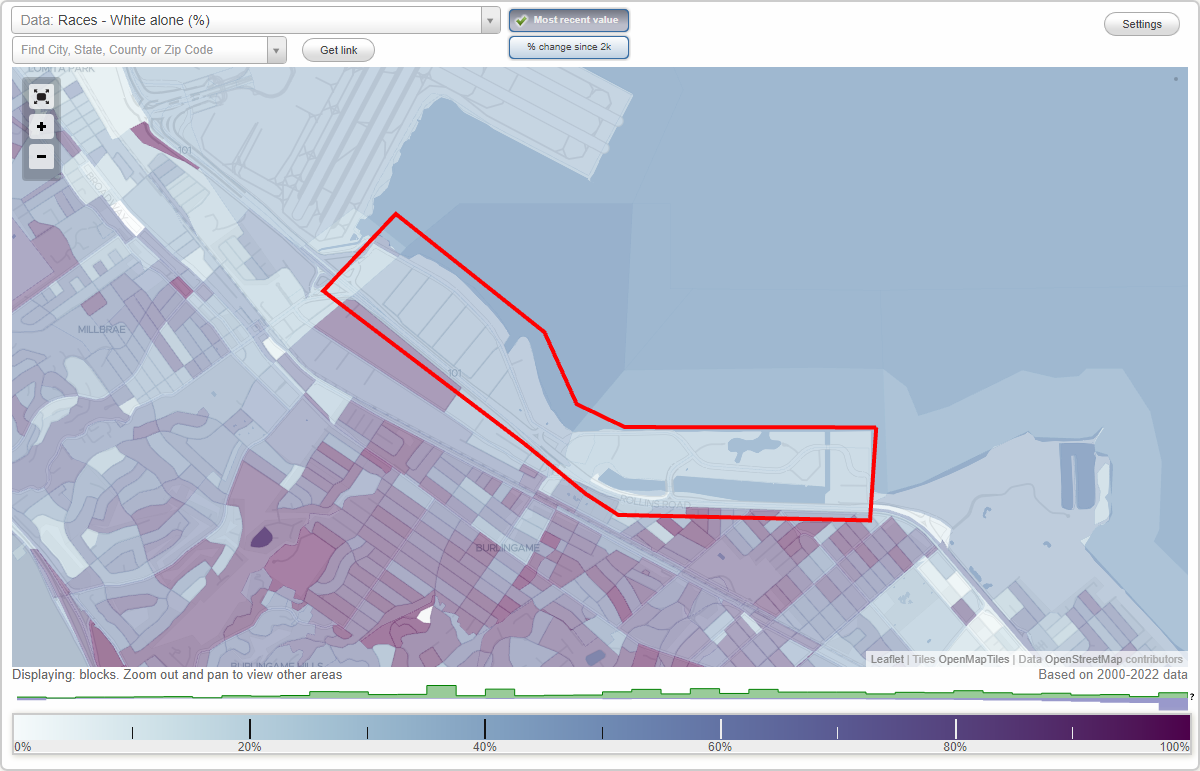
Bayfront neighborhood in Burlingame, California (CA), 94010 detailed profile
Settings
X

Business Search - 14 Million verified businesses
Area: 1.196 square miles
Population: 1,632
Population density:
| Bayfront: | 1,365 people per square mile |
| Burlingame: | 7,151 people per square mile |

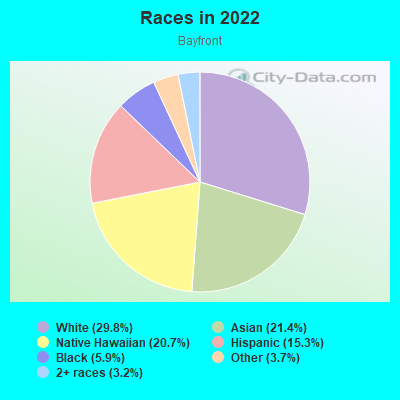
- 63029.8%White
- 45221.4%Asian
- 43820.7%Native Hawaiian and Other
Pacific Islander - 32415.3%Hispanic or Latino
- 1255.9%Black
- 783.7%Some other race
- 683.2%Two or more races
Distribution of median household income
![Distribution of median household income]()
- 22Less than $10,000
- 144$10,000 to $19,999
- 155$20,000 to $29,999
- 18$30,000 to $39,999
- 88$40,000 to $49,999
- 29$50,000 to $59,999
- 53$60,000 to $74,999
- 36$75,000 to $99,999
- 100$100,000 to $124,999
- 49$125,000 to $149,999
- 157$150,000 to $199,999
- 230$200,000 or more

Distribution of owner-occupied house/condo value
![Distribution of owner-occupied house/condo value]()
- 3Less than $50,000
- 15$100,000 to $149,999
- 9$150,000 to $199,999
- 891$200,000 to $249,999
- 117$250,000 to $299,999
- 153$400,000 to $499,999
- 525$500,000 to $749,999
- 21$750,000 to $999,999
- 212$1,000,000 or more

Distribution of rent paid by renters
![Distribution of rent paid by renters]()
- 34$300 to $399
- 47$600 to $699
- 249$1,000 to $1,249
- 30$1,250 to $1,499
- 88$1,500 to $1,999
- 440$2,000 or more

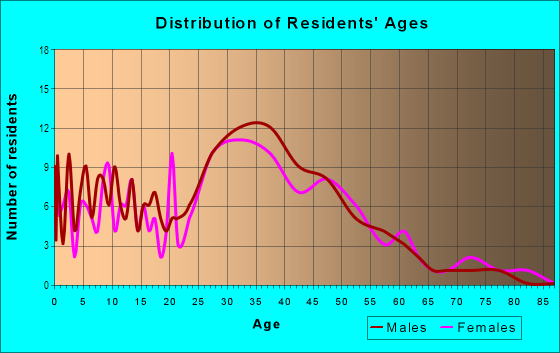
| Males: | 825 |
| Females: | 807 |
Males:
| This neighborhood: | 36.2 years |
| Whole city: | 39.7 years |
| This neighborhood: | 37.8 years |
| Whole city: | 41.7 years |
Average household size:
| Bayfront: | 6.6 people |
| Burlingame: | 2.5 people |
Percentage of family households:
| Bayfront: | 41.8% |
| Burlingame: | 45.6% |
| Here: | 41.0% |
| Burlingame: | 51.2% |
Percentage of married-couple families with children (among all households):
| Bayfront: | 38.6% |
| Burlingame: | 34.1% |
Percentage of single-mother households (among all households):
| Bayfront: | 15.7% |
| Burlingame: | 3.6% |
Percentage of never married males 15 years old and over:
Percentage of never married females 15 years old and over:
| Bayfront: | 23.2% |
| Burlingame: | 18.3% |
Percentage of never married females 15 years old and over:
| Bayfront: | 17.1% |
| city: | 13.4% |
Percentage of people that speak English not well or not at all:
| Bayfront: | 3.0% |
| Burlingame: | 4.7% |
Percentage of people born in this state:
Percentage of people born in another U.S. state:
Percentage of native residents but born outside the U.S.:
Percentage of foreign born residents:
| Here: | 54.1% |
| Burlingame: | 52.5% |
Percentage of people born in another U.S. state:
| Bayfront: | 13.6% |
| Burlingame: | 16.0% |
Percentage of native residents but born outside the U.S.:
| Here: | 1.3% |
| city: | 1.6% |
Percentage of foreign born residents:
| Here: | 31.0% |
| Burlingame: | 30.0% |

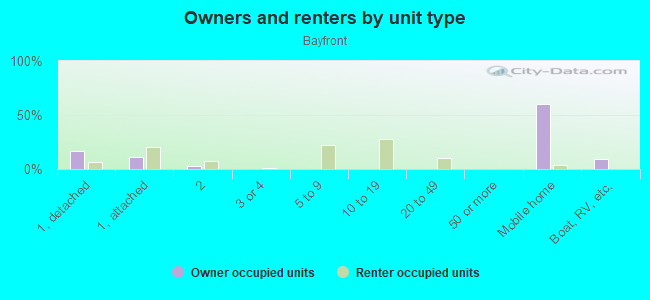
Owner-occupied
Renter-occupied

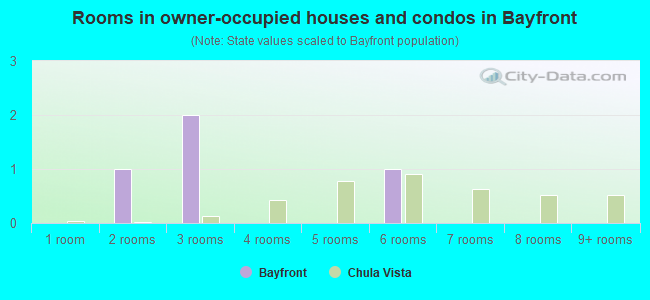
- Rooms in owner-occupied houses and condos in Bayfront
- 31 room
- 1582 rooms
- 153 rooms
- 314 rooms
- 765 rooms
- 406 rooms
- 417 rooms
- 368 rooms
- 4639+ rooms
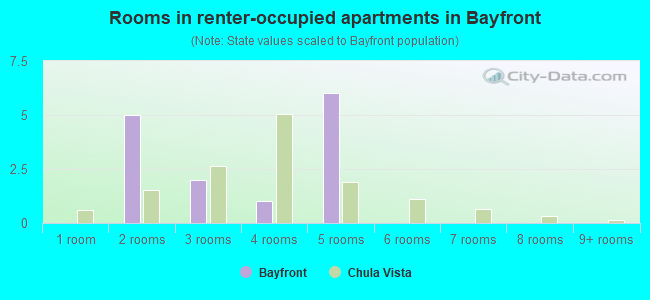
- Rooms in renter-occupied apartments in Bayfront
- 1591 room
- 842 rooms
- 1593 rooms
- 924 rooms
- 435 rooms
- 216 rooms
- 247 rooms
- 2708 rooms
- 1149+ rooms
Owner-occupied
Renter-occupied
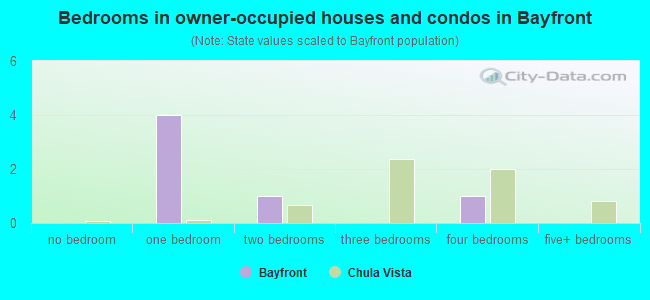
- Bedrooms in owner-occupied houses and condos in Bayfront
- 3no bedroom
- 6431 bedroom
- 762 bedrooms
- 1043 bedrooms
- 324 bedrooms
- 915+ bedrooms
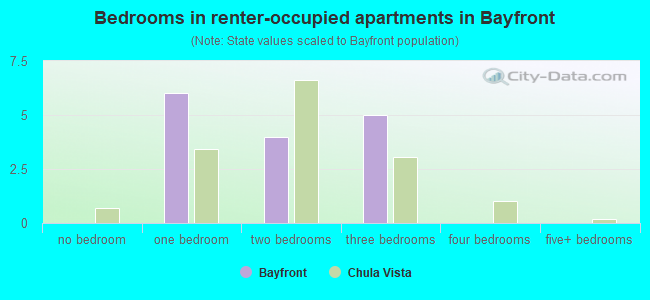
- Bedrooms in renter-occupied apartments in Bayfront
- 167no bedroom
- 2321 bedroom
- 1342 bedrooms
- 423 bedrooms
- 2094 bedrooms
- 05+ bedrooms
Average number of cars or other vehicles available in houses/condos:
Average number of cars or other vehicles available in apartments:
| This neighborhood: | 2.3 |
| Burlingame: | 2.2 |
Average number of cars or other vehicles available in apartments:
| Here: | 1.6 |
| city: | 1.4 |
Percentage of units with a mortgage:
| Bayfront: | 80.0% |
| Burlingame: | 71.7% |
Average estimated value of detached houses in 2022 (26.1% of all units):
| Bayfront: | $1,308,780 |
| California: | $988,808 |
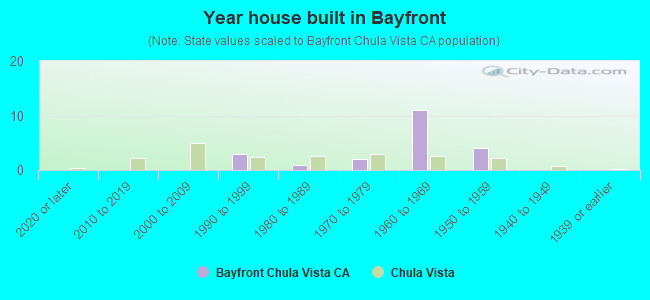
- Year house built in Bayfront
- 812020 or later
- 662010 to 2019
- 812000 to 2009
- 121990 to 1999
- 581980 to 1989
- 1561970 to 1979
- 811960 to 1969
- 1501950 to 1959
- 1331940 to 1949
- 1391939 or earlier
City-data.com crime index for city in 2020 (higher means more crime):
| City: | 236.7 |
| U.S. average: | 219.5 |
Travel time to work (commute)
![Travel time to work (commute)]()
- 12Less than 5 minutes
- 645 to 9 minutes
- 14810 to 14 minutes
- 10015 to 19 minutes
- 9920 to 24 minutes
- 3325 to 29 minutes
- 12030 to 34 minutes
- 3535 to 39 minutes
- 5840 to 44 minutes
- 10545 to 59 minutes
- 15860 to 89 minutes
- 6290 or more minutes

Means of transportation to work
![Means of transportation to work]()
- 58.2%617Drove a car alone
- 5.8%62Carpooled
- 74.6%791Bus
- 7.5%80Subway or elevated rail
- 5.0%53Long-distance train or commuter rail
- 0.5%5Light rail, streetcar or trolley
- 0.8%8Taxi
- 0.8%8Motorcycle
- 1.2%13Bicycle
- 2.0%21Walked
- 2.8%30Other means
- 19.6%208Worked at home

Time leaving home to go to work
![Time leaving home to go to work]()
- 11812:00 a.m. to 4:59 a.m.
- 295:00 a.m. to 5:29 a.m.
- 185:30 a.m. to 5:59 a.m.
- 916:00 a.m. to 6:29 a.m.
- 676:30 a.m. to 6:59 a.m.
- 957:00 a.m. to 7:29 a.m.
- 1197:30 a.m. to 7:59 a.m.
- 1118:00 a.m. to 8:29 a.m.
- 628:30 a.m. to 8:59 a.m.
- 1149:00 a.m. to 9:59 a.m.
- 4510:00 a.m. to 10:59 a.m.
- 3011:00 a.m. to 11:59 a.m.
- 6212:00 p.m. to 3:59 p.m.
- 554:00 p.m. to 11:59 p.m.

Occupations of males:
- Percentage of males in management occupations (except farmers):
Here: 11.3% city: 21.1%
- Percentage of males in business and financial operations occupations:
Here: 8.0% city: 8.6%
- Percentage of males in computer and mathematical occupations:
Here: 9.1% city: 7.1%
- Percentage of males in architecture and engineering occupations:
Here: 4.0% city: 4.9%
- Percentage of males in life, physical, and social science occupations:
Here: 4.8% city: 3.3%
- Percentage of males in community and social services occupations:
Here: 1.4% city: 1.3%
- Percentage of males in education, training, and library occupations:
Here: 1.9% city: 3.4%
- Percentage of males in arts, design, entertainment, sports, and media occupations:
Here: 9.8% city: 2.6%
- Percentage of males in healthcare practitioners and technical occupations:
Here: 5.7% city: 3.1%
- Percentage of males in service occupations:
Here: 12.1% city: 12.7%
- Percentage of males in sales and office occupations:
Here: 15.8% city: 12.6%
- Percentage of males in construction, extraction, and maintenance occupations:
Here: 3.7% city: 6.1%
- Percentage of males in production occupations:
Here: 2.7% city: 1.8%
- Percentage of males in transportation occupations:
Here: 5.5% city: 3.9%
- Percentage of males in material moving occupations:
Here: 2.0% city: 3.4%
Occupations of females:
- Percentage of females in management occupations (except farmers):
Here: 17.9% city: 20.8%
- Percentage of females in business and financial operations occupations:
Here: 8.6% city: 10.1%
- Percentage of females in computer and mathematical occupations:
Here: 1.6% city: 4.3%
- Percentage of females in architecture and engineering occupations:
Here: 7.4% city: 2.4%
- Percentage of females in life, physical, and social science occupations:
Here: 8.6% city: 4.3%
- Percentage of females in education, training, and library occupations:
Here: 4.8% city: 7.2%
- Percentage of females in arts, design, entertainment, sports, and media occupations:
Here: 5.8% city: 2.1%
- Percentage of females in healthcare practitioners and technical occupations:
Here: 8.3% city: 10.3%
- Percentage of females in service occupations:
Here: 12.7% city: 11.2%
- Percentage of females in sales and office occupations:
Here: 15.6% city: 19.2%
- Percentage of females in transportation occupations:
Here: 5.1% city: 1.8%
- Percentage of females in material moving occupations:
Here: 2.1% city: 0.9%
Education in this neighborhood (subdivision or community):
- Percentage of people 3 years and older in K-12 schools:
Bayfront: 19.5% Burlingame: 17.3%
- Percentage of people 3 years and older in undergraduate colleges:
Bayfront: 5.3% Burlingame: 4.6%
- Percentage of people 3 years and older in grad. or professional schools:
Bayfront: 30.9% Burlingame: 1.3%
- Percentage of students K-12 enrolled in private schools:
Bayfront: 216.6% Burlingame: 20.4%
Percentage of population below poverty level:
| Bayfront: | 3.9% |
| Burlingame: | 5.0% |
Median year owner moved in (as recorded in 2022):
| Bayfront: | 2002 |
| Burlingame: | 2002 |
Percentage of married-couple families with both working:
| Bayfront: | 79.7% |
| Burlingame: | 75.6% |
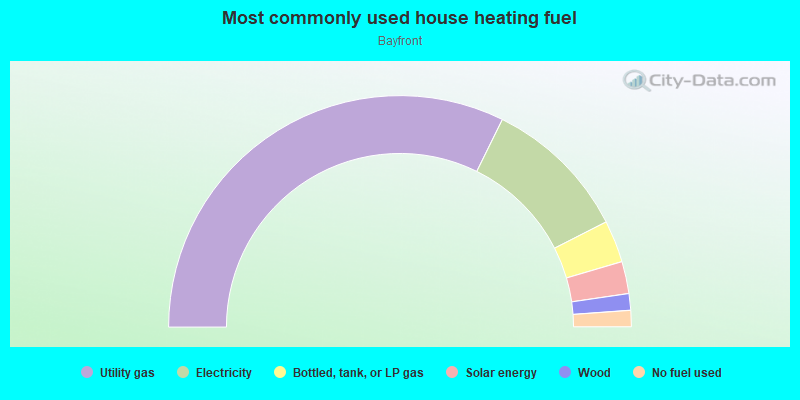
- 46.2%Utility gas
- 37.2%Electricity
- 7.2%No fuel used
- 4.1%Bottled, tank, or LP gas
- 2.1%Wood
- 2.0%Solar energy
- 1.3%Other fuel
Limited-access highways (interstate or state) in this neighborhood:
Bayshore Fwy (US Hwy 101)
Length: 3.64 miles
Directions: E-W, SE-NW
Directions: E-W, SE-NW
Roads and streets:
US Hwy 101
Length: 3.86 miles
Directions: E-W, N-S, SE-NW
Directions: E-W, N-S, SE-NW
Airport Blvd
Length: 2.15 miles
Directions: E-W, N-S, SE-NW, SW-NE
Address range: 100 to 1199
Directions: E-W, N-S, SE-NW, SW-NE
Address range: 100 to 1199
Rollins Rd
Length: 1.68 miles
Directions: E-W, SE-NW
Address range: 200 to 1025
Directions: E-W, SE-NW
Address range: 200 to 1025
Bayshore Hwy
Length: 1.56 miles
Directions: N-S, SE-NW
Address range: 1200 to 1388
Directions: N-S, SE-NW
Address range: 1200 to 1388
Adrian Rd
Length: 0.90 miles
Directions: E-W, SE-NW
Address range: 1501 to 1799
Directions: E-W, SE-NW
Address range: 1501 to 1799
Anza Blvd
Length: 0.75 miles
Directions: E-W, N-S, SE-NW, SW-NE
Address range: 1 to 199
Directions: E-W, N-S, SE-NW, SW-NE
Address range: 1 to 199
Gilbreth Rd
Length: 0.62 miles
Directions: E-W, SE-NW
Address range: 1500 to 1899
Directions: E-W, SE-NW
Address range: 1500 to 1899
Malcolm Rd
Length: 0.30 miles
Direction: SW-NE
Address range: 800 to 899
Direction: SW-NE
Address range: 800 to 899
Stanton Rd
Length: 0.30 miles
Direction: SW-NE
Address range: 800 to 899
Direction: SW-NE
Address range: 800 to 899
Hinckley Rd
Length: 0.28 miles
Direction: SW-NE
Address range: 800 to 899
Direction: SW-NE
Address range: 800 to 899
Mitten Rd
Length: 0.28 miles
Direction: SW-NE
Address range: 800 to 899
Direction: SW-NE
Address range: 800 to 899
Burlway Rd
Length: 0.26 miles
Directions: E-W, SW-NE
Address range: 700 to 899
Directions: E-W, SW-NE
Address range: 700 to 899
Cowan Rd
Length: 0.26 miles
Directions: N-S, SW-NE
Address range: 800 to 899
Directions: N-S, SW-NE
Address range: 800 to 899
Mahler Rd
Length: 0.24 miles
Directions: E-W, SW-NE
Address range: 800 to 899
Directions: E-W, SW-NE
Address range: 800 to 899
E Millbrae Ave
Length: 0.19 miles
Directions: E-W, SW-NE
Address range: 424 to 498
Directions: E-W, SW-NE
Address range: 424 to 498
Lang Rd
Length: 0.18 miles
Directions: E-W, SE-NW
Address range: 300 to 399
Directions: E-W, SE-NW
Address range: 300 to 399
Broadway Exd
Length: 0.18 miles
Directions: N-S, SE-NW, SW-NE
Directions: N-S, SE-NW, SW-NE
Beach Rd
Length: 0.17 miles
Direction: E-W
Address range: 300 to 499
Direction: E-W
Address range: 300 to 499
Bayview Pl
Length: 0.09 miles
Directions: E-W, SE-NW
Address range: 1 to 99
Directions: E-W, SE-NW
Address range: 1 to 99
Morrell Ave
Length: 0.06 miles
Directions: N-S, SW-NE
Address range: 773 to 864
Directions: N-S, SW-NE
Address range: 773 to 864
Cadillac Way
Length: 0.05 miles
Directions: N-S, SE-NW
Address range: 900 to 999
Directions: N-S, SE-NW
Address range: 900 to 999
Toyon Dr
Length: 0.05 miles
Directions: N-S, SW-NE
Address range: 900 to 999
Directions: N-S, SW-NE
Address range: 900 to 999
Winchester Pl
Length: 0.04 miles
Direction: N-S
Address range: 1 to 99
Direction: N-S
Address range: 1 to 99
Broadway
Length: 0.03 miles
Directions: N-S, SW-NE
Address range: 900 to 955
Directions: N-S, SW-NE
Address range: 900 to 955
Other features:
Stream
Length: 0.14 miles
Directions: SE-NW, SW-NE
Directions: SE-NW, SW-NE
Sanchez Crk
Length: 0.01 miles
Direction: SW-NE
Direction: SW-NE