Battaglia neighborhood in San Jose, California (CA), 95131, 95132 detailed profile
Settings
X

Business Search - 14 Million verified businesses
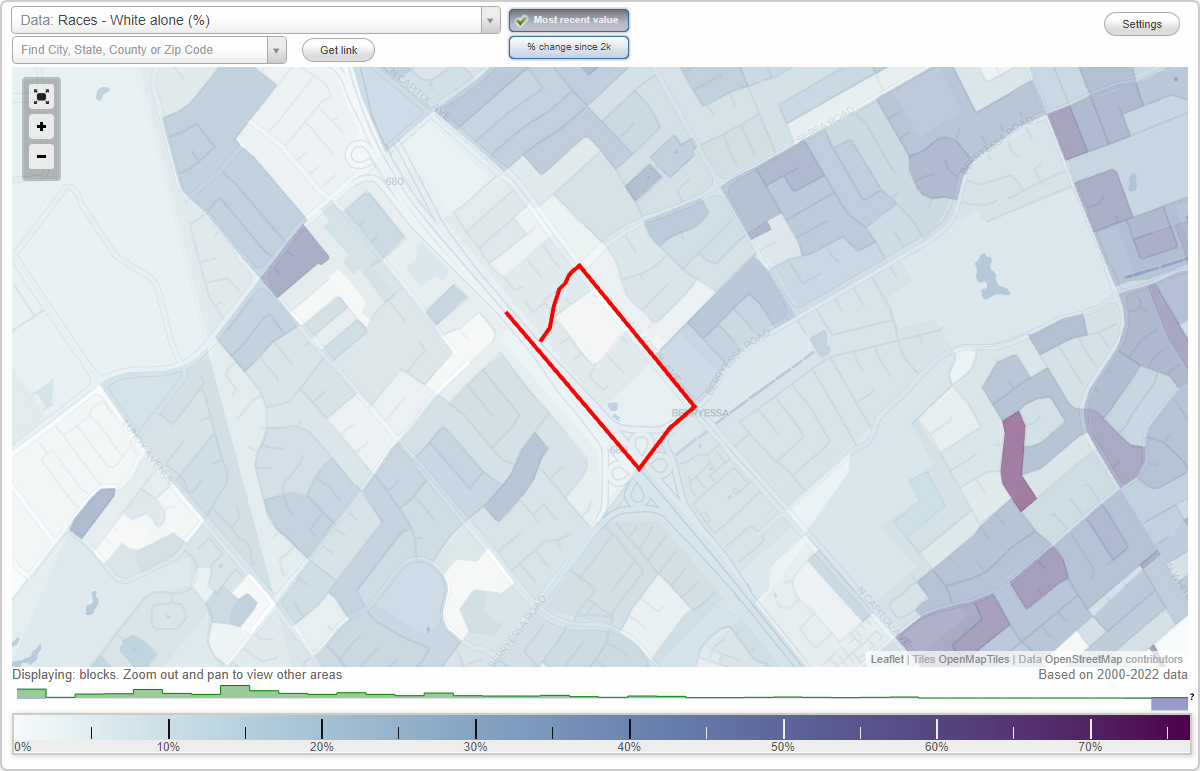
Area: 0.090 square miles
Population: 559
Population density:
| Battaglia: | 6,222 people per square mile |
| San Jose: | 5,554 people per square mile |

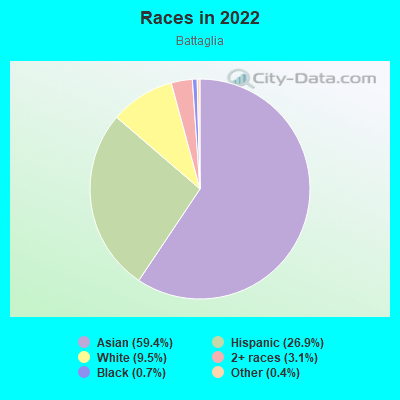
- 33159.4%Asian
- 15026.9%Hispanic or Latino
- 539.5%White
- 173.1%Two or more races
- 40.7%Black
- 20.4%Some other race
Median household income in 2022:
| Battaglia: | $163,370 |
| San Jose: | $133,835 |
Distribution of median household income
![Distribution of median household income]()
- 9Less than $10,000
- 28$10,000 to $19,999
- 2$20,000 to $29,999
- 10$30,000 to $39,999
- 8$40,000 to $49,999
- 8$50,000 to $59,999
- 17$60,000 to $74,999
- 15$75,000 to $99,999
- 10$100,000 to $124,999
- 14$125,000 to $149,999
- 37$150,000 to $199,999
- 47$200,000 or more

Distribution of owner-occupied house/condo value
![Distribution of owner-occupied house/condo value]()
- 3Less than $50,000
- 1$50,000 to $99,999
- 2$400,000 to $499,999
- 9$500,000 to $749,999
- 26$750,000 to $999,999
- 28$1,000,000 or more

Distribution of rent paid by renters
![Distribution of rent paid by renters]()
- 4$500 to $599
- 1$1,250 to $1,499
- 24$1,500 to $1,999
- 82$2,000 or more

Median rent in 2022:
| Battaglia: | $2,486 |
| San Jose: | $2,001 |
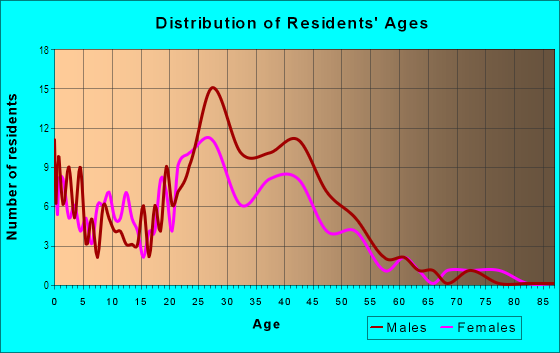
| Males: | 314 |
| Females: | 245 |
Males:
| This neighborhood: | 34.6 years |
| Whole city: | 37.6 years |
| This neighborhood: | 38.5 years |
| Whole city: | 39.1 years |
Average household size:
| Battaglia: | 18.2 people |
| San Jose: | 2.9 people |
Percentage of family households:
| Battaglia: | 63.3% |
| San Jose: | 49.9% |
| Here: | 71.7% |
| San Jose: | 53.0% |
Percentage of married-couple families with children (among all households):
| Battaglia: | 26.1% |
| San Jose: | 25.8% |
Percentage of single-mother households (among all households):
| Battaglia: | 0.2% |
| San Jose: | 5.2% |
Percentage of never married males 15 years old and over:
Percentage of never married females 15 years old and over:
| Battaglia: | 25.0% |
| San Jose: | 20.9% |
Percentage of never married females 15 years old and over:
| Battaglia: | 16.5% |
| city: | 16.7% |
Percentage of people that speak English not well or not at all:
| Battaglia: | 18.8% |
| San Jose: | 11.4% |
Percentage of people born in this state:
Percentage of people born in another U.S. state:
Percentage of native residents but born outside the U.S.:
Percentage of foreign born residents:
| Here: | 40.2% |
| San Jose: | 46.1% |
Percentage of people born in another U.S. state:
| Battaglia: | 3.2% |
| San Jose: | 10.4% |
Percentage of native residents but born outside the U.S.:
| Here: | 2.4% |
| city: | 1.7% |
Percentage of foreign born residents:
| Here: | 54.2% |
| San Jose: | 41.8% |
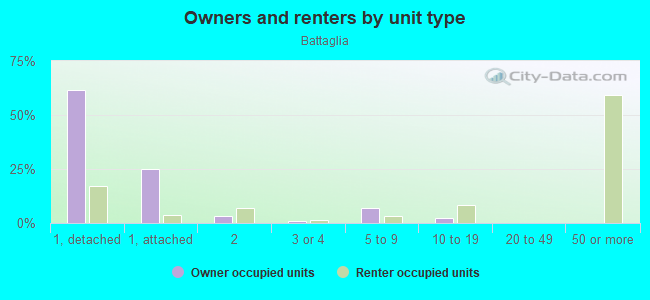
Owner-occupied
Renter-occupied

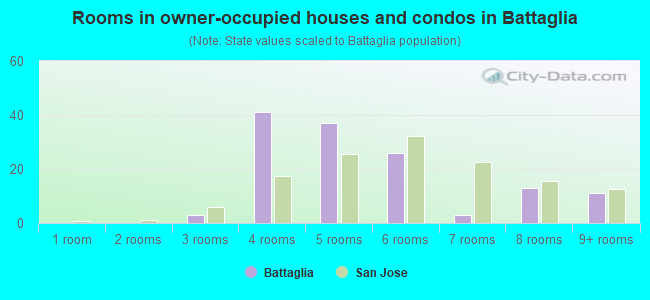
- Rooms in owner-occupied houses and condos in Battaglia
- 01 room
- 02 rooms
- 33 rooms
- 414 rooms
- 375 rooms
- 266 rooms
- 37 rooms
- 138 rooms
- 119+ rooms
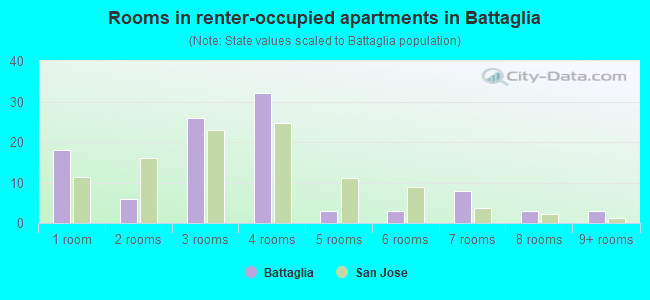
- Rooms in renter-occupied apartments in Battaglia
- 181 room
- 62 rooms
- 263 rooms
- 324 rooms
- 35 rooms
- 36 rooms
- 87 rooms
- 38 rooms
- 39+ rooms
Owner-occupied
Renter-occupied
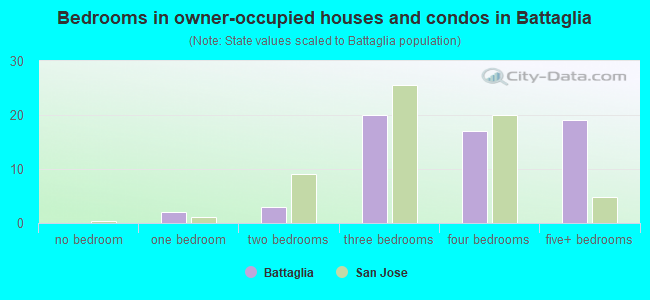
- Bedrooms in owner-occupied houses and condos in Battaglia
- 0no bedroom
- 21 bedroom
- 32 bedrooms
- 203 bedrooms
- 174 bedrooms
- 195+ bedrooms
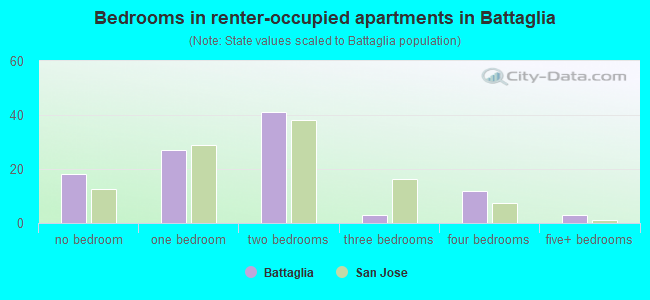
- Bedrooms in renter-occupied apartments in Battaglia
- 18no bedroom
- 271 bedroom
- 412 bedrooms
- 33 bedrooms
- 124 bedrooms
- 35+ bedrooms
Average number of cars or other vehicles available in houses/condos:
Average number of cars or other vehicles available in apartments:
| This neighborhood: | 2.4 |
| San Jose: | 2.3 |
Average number of cars or other vehicles available in apartments:
| Here: | 2.6 |
| city: | 1.6 |
Percentage of units with a mortgage:
| Battaglia: | 36.2% |
| San Jose: | 66.9% |
Average estimated value of detached houses in 2022 (42.6% of all units):
| Battaglia: | $1,066,814 |
| San Jose: | $1,532,815 |
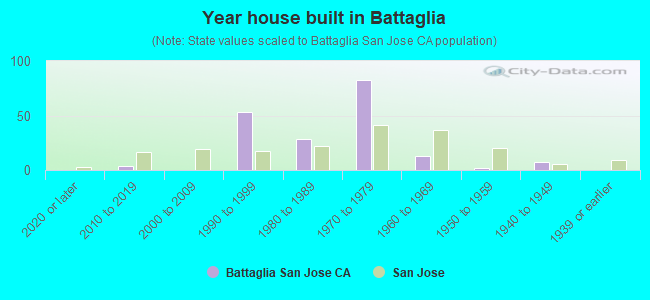
- Year house built in Battaglia
- 02020 or later
- 42010 to 2019
- 02000 to 2009
- 531990 to 1999
- 281980 to 1989
- 831970 to 1979
- 131960 to 1969
- 21950 to 1959
- 71940 to 1949
- 01939 or earlier
City-data.com crime index for city in 2020 (higher means more crime):
| City: | 268.4 |
| U.S. average: | 219.5 |
Travel time to work (commute)
![Travel time to work (commute)]()
- 4Less than 5 minutes
- 75 to 9 minutes
- 3610 to 14 minutes
- 3115 to 19 minutes
- 6120 to 24 minutes
- 2225 to 29 minutes
- 5130 to 34 minutes
- 835 to 39 minutes
- 240 to 44 minutes
- 1845 to 59 minutes
- 1960 to 89 minutes
- 990 or more minutes

Means of transportation to work
![Means of transportation to work]()
- 60.7%199Drove a car alone
- 13.1%43Carpooled
- 7.6%25Bus
- 4.9%16Light rail, streetcar or trolley
- 10.4%34Motorcycle
- 1.5%5Other means
- 12.8%42Worked at home

Time leaving home to go to work
![Time leaving home to go to work]()
- 1512:00 a.m. to 4:59 a.m.
- 135:00 a.m. to 5:29 a.m.
- 105:30 a.m. to 5:59 a.m.
- 186:00 a.m. to 6:29 a.m.
- 226:30 a.m. to 6:59 a.m.
- 257:00 a.m. to 7:29 a.m.
- 117:30 a.m. to 7:59 a.m.
- 458:00 a.m. to 8:29 a.m.
- 248:30 a.m. to 8:59 a.m.
- 389:00 a.m. to 9:59 a.m.
- 1210:00 a.m. to 10:59 a.m.
- 711:00 a.m. to 11:59 a.m.
- 2312:00 p.m. to 3:59 p.m.
- 94:00 p.m. to 11:59 p.m.

Occupations of males:
- Percentage of males in management occupations (except farmers):
Here: 4.5% city: 13.0%
- Percentage of males in business and financial operations occupations:
Here: 2.2% city: 4.6%
- Percentage of males in computer and mathematical occupations:
Here: 5.9% city: 13.6%
- Percentage of males in architecture and engineering occupations:
Here: 10.8% city: 10.2%
- Percentage of males in education, training, and library occupations:
Here: 1.8% city: 2.8%
- Percentage of males in arts, design, entertainment, sports, and media occupations:
Here: 1.8% city: 1.8%
- Percentage of males in healthcare practitioners and technical occupations:
Here: 2.0% city: 2.0%
- Percentage of males in service occupations:
Here: 10.6% city: 12.7%
- Percentage of males in sales and office occupations:
Here: 16.5% city: 12.8%
- Percentage of males in construction, extraction, and maintenance occupations:
Here: 12.9% city: 7.8%
- Percentage of males in production occupations:
Here: 16.6% city: 5.5%
- Percentage of males in transportation occupations:
Here: 9.1% city: 3.6%
- Percentage of males in material moving occupations:
Here: 5.1% city: 3.1%
Occupations of females:
- Percentage of females in management occupations (except farmers):
Here: 9.4% city: 11.0%
- Percentage of females in business and financial operations occupations:
Here: 14.0% city: 8.6%
- Percentage of females in computer and mathematical occupations:
Here: 4.7% city: 5.4%
- Percentage of females in architecture and engineering occupations:
Here: 2.1% city: 2.8%
- Percentage of females in community and social services occupations:
Here: 2.0% city: 1.8%
- Percentage of females in education, training, and library occupations:
Here: 1.1% city: 8.1%
- Percentage of females in arts, design, entertainment, sports, and media occupations:
Here: 2.0% city: 2.0%
- Percentage of females in healthcare practitioners and technical occupations:
Here: 7.0% city: 6.8%
- Percentage of females in service occupations:
Here: 18.8% city: 21.7%
- Percentage of females in sales and office occupations:
Here: 22.9% city: 22.0%
- Percentage of females in production occupations:
Here: 11.3% city: 4.0%
- Percentage of females in material moving occupations:
Here: 5.6% city: 1.5%
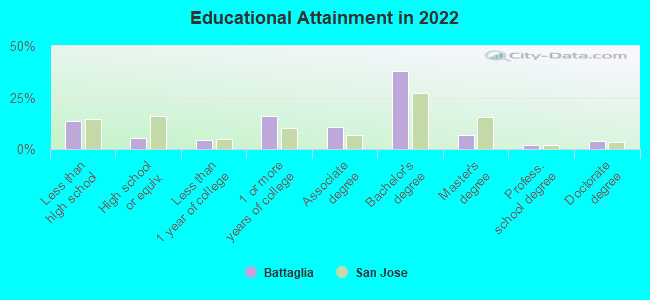
Education in this neighborhood (subdivision or community):
- Percentage of people 3 years and older in K-12 schools:
Battaglia: 23.1% San Jose: 16.1%
- Percentage of people 3 years and older in undergraduate colleges:
Battaglia: 2.8% San Jose: 6.5%
- Percentage of people 3 years and older in grad. or professional schools:
Battaglia: 0.4% San Jose: 2.0%
- Percentage of students K-12 enrolled in private schools:
Battaglia: 8.7% San Jose: 14.9%
Percentage of population below poverty level:
| Battaglia: | 5.9% |
| San Jose: | 9.0% |
Median year owner moved in (as recorded in 2022):
Median year renter moved in (as recorded in 2022):
| Battaglia: | 2004 |
| San Jose: | 2008 |
Median year renter moved in (as recorded in 2022):
| Battaglia: | 2018 |
| San Jose: | 2020 |
Percentage of married-couple families with both working:
| Battaglia: | 90.0% |
| San Jose: | 72.5% |
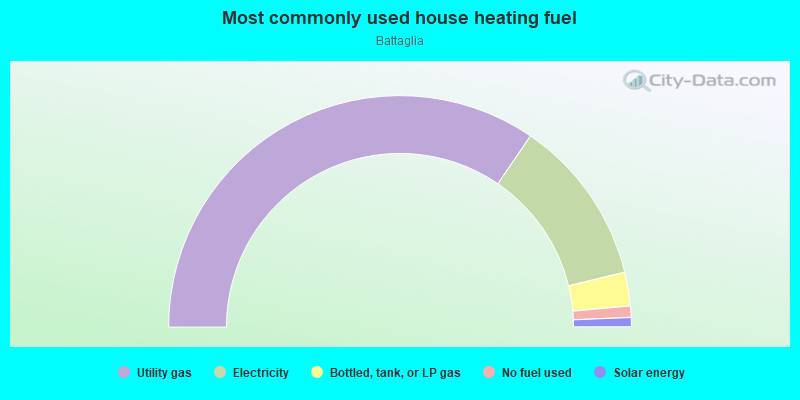
- 69.1%Utility gas
- 23.3%Electricity
- 4.7%Bottled, tank, or LP gas
- 1.6%No fuel used
- 1.3%Solar energy
Roads and streets:
N Capitol Ave
Length: 0.47 miles
Direction: SE-NW
Address range: 1141 to 1365
Direction: SE-NW
Address range: 1141 to 1365
Battaglia Cir
Length: 0.45 miles
Directions: E-W, SE-NW, SW-NE
Address range: 2400 to 2499
Directions: E-W, SE-NW, SW-NE
Address range: 2400 to 2499
Berryessa Rd
Length: 0.16 miles
Direction: SW-NE
Address range: 2400 to 2499
Direction: SW-NE
Address range: 2400 to 2499
Old Abbey Pl
Length: 0.11 miles
Directions: E-W, SE-NW, SW-NE
Address range: 1300 to 1399
Directions: E-W, SE-NW, SW-NE
Address range: 1300 to 1399
Old Manor Pl
Length: 0.09 miles
Directions: E-W, N-S, SE-NW, SW-NE
Address range: 1100 to 1299
Directions: E-W, N-S, SE-NW, SW-NE
Address range: 1100 to 1299
Old Forge Ln
Length: 0.07 miles
Direction: SE-NW
Address range: 1200 to 1299
Direction: SE-NW
Address range: 1200 to 1299
Niemeyer Ct
Length: 0.05 miles
Directions: SE-NW, SW-NE
Address range: 2300 to 2399
Directions: SE-NW, SW-NE
Address range: 2300 to 2399
Old Crest Pl
Length: 0.04 miles
Direction: SW-NE
Address range: 2400 to 2499
Direction: SW-NE
Address range: 2400 to 2499
Old Ridge Ct
Length: 0.03 miles
Direction: SW-NE
Address range: 2400 to 2499
Direction: SW-NE
Address range: 2400 to 2499
Old Elm Ct
Length: 0.03 miles
Direction: SW-NE
Address range: 2400 to 2499
Direction: SW-NE
Address range: 2400 to 2499
Old Gate Ct
Length: 0.02 miles
Direction: SE-NW
Address range: 2400 to 2499
Direction: SE-NW
Address range: 2400 to 2499