Baton Rouge neighborhood in San Jose, California (CA), 95133 detailed profile
Settings
X


Business Search - 14 Million verified businesses
Area: 0.081 square miles
Population: 455
Population density:
| Baton Rouge: | 5,650 people per square mile |
| San Jose: | 5,554 people per square mile |

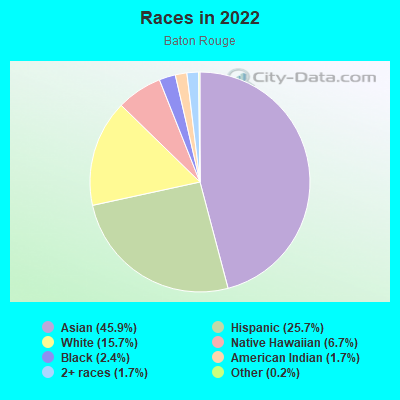
- 21145.9%Asian
- 11825.7%Hispanic or Latino
- 7215.7%White
- 316.7%Native Hawaiian and Other
Pacific Islander - 112.4%Black
- 81.7%American Indian
- 81.7%Two or more races
- 10.2%Some other race

Median household income in 2022:
| Baton Rouge: | $142,878 |
| San Jose: | $133,835 |
Distribution of median household income
![Distribution of median household income]()
- 8Less than $10,000
- 1$10,000 to $19,999
- 19$20,000 to $29,999
- 3$30,000 to $39,999
- 3$40,000 to $49,999
- 3$50,000 to $59,999
- 5$60,000 to $74,999
- 6$75,000 to $99,999
- 18$100,000 to $124,999
- 22$125,000 to $149,999
- 18$150,000 to $199,999
- 34$200,000 or more

Distribution of owner-occupied house/condo value
![Distribution of owner-occupied house/condo value]()
- 3Less than $50,000
- 2$50,000 to $99,999
- 4$150,000 to $199,999
- 3$200,000 to $249,999
- 5$250,000 to $299,999
- 4$300,000 to $399,999
- 4$400,000 to $499,999
- 4$500,000 to $749,999
- 29$750,000 to $999,999
- 59$1,000,000 or more

Distribution of rent paid by renters
![Distribution of rent paid by renters]()
- 1$700 to $799
- 2$900 to $999
- 9$1,000 to $1,249
- 10$1,250 to $1,499
- 2$1,500 to $1,999
- 97$2,000 or more

Median rent in 2022:
| Baton Rouge: | $3,356 |
| San Jose: | $2,001 |
| Males: | 251 |
| Females: | 203 |
Males:
| This neighborhood: | 36.2 years |
| Whole city: | 37.6 years |
| This neighborhood: | 37.1 years |
| Whole city: | 39.1 years |
Average household size:
| Baton Rouge: | 4.1 people |
| San Jose: | 2.9 people |
Percentage of family households:
| Baton Rouge: | 42.9% |
| San Jose: | 49.9% |
| Here: | 53.5% |
| San Jose: | 53.0% |
Percentage of married-couple families with children (among all households):
| Baton Rouge: | 23.9% |
| San Jose: | 25.8% |
Percentage of single-mother households (among all households):
| Baton Rouge: | 5.0% |
| San Jose: | 5.2% |
Percentage of never married males 15 years old and over:
Percentage of never married females 15 years old and over:
| Baton Rouge: | 25.4% |
| San Jose: | 20.9% |
Percentage of never married females 15 years old and over:
| Baton Rouge: | 17.4% |
| city: | 16.7% |
Percentage of people that speak English not well or not at all:
| Baton Rouge: | 11.1% |
| San Jose: | 11.4% |
Percentage of people born in this state:
Percentage of people born in another U.S. state:
Percentage of native residents but born outside the U.S.:
Percentage of foreign born residents:
| Here: | 34.7% |
| San Jose: | 46.1% |
Percentage of people born in another U.S. state:
| Baton Rouge: | 7.9% |
| San Jose: | 10.4% |
Percentage of native residents but born outside the U.S.:
| Here: | 3.3% |
| city: | 1.7% |
Percentage of foreign born residents:
| Here: | 54.1% |
| San Jose: | 41.8% |
Owner-occupied
Renter-occupied

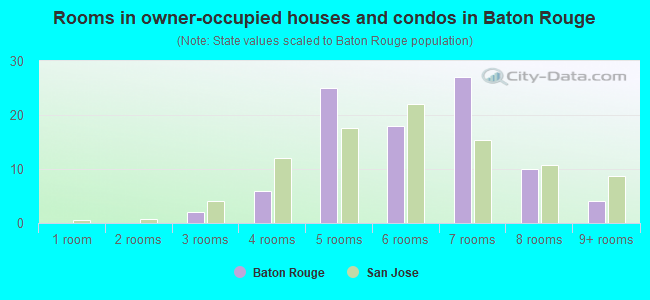
- Rooms in owner-occupied houses and condos in Baton Rouge
- 01 room
- 02 rooms
- 23 rooms
- 64 rooms
- 255 rooms
- 186 rooms
- 277 rooms
- 108 rooms
- 49+ rooms
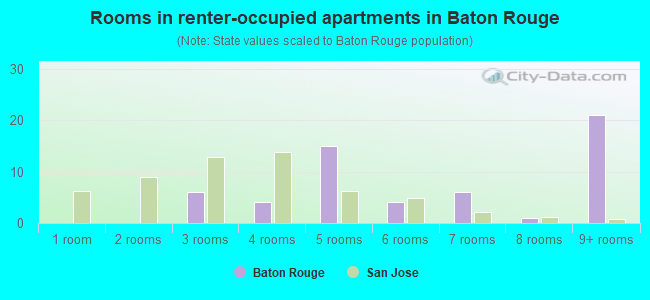
- Rooms in renter-occupied apartments in Baton Rouge
- 01 room
- 02 rooms
- 63 rooms
- 44 rooms
- 155 rooms
- 46 rooms
- 67 rooms
- 18 rooms
- 219+ rooms
Owner-occupied
Renter-occupied
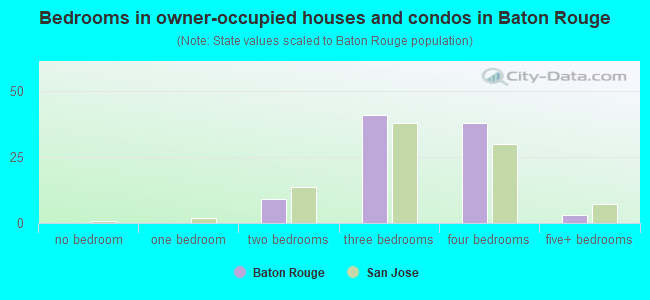
- Bedrooms in owner-occupied houses and condos in Baton Rouge
- 0no bedroom
- 01 bedroom
- 92 bedrooms
- 413 bedrooms
- 384 bedrooms
- 35+ bedrooms
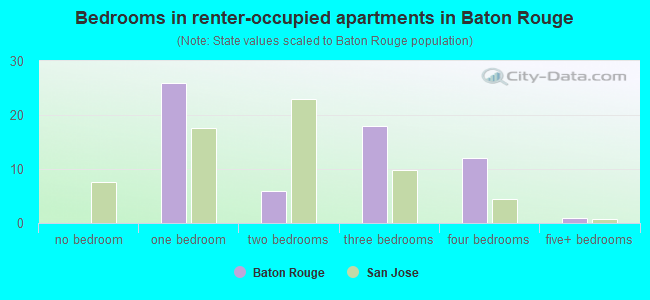
- Bedrooms in renter-occupied apartments in Baton Rouge
- 0no bedroom
- 261 bedroom
- 62 bedrooms
- 183 bedrooms
- 124 bedrooms
- 15+ bedrooms
Average number of cars or other vehicles available in houses/condos:
Average number of cars or other vehicles available in apartments:
| This neighborhood: | 2.4 |
| San Jose: | 2.3 |
Average number of cars or other vehicles available in apartments:
| Here: | 2.4 |
| city: | 1.6 |
Percentage of units with a mortgage:
| Baton Rouge: | 60.1% |
| San Jose: | 66.9% |
Average estimated value of detached houses in 2022 (90.4% of all units):
| Baton Rouge: | $916,798 |
| San Jose: | $1,532,815 |
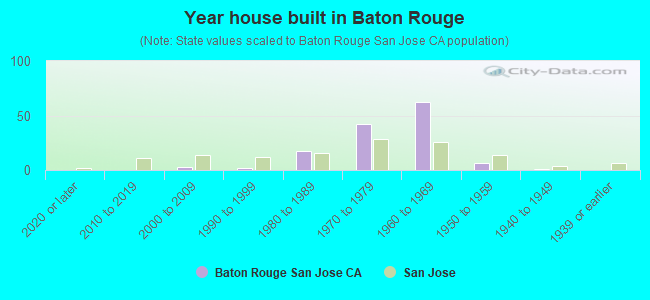
- Year house built in Baton Rouge
- 02020 or later
- 02010 to 2019
- 32000 to 2009
- 21990 to 1999
- 171980 to 1989
- 421970 to 1979
- 621960 to 1969
- 61950 to 1959
- 11940 to 1949
- 01939 or earlier

City-data.com crime index for city in 2020 (higher means more crime):
| City: | 268.4 |
| U.S. average: | 219.5 |
Travel time to work (commute)
![Travel time to work (commute)]()
- 1Less than 5 minutes
- 25 to 9 minutes
- 1110 to 14 minutes
- 2215 to 19 minutes
- 3320 to 24 minutes
- 1125 to 29 minutes
- 5430 to 34 minutes
- 135 to 39 minutes
- 440 to 44 minutes
- 1245 to 59 minutes
- 360 to 89 minutes

Means of transportation to work
![Means of transportation to work]()
- 63.3%130Drove a car alone
- 18.0%37Carpooled
- 14.6%30Bus
- 1.9%4Subway or elevated rail
- 1.0%2Taxi
- 7.8%16Walked
- 1.0%2Other means
- 14.1%29Worked at home

Time leaving home to go to work
![Time leaving home to go to work]()
- 912:00 a.m. to 4:59 a.m.
- 35:00 a.m. to 5:29 a.m.
- 65:30 a.m. to 5:59 a.m.
- 126:00 a.m. to 6:29 a.m.
- 126:30 a.m. to 6:59 a.m.
- 267:00 a.m. to 7:29 a.m.
- 107:30 a.m. to 7:59 a.m.
- 208:00 a.m. to 8:29 a.m.
- 118:30 a.m. to 8:59 a.m.
- 179:00 a.m. to 9:59 a.m.
- 510:00 a.m. to 10:59 a.m.
- 211:00 a.m. to 11:59 a.m.
- 1912:00 p.m. to 3:59 p.m.
- 34:00 p.m. to 11:59 p.m.

Occupations of males:
- Percentage of males in management occupations (except farmers):
Here: 7.1% city: 13.0%
- Percentage of males in business and financial operations occupations:
Here: 1.3% city: 4.6%
- Percentage of males in computer and mathematical occupations:
Here: 13.2% city: 13.6%
- Percentage of males in architecture and engineering occupations:
Here: 21.6% city: 10.2%
- Percentage of males in education, training, and library occupations:
Here: 1.3% city: 2.8%
- Percentage of males in arts, design, entertainment, sports, and media occupations:
Here: 2.8% city: 1.8%
- Percentage of males in healthcare practitioners and technical occupations:
Here: 3.1% city: 2.0%
- Percentage of males in service occupations:
Here: 14.5% city: 12.7%
- Percentage of males in sales and office occupations:
Here: 3.5% city: 12.8%
- Percentage of males in construction, extraction, and maintenance occupations:
Here: 15.4% city: 7.8%
- Percentage of males in production occupations:
Here: 6.1% city: 5.5%
- Percentage of males in transportation occupations:
Here: 2.5% city: 3.6%
Occupations of females:
- Percentage of females in management occupations (except farmers):
Here: 4.9% city: 11.0%
- Percentage of females in business and financial operations occupations:
Here: 10.3% city: 8.6%
- Percentage of females in computer and mathematical occupations:
Here: 9.4% city: 5.4%
- Percentage of females in life, physical, and social science occupations:
Here: 1.8% city: 1.7%
- Percentage of females in community and social services occupations:
Here: 6.7% city: 1.8%
- Percentage of females in education, training, and library occupations:
Here: 3.9% city: 8.1%
- Percentage of females in healthcare practitioners and technical occupations:
Here: 1.7% city: 6.8%
- Percentage of females in service occupations:
Here: 42.2% city: 21.7%
- Percentage of females in sales and office occupations:
Here: 13.5% city: 22.0%
- Percentage of females in production occupations:
Here: 3.0% city: 4.0%
- Percentage of females in material moving occupations:
Here: 2.0% city: 1.5%
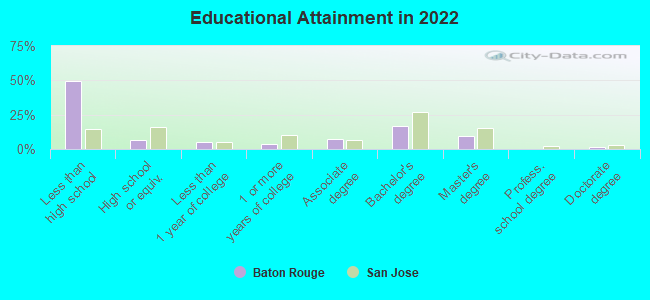
Education in this neighborhood (subdivision or community):
- Percentage of people 3 years and older in K-12 schools:
Baton Rouge: 15.2% San Jose: 16.1%
- Percentage of people 3 years and older in undergraduate colleges:
Baton Rouge: 6.1% San Jose: 6.5%
- Percentage of people 3 years and older in grad. or professional schools:
Baton Rouge: 0.9% San Jose: 2.0%
- Percentage of students K-12 enrolled in private schools:
Baton Rouge: 50.7% San Jose: 14.9%
Percentage of population below poverty level:
| Baton Rouge: | 7.7% |
| San Jose: | 9.0% |
Median year owner moved in (as recorded in 2022):
Median year renter moved in (as recorded in 2022):
| Baton Rouge: | 2003 |
| San Jose: | 2008 |
Median year renter moved in (as recorded in 2022):
| Baton Rouge: | 2017 |
| San Jose: | 2020 |
Percentage of married-couple families with both working:
| Baton Rouge: | 54.0% |
| San Jose: | 72.5% |
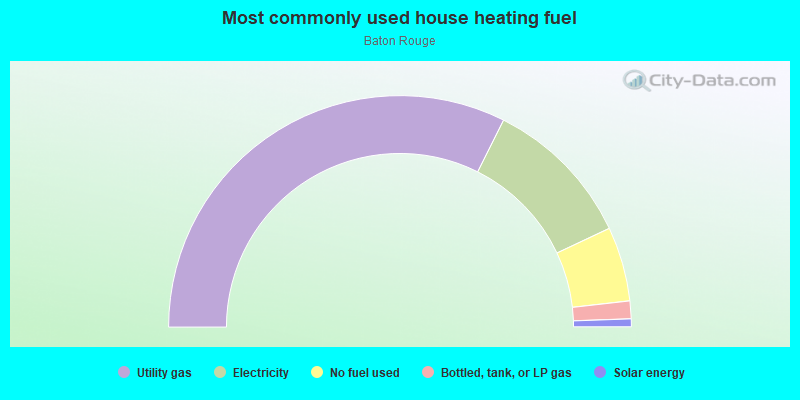
- 64.8%Utility gas
- 21.2%Electricity
- 10.4%No fuel used
- 2.5%Bottled, tank, or LP gas
- 1.1%Solar energy
Roads and streets:
Rainview Dr
Length: 0.30 miles
Directions: E-W, N-S, SE-NW, SW-NE
Address range: 2700 to 2898
Directions: E-W, N-S, SE-NW, SW-NE
Address range: 2700 to 2898
Rainwell Dr
Length: 0.30 miles
Directions: E-W, N-S, SE-NW, SW-NE
Address range: 400 to 599
Directions: E-W, N-S, SE-NW, SW-NE
Address range: 400 to 599
Rough and Ready Rd
Length: 0.28 miles
Direction: SE-NW
Address range: 550 to 673
Direction: SE-NW
Address range: 550 to 673
Grandview Dr
Length: 0.25 miles
Directions: E-W, SW-NE
Address range: 2658 to 2799
Directions: E-W, SW-NE
Address range: 2658 to 2799
Rainfield Dr
Length: 0.23 miles
Directions: E-W, SW-NE
Address range: 2701 to 2798
Directions: E-W, SW-NE
Address range: 2701 to 2798
Baton Rouge Dr
Length: 0.17 miles
Direction: SW-NE
Address range: 2652 to 2749
Direction: SW-NE
Address range: 2652 to 2749
Rainwell Ct
Length: 0.07 miles
Directions: E-W, N-S, SW-NE
Address range: 2700 to 2799
Directions: E-W, N-S, SW-NE
Address range: 2700 to 2799
Des Moines Pl
Length: 0.05 miles
Direction: SE-NW
Address range: 600 to 699
Direction: SE-NW
Address range: 600 to 699
Bonaccorso Pl
Length: 0.05 miles
Direction: SE-NW
Address range: 600 to 699
Direction: SE-NW
Address range: 600 to 699
Harrisburg Pl
Length: 0.05 miles
Direction: SE-NW
Address range: 600 to 699
Direction: SE-NW
Address range: 600 to 699