Barre Circle neighborhood in Baltimore, Maryland (MD), 21230, 21201 detailed profile
Settings
X

Business Search - 14 Million verified businesses
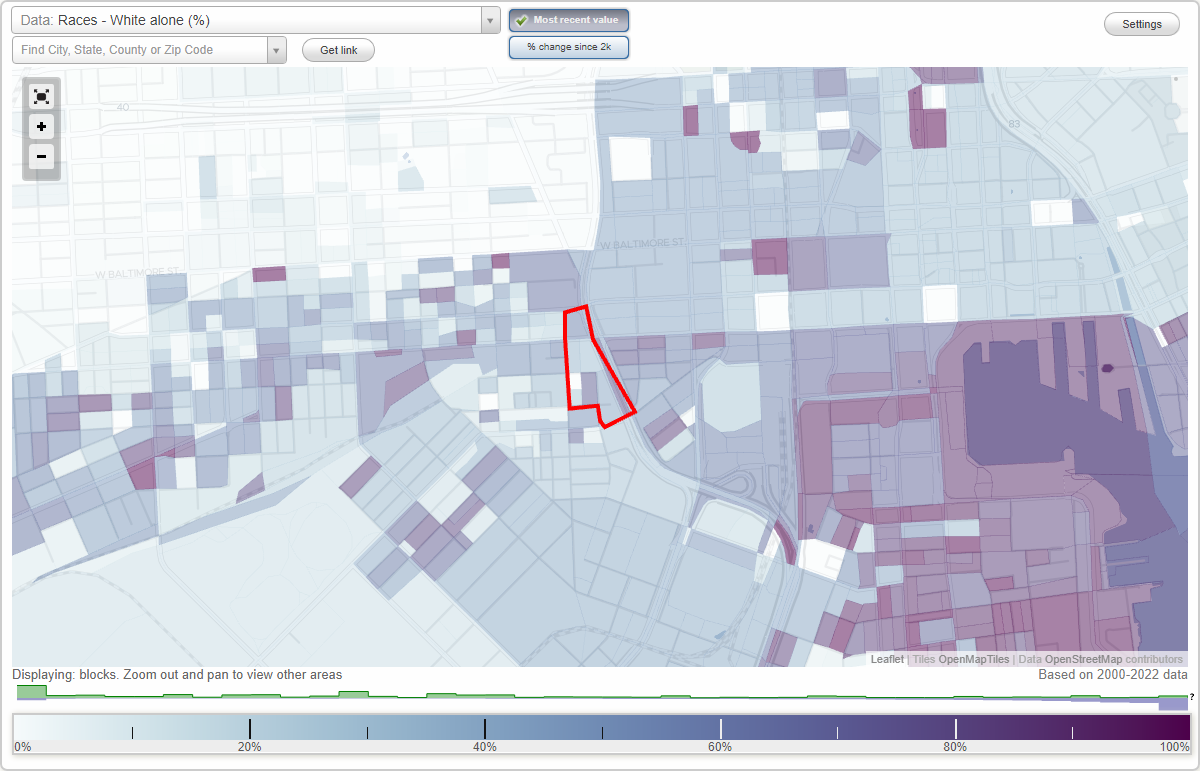
Area: 0.022 square miles
Population: 252
Population density:
| Barre Circle: | 11,209 people per square mile |
| Baltimore: | 7,053 people per square mile |

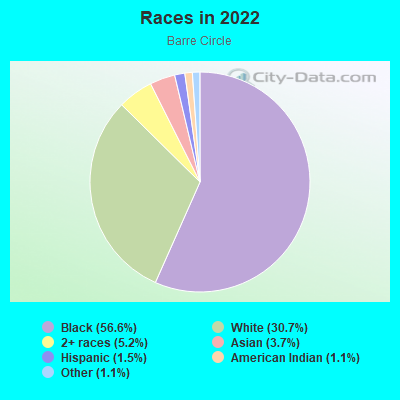
- 15156.6%Black
- 8230.7%White
- 145.2%Two or more races
- 103.7%Asian
- 41.5%Hispanic or Latino
- 31.1%American Indian
- 31.1%Some other race
Distribution of median household income
![Distribution of median household income]()
- 12Less than $10,000
- 24$10,000 to $19,999
- 10$20,000 to $29,999
- 27$30,000 to $39,999
- 24$40,000 to $49,999
- 4$50,000 to $59,999
- 23$60,000 to $74,999
- 26$75,000 to $99,999
- 12$100,000 to $124,999
- 20$125,000 to $149,999
- 6$150,000 to $199,999
- 6$200,000 or more

Distribution of owner-occupied house/condo value
![Distribution of owner-occupied house/condo value]()
- 9Less than $50,000
- 14$50,000 to $99,999
- 14$100,000 to $149,999
- 22$150,000 to $199,999
- 7$200,000 to $249,999
- 17$250,000 to $299,999
- 3$300,000 to $399,999
- 4$400,000 to $499,999
- 12$500,000 to $749,999
- 9$750,000 to $999,999
- 6$1,000,000 or more

Distribution of rent paid by renters
![Distribution of rent paid by renters]()
- 4Less than $100
- 5$100 to $199
- 16$200 to $299
- 3$300 to $399
- 25$400 to $499
- 14$500 to $599
- 32$600 to $699
- 2$700 to $799
- 8$800 to $899
- 14$900 to $999
- 16$1,000 to $1,249
- 30$1,250 to $1,499
- 4$1,500 to $1,999
- 14$2,000 or more

Median rent in 2022:
| Barre Circle: | $1,179 |
| Baltimore: | $1,043 |
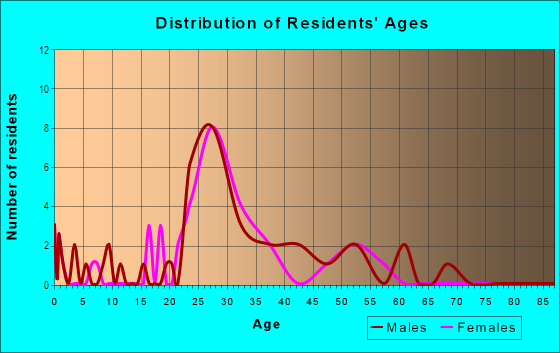
| Males: | 141 |
| Females: | 110 |
Males:
| This neighborhood: | 31.3 years |
| Whole city: | 35.0 years |
| This neighborhood: | 32.7 years |
| Whole city: | 38.2 years |
Average household size:
| Barre Circle: | 2.0 people |
| Baltimore: | 2.2 people |
Percentage of family households:
| Barre Circle: | 26.4% |
| Baltimore: | 34.2% |
| Here: | 15.8% |
| Baltimore: | 23.3% |
Percentage of married-couple families with children (among all households):
| Barre Circle: | 21.0% |
| Baltimore: | 22.4% |
Percentage of single-mother households (among all households):
| Barre Circle: | 204.1% |
| Baltimore: | 18.7% |
Percentage of never married males 15 years old and over:
Percentage of never married females 15 years old and over:
| Barre Circle: | 38.5% |
| Baltimore: | 25.1% |
Percentage of never married females 15 years old and over:
| Barre Circle: | 23.7% |
| city: | 27.5% |
Percentage of people that speak English not well or not at all:
| Barre Circle: | 0.0% |
| Baltimore: | 2.3% |
Percentage of people born in this state:
Percentage of people born in another U.S. state:
Percentage of native residents but born outside the U.S.:
Percentage of foreign born residents:
| Here: | 60.2% |
| Baltimore: | 64.4% |
Percentage of people born in another U.S. state:
| Barre Circle: | 31.7% |
| Baltimore: | 25.0% |
Percentage of native residents but born outside the U.S.:
| Here: | 0.9% |
| city: | 0.9% |
Percentage of foreign born residents:
| Here: | 7.1% |
| Baltimore: | 9.7% |
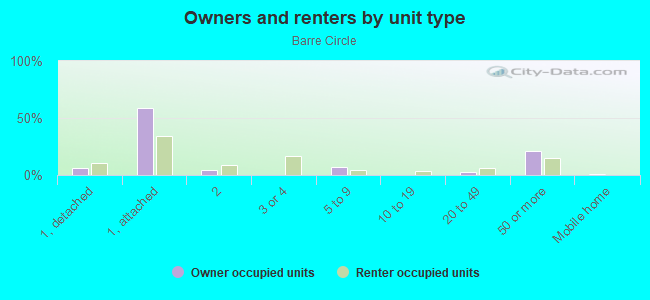
Owner-occupied
Renter-occupied

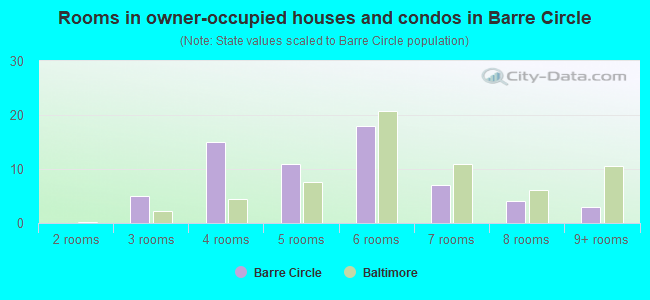
- Rooms in owner-occupied houses and condos in Barre Circle
- 01 room
- 02 rooms
- 53 rooms
- 154 rooms
- 115 rooms
- 186 rooms
- 77 rooms
- 48 rooms
- 39+ rooms
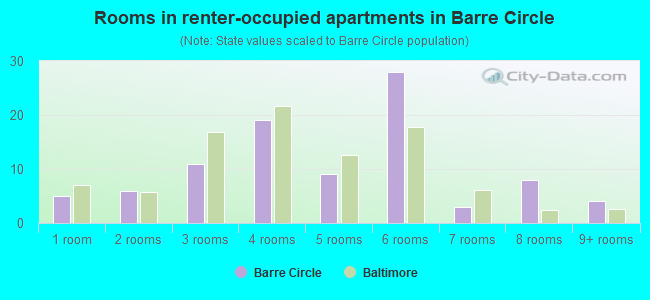
- Rooms in renter-occupied apartments in Barre Circle
- 51 room
- 62 rooms
- 113 rooms
- 194 rooms
- 95 rooms
- 286 rooms
- 37 rooms
- 88 rooms
- 49+ rooms
Owner-occupied
Renter-occupied
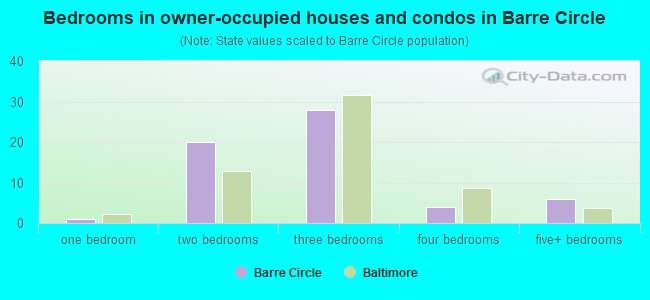
- Bedrooms in owner-occupied houses and condos in Barre Circle
- 0no bedroom
- 11 bedroom
- 202 bedrooms
- 283 bedrooms
- 44 bedrooms
- 65+ bedrooms
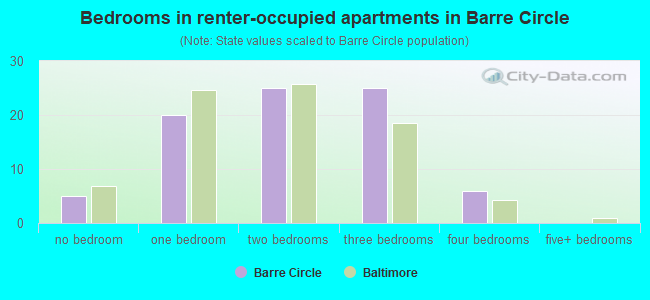
- Bedrooms in renter-occupied apartments in Barre Circle
- 5no bedroom
- 201 bedroom
- 252 bedrooms
- 253 bedrooms
- 64 bedrooms
- 05+ bedrooms
Average number of cars or other vehicles available in houses/condos:
Average number of cars or other vehicles available in apartments:
| This neighborhood: | 1.5 |
| Baltimore: | 1.5 |
Average number of cars or other vehicles available in apartments:
| Here: | 0.8 |
| city: | 0.8 |
Percentage of units with a mortgage:
| Barre Circle: | 91.8% |
| Baltimore: | 64.3% |
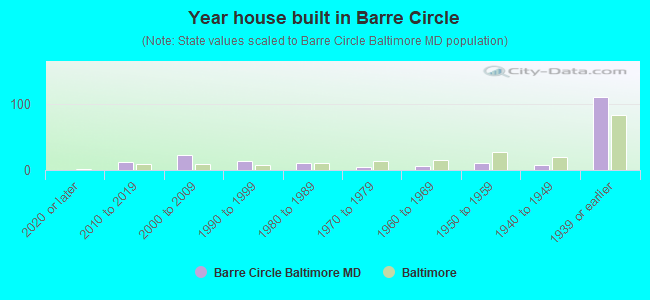
- Year house built in Barre Circle
- 02020 or later
- 122010 to 2019
- 232000 to 2009
- 131990 to 1999
- 101980 to 1989
- 41970 to 1979
- 61960 to 1969
- 111950 to 1959
- 81940 to 1949
- 1101939 or earlier
Travel time to work (commute)
![Travel time to work (commute)]()
- 1Less than 5 minutes
- 85 to 9 minutes
- 2310 to 14 minutes
- 3415 to 19 minutes
- 2320 to 24 minutes
- 925 to 29 minutes
- 2130 to 34 minutes
- 735 to 39 minutes
- 740 to 44 minutes
- 1345 to 59 minutes
- 360 to 89 minutes
- 590 or more minutes

Means of transportation to work
![Means of transportation to work]()
- 68.4%113Drove a car alone
- 1.8%3Carpooled
- 7.9%13Bus
- 1.2%2Subway or elevated rail
- 1.2%2Long-distance train or commuter rail
- 1.8%3Light rail, streetcar or trolley
- 1.2%2Taxi
- 6.1%10Bicycle
- 7.9%13Walked
- 1.2%2Other means
- 7.3%12Worked at home

Time leaving home to go to work
![Time leaving home to go to work]()
- 1912:00 a.m. to 4:59 a.m.
- 55:00 a.m. to 5:29 a.m.
- 75:30 a.m. to 5:59 a.m.
- 56:00 a.m. to 6:29 a.m.
- 136:30 a.m. to 6:59 a.m.
- 197:00 a.m. to 7:29 a.m.
- 167:30 a.m. to 7:59 a.m.
- 298:00 a.m. to 8:29 a.m.
- 168:30 a.m. to 8:59 a.m.
- 189:00 a.m. to 9:59 a.m.
- 611:00 a.m. to 11:59 a.m.
- 412:00 p.m. to 3:59 p.m.
- 104:00 p.m. to 11:59 p.m.

Occupations of males:
- Percentage of males in management occupations (except farmers):
Here: 11.5% city: 10.7%
- Percentage of males in business and financial operations occupations:
Here: 3.7% city: 5.9%
- Percentage of males in computer and mathematical occupations:
Here: 9.9% city: 6.1%
- Percentage of males in life, physical, and social science occupations:
Here: 1.4% city: 2.3%
- Percentage of males in community and social services occupations:
Here: 1.8% city: 1.6%
- Percentage of males in legal occupations:
Here: 6.2% city: 1.8%
- Percentage of males in education, training, and library occupations:
Here: 1.1% city: 5.4%
- Percentage of males in healthcare practitioners and technical occupations:
Here: 6.4% city: 4.0%
- Percentage of males in service occupations:
Here: 17.8% city: 14.7%
- Percentage of males in sales and office occupations:
Here: 23.5% city: 14.2%
- Percentage of males in construction, extraction, and maintenance occupations:
Here: 2.6% city: 5.6%
- Percentage of males in transportation occupations:
Here: 6.2% city: 6.8%
- Percentage of males in material moving occupations:
Here: 5.7% city: 7.0%
Occupations of females:
- Percentage of females in management occupations (except farmers):
Here: 3.0% city: 10.1%
- Percentage of females in business and financial operations occupations:
Here: 10.8% city: 6.6%
- Percentage of females in computer and mathematical occupations:
Here: 1.7% city: 2.4%
- Percentage of females in architecture and engineering occupations:
Here: 1.6% city: 0.9%
- Percentage of females in life, physical, and social science occupations:
Here: 15.7% city: 2.5%
- Percentage of females in education, training, and library occupations:
Here: 13.8% city: 10.7%
- Percentage of females in arts, design, entertainment, sports, and media occupations:
Here: 3.6% city: 2.4%
- Percentage of females in healthcare practitioners and technical occupations:
Here: 3.6% city: 9.8%
- Percentage of females in service occupations:
Here: 17.7% city: 20.4%
- Percentage of females in sales and office occupations:
Here: 31.3% city: 22.3%
- Percentage of females in construction, extraction, and maintenance occupations:
Here: 2.2% city: 0.4%
- Percentage of females in production occupations:
Here: 2.9% city: 2.3%
- Percentage of females in transportation occupations:
Here: 3.7% city: 1.7%
Percentage of people 16-64 in Armed Forces:
| Barre Circle: | 0.3% |
| Baltimore: | 0.4% |
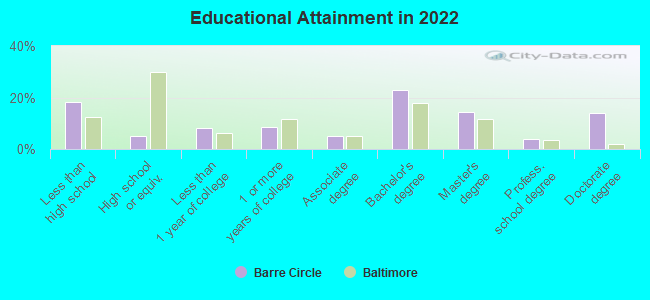
Education in this neighborhood (subdivision or community):
- Percentage of people 3 years and older in K-12 schools:
Barre Circle: 23.4% Baltimore: 14.7%
- Percentage of people 3 years and older in undergraduate colleges:
Barre Circle: 10.5% Baltimore: 6.0%
- Percentage of people 3 years and older in grad. or professional schools:
Barre Circle: 8.1% Baltimore: 2.8%
- Percentage of students K-12 enrolled in private schools:
Barre Circle: 22.4% Baltimore: 12.7%
Percentage of population below poverty level:
| Barre Circle: | 18.1% |
| Baltimore: | 18.5% |
Median year owner moved in (as recorded in 2022):
Median year renter moved in (as recorded in 2022):
| Barre Circle: | 2013 |
| Baltimore: | 2009 |
Median year renter moved in (as recorded in 2022):
| Barre Circle: | 2018 |
| Baltimore: | 2019 |
Percentage of married-couple families with both working:
| Barre Circle: | 98.8% |
| Baltimore: | 79.2% |
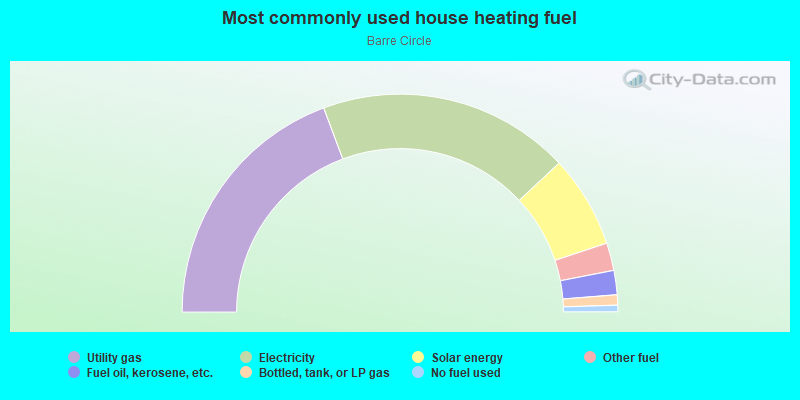
- 38.6%Utility gas
- 37.4%Electricity
- 13.7%Solar energy
- 4.1%Other fuel
- 3.6%Fuel oil, kerosene, etc.
- 1.5%Bottled, tank, or LP gas
- 1.0%No fuel used
Roads and streets:
S Martin Luther King Jr Blvd
Length: 0.25 miles
Direction: SE-NW
Direction: SE-NW
Otterbein St
Length: 0.15 miles
Direction: N-S
Address range: 200 to 399
Direction: N-S
Address range: 200 to 399
W Barre St
Length: 0.08 miles
Direction: N-S
Address range: 1013 to 1099
Direction: N-S
Address range: 1013 to 1099
Ramsay St
Length: 0.08 miles
Direction: E-W
Address range: 735 to 757
Direction: E-W
Address range: 735 to 757
Mc Henry St
Length: 0.06 miles
Direction: E-W
Address range: 700 to 760
Direction: E-W
Address range: 700 to 760
W Pratt St
Length: 0.03 miles
Direction: E-W
Address range: 758 to 766
Direction: E-W
Address range: 758 to 766