Banana Grove neighborhood in San Jose, California (CA), 95123 detailed profile
Settings
X

Business Search - 14 Million verified businesses
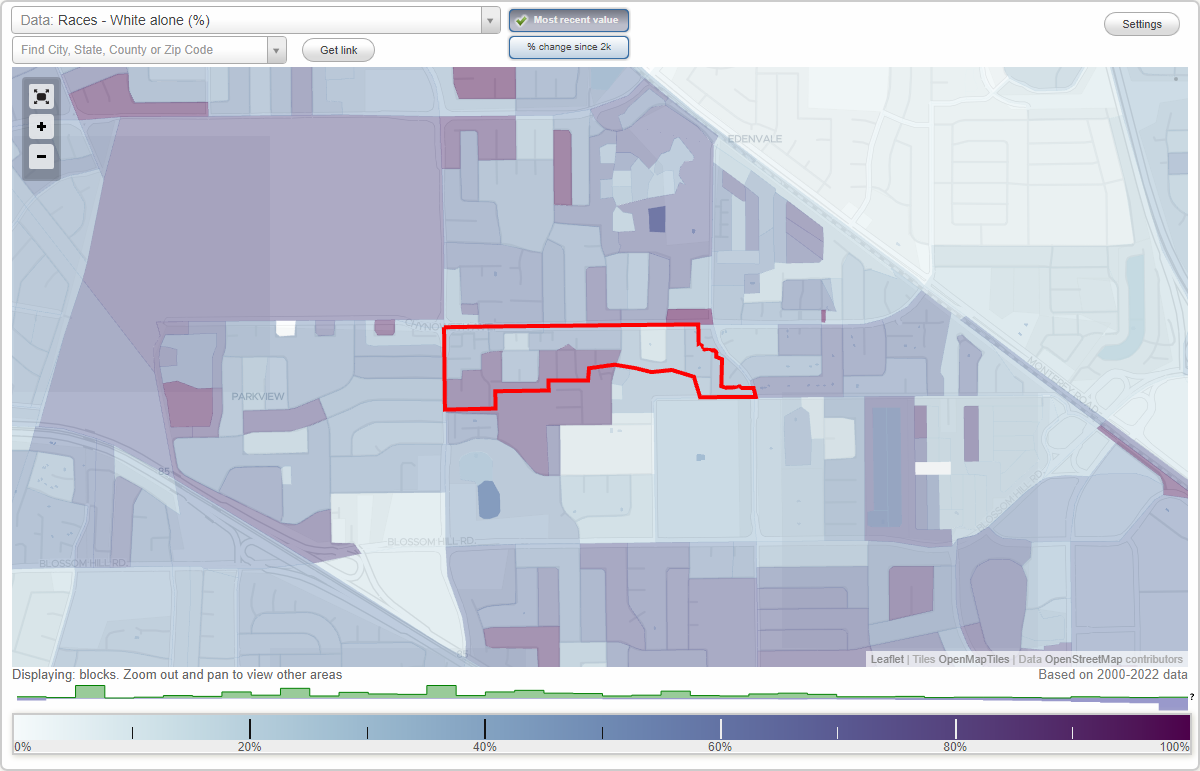
Area: 0.090 square miles
Population: 1,404
Population density:
| Banana Grove: | 15,633 people per square mile |
| San Jose: | 5,554 people per square mile |

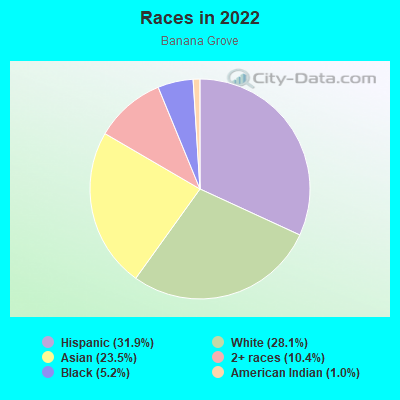
- 45031.9%Hispanic or Latino
- 39628.1%White
- 33123.5%Asian
- 14710.4%Two or more races
- 735.2%Black
- 141.0%American Indian
Median household income in 2022:
| Banana Grove: | $143,591 |
| San Jose: | $133,835 |
Distribution of median household income
![Distribution of median household income]()
- 8Less than $10,000
- 13$10,000 to $19,999
- 41$20,000 to $29,999
- 14$30,000 to $39,999
- 36$40,000 to $49,999
- 40$50,000 to $59,999
- 18$60,000 to $74,999
- 99$75,000 to $99,999
- 26$100,000 to $124,999
- 90$125,000 to $149,999
- 88$150,000 to $199,999
- 82$200,000 or more

Distribution of owner-occupied house/condo value
![Distribution of owner-occupied house/condo value]()
- 17Less than $50,000
- 11$50,000 to $99,999
- 14$100,000 to $149,999
- 6$150,000 to $199,999
- 5$200,000 to $249,999
- 3$250,000 to $299,999
- 7$300,000 to $399,999
- 35$400,000 to $499,999
- 124$500,000 to $749,999
- 64$750,000 to $999,999
- 58$1,000,000 or more

Distribution of rent paid by renters
![Distribution of rent paid by renters]()
- 9$200 to $299
- 30$300 to $399
- 8$500 to $599
- 12$600 to $699
- 7$700 to $799
- 7$800 to $899
- 14$900 to $999
- 17$1,250 to $1,499
- 22$1,500 to $1,999
- 185$2,000 or more

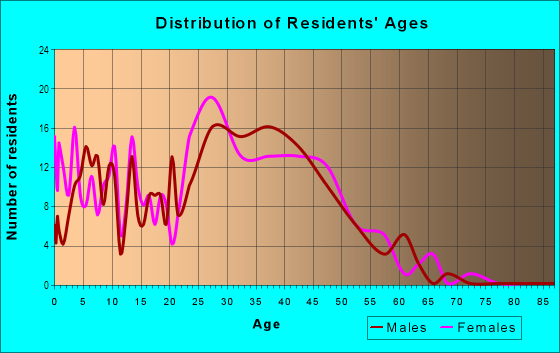
| Males: | 670 |
| Females: | 733 |
Males:
| This neighborhood: | 32.6 years |
| Whole city: | 37.6 years |
| This neighborhood: | 38.8 years |
| Whole city: | 39.1 years |
Average household size:
| Banana Grove: | 3.1 people |
| San Jose: | 2.9 people |
Percentage of family households:
| Banana Grove: | 49.7% |
| San Jose: | 49.9% |
| Here: | 42.9% |
| San Jose: | 53.0% |
Percentage of married-couple families with children (among all households):
| Banana Grove: | 20.5% |
| San Jose: | 25.8% |
Percentage of single-mother households (among all households):
| Banana Grove: | 11.8% |
| San Jose: | 5.2% |
Percentage of never married males 15 years old and over:
Percentage of never married females 15 years old and over:
| Banana Grove: | 21.1% |
| San Jose: | 20.9% |
Percentage of never married females 15 years old and over:
| Banana Grove: | 20.8% |
| city: | 16.7% |
Percentage of people that speak English not well or not at all:
| Banana Grove: | 7.1% |
| San Jose: | 11.4% |
Percentage of people born in this state:
Percentage of people born in another U.S. state:
Percentage of native residents but born outside the U.S.:
Percentage of foreign born residents:
| Here: | 61.7% |
| San Jose: | 46.1% |
Percentage of people born in another U.S. state:
| Banana Grove: | 9.7% |
| San Jose: | 10.4% |
Percentage of native residents but born outside the U.S.:
| Here: | 1.5% |
| city: | 1.7% |
Percentage of foreign born residents:
| Here: | 27.0% |
| San Jose: | 41.8% |
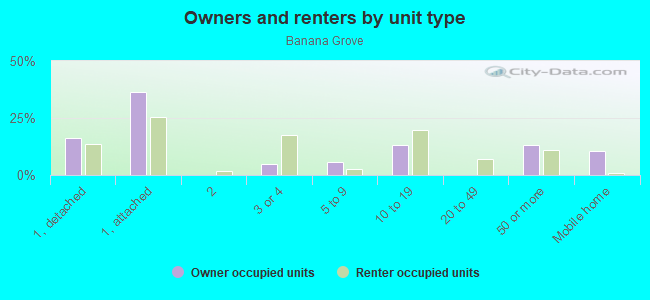
Owner-occupied
Renter-occupied

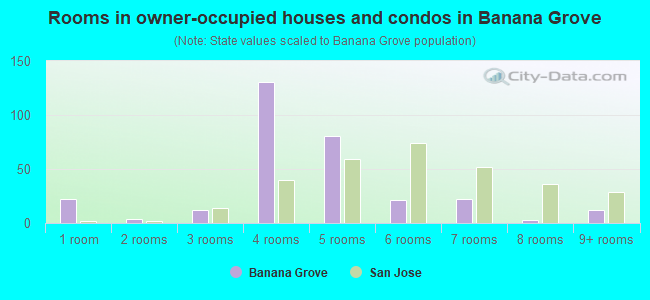
- Rooms in owner-occupied houses and condos in Banana Grove
- 221 room
- 42 rooms
- 123 rooms
- 1314 rooms
- 815 rooms
- 216 rooms
- 227 rooms
- 38 rooms
- 129+ rooms
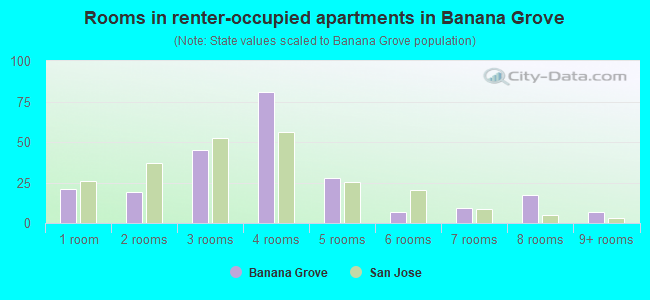
- Rooms in renter-occupied apartments in Banana Grove
- 211 room
- 192 rooms
- 453 rooms
- 814 rooms
- 285 rooms
- 76 rooms
- 97 rooms
- 178 rooms
- 79+ rooms
Owner-occupied
Renter-occupied
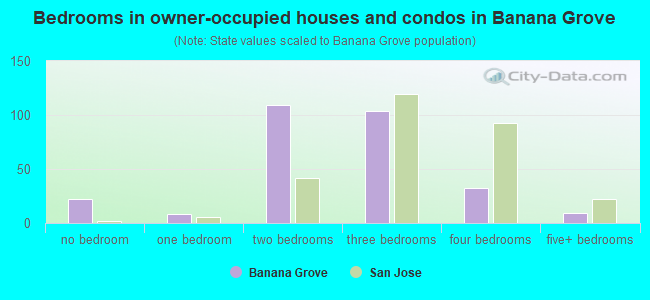
- Bedrooms in owner-occupied houses and condos in Banana Grove
- 22no bedroom
- 81 bedroom
- 1092 bedrooms
- 1043 bedrooms
- 324 bedrooms
- 95+ bedrooms
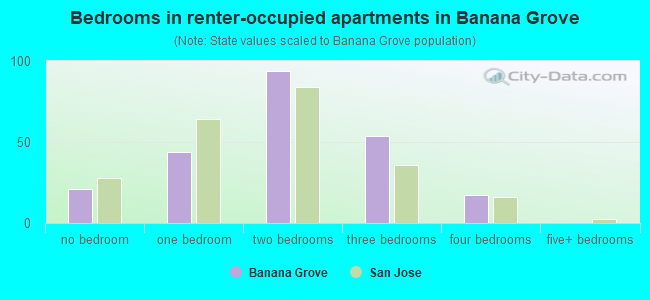
- Bedrooms in renter-occupied apartments in Banana Grove
- 21no bedroom
- 441 bedroom
- 942 bedrooms
- 543 bedrooms
- 174 bedrooms
- 05+ bedrooms
Average number of cars or other vehicles available in houses/condos:
Average number of cars or other vehicles available in apartments:
| This neighborhood: | 1.9 |
| San Jose: | 2.3 |
Average number of cars or other vehicles available in apartments:
| Here: | 2.0 |
| city: | 1.6 |
Percentage of units with a mortgage:
| Banana Grove: | 88.7% |
| San Jose: | 66.9% |
Housing prices:
- Average estimated value of detached houses in 2022 (17.5% of all units):
Banana Grove: $1,126,031 San Jose: $1,532,815
- Average estimated value of townhouses or other attached units in 2022 (41.2% of all units):
This neighborhood: $768,353 city: $1,024,857
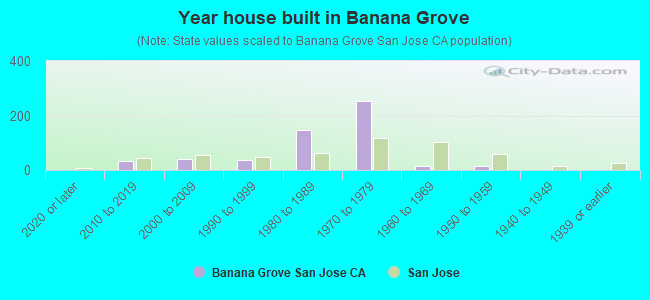
- Year house built in Banana Grove
- 02020 or later
- 322010 to 2019
- 412000 to 2009
- 371990 to 1999
- 1451980 to 1989
- 2521970 to 1979
- 141960 to 1969
- 161950 to 1959
- 01940 to 1949
- 01939 or earlier
City-data.com crime index for city in 2020 (higher means more crime):
| City: | 268.4 |
| U.S. average: | 219.5 |
Travel time to work (commute)
![Travel time to work (commute)]()
- 3Less than 5 minutes
- 245 to 9 minutes
- 10210 to 14 minutes
- 8515 to 19 minutes
- 13520 to 24 minutes
- 4025 to 29 minutes
- 11630 to 34 minutes
- 1635 to 39 minutes
- 5140 to 44 minutes
- 7145 to 59 minutes
- 4660 to 89 minutes
- 790 or more minutes

Means of transportation to work
![Means of transportation to work]()
- 71.7%579Drove a car alone
- 18.3%148Carpooled
- 0.6%5Bus
- 1.2%10Long-distance train or commuter rail
- 0.4%3Light rail, streetcar or trolley
- 0.2%2Taxi
- 0.2%2Motorcycle
- 0.6%5Bicycle
- 0.1%1Walked
- 0.7%6Other means
- 7.3%59Worked at home

Time leaving home to go to work
![Time leaving home to go to work]()
- 3612:00 a.m. to 4:59 a.m.
- 85:00 a.m. to 5:29 a.m.
- 305:30 a.m. to 5:59 a.m.
- 356:00 a.m. to 6:29 a.m.
- 1136:30 a.m. to 6:59 a.m.
- 1277:00 a.m. to 7:29 a.m.
- 887:30 a.m. to 7:59 a.m.
- 738:00 a.m. to 8:29 a.m.
- 368:30 a.m. to 8:59 a.m.
- 479:00 a.m. to 9:59 a.m.
- 2810:00 a.m. to 10:59 a.m.
- 511:00 a.m. to 11:59 a.m.
- 5312:00 p.m. to 3:59 p.m.
- 194:00 p.m. to 11:59 p.m.

Occupations of males:
- Percentage of males in management occupations (except farmers):
Here: 16.6% city: 13.0%
- Percentage of males in business and financial operations occupations:
Here: 8.3% city: 4.6%
- Percentage of males in computer and mathematical occupations:
Here: 8.8% city: 13.6%
- Percentage of males in architecture and engineering occupations:
Here: 6.0% city: 10.2%
- Percentage of males in life, physical, and social science occupations:
Here: 1.4% city: 1.1%
- Percentage of males in community and social services occupations:
Here: 2.7% city: 0.8%
- Percentage of males in education, training, and library occupations:
Here: 3.1% city: 2.8%
- Percentage of males in arts, design, entertainment, sports, and media occupations:
Here: 5.0% city: 1.8%
- Percentage of males in healthcare practitioners and technical occupations:
Here: 1.5% city: 2.0%
- Percentage of males in service occupations:
Here: 12.7% city: 12.7%
- Percentage of males in sales and office occupations:
Here: 18.1% city: 12.8%
- Percentage of males in construction, extraction, and maintenance occupations:
Here: 4.3% city: 7.8%
- Percentage of males in production occupations:
Here: 1.3% city: 5.5%
- Percentage of males in transportation occupations:
Here: 5.1% city: 3.6%
Occupations of females:
- Percentage of females in management occupations (except farmers):
Here: 14.9% city: 11.0%
- Percentage of females in business and financial operations occupations:
Here: 3.7% city: 8.6%
- Percentage of females in computer and mathematical occupations:
Here: 2.3% city: 5.4%
- Percentage of females in architecture and engineering occupations:
Here: 3.2% city: 2.8%
- Percentage of females in community and social services occupations:
Here: 1.3% city: 1.8%
- Percentage of females in legal occupations:
Here: 3.0% city: 1.3%
- Percentage of females in education, training, and library occupations:
Here: 12.4% city: 8.1%
- Percentage of females in healthcare practitioners and technical occupations:
Here: 11.0% city: 6.8%
- Percentage of females in service occupations:
Here: 15.2% city: 21.7%
- Percentage of females in sales and office occupations:
Here: 22.1% city: 22.0%
- Percentage of females in construction, extraction, and maintenance occupations:
Here: 5.2% city: 0.2%
- Percentage of females in production occupations:
Here: 5.0% city: 4.0%
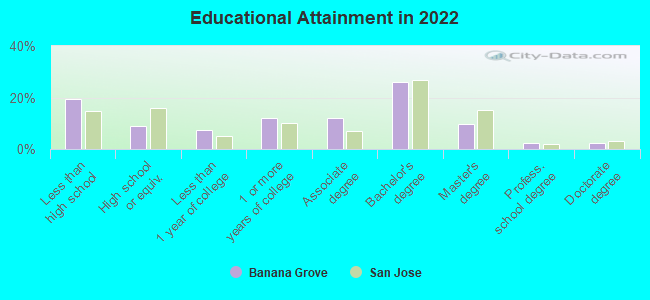
Education in this neighborhood (subdivision or community):
- Percentage of people 3 years and older in K-12 schools:
Banana Grove: 13.6% San Jose: 16.1%
- Percentage of people 3 years and older in undergraduate colleges:
Banana Grove: 4.1% San Jose: 6.5%
- Percentage of people 3 years and older in grad. or professional schools:
Banana Grove: 4.7% San Jose: 2.0%
- Percentage of students K-12 enrolled in private schools:
Banana Grove: 82.3% San Jose: 14.9%
Percentage of population below poverty level:
| Banana Grove: | 2.9% |
| San Jose: | 9.0% |
Median year owner moved in (as recorded in 2022):
Median year renter moved in (as recorded in 2022):
| Banana Grove: | 2007 |
| San Jose: | 2008 |
Median year renter moved in (as recorded in 2022):
| Banana Grove: | 2013 |
| San Jose: | 2020 |
Percentage of married-couple families with both working:
| Banana Grove: | 100.0% |
| San Jose: | 72.5% |
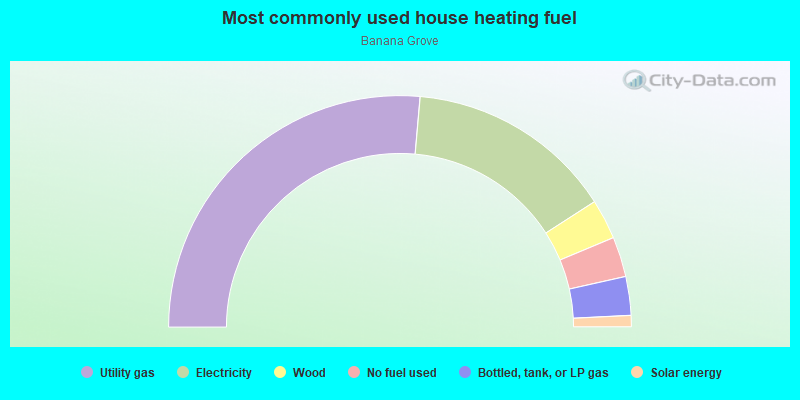
- 52.8%Utility gas
- 29.0%Electricity
- 5.6%Wood
- 5.6%No fuel used
- 5.4%Bottled, tank, or LP gas
- 1.6%Solar energy
Roads and streets:
Banana Grove Ln
Length: 0.42 miles
Directions: E-W, SE-NW
Address range: 100 to 299
Directions: E-W, SE-NW
Address range: 100 to 299
Wong Dr
Length: 0.22 miles
Directions: E-W, N-S, SW-NE
Address range: 5301 to 5365
Directions: E-W, N-S, SW-NE
Address range: 5301 to 5365
Jacana Ln
Length: 0.16 miles
Directions: E-W, N-S, SW-NE
Address range: 5200 to 5299
Directions: E-W, N-S, SW-NE
Address range: 5200 to 5299
Cheris Dr
Length: 0.14 miles
Directions: E-W, SW-NE
Address range: 100 to 299
Directions: E-W, SW-NE
Address range: 100 to 299
Birch Grove Ct
Length: 0.14 miles
Directions: E-W, N-S, SE-NW
Address range: 5324 to 5542
Directions: E-W, N-S, SE-NW
Address range: 5324 to 5542
Larch Grove Ct
Length: 0.11 miles
Direction: N-S
Address range: 5300 to 5399
Direction: N-S
Address range: 5300 to 5399
Beech Grove Ct
Length: 0.09 miles
Directions: N-S, SE-NW
Address range: 5301 to 5398
Directions: N-S, SE-NW
Address range: 5301 to 5398
Wong Ct
Length: 0.09 miles
Directions: N-S, SE-NW
Address range: 5300 to 5399
Directions: N-S, SE-NW
Address range: 5300 to 5399
Hansell Dr
Length: 0.07 miles
Directions: N-S, SW-NE
Address range: 5300 to 5399
Directions: N-S, SW-NE
Address range: 5300 to 5399
Mayten Grove Ct
Length: 0.07 miles
Direction: N-S
Address range: 5300 to 5399
Direction: N-S
Address range: 5300 to 5399
Dexter Dr
Length: 0.07 miles
Direction: N-S
Address range: 5300 to 5399
Direction: N-S
Address range: 5300 to 5399
Macaw Pl
Length: 0.06 miles
Directions: E-W, SE-NW
Address range: 200 to 299
Directions: E-W, SE-NW
Address range: 200 to 299
Macaw Ct
Length: 0.06 miles
Directions: E-W, N-S, SW-NE
Address range: 5200 to 5299
Directions: E-W, N-S, SW-NE
Address range: 5200 to 5299
Plum Grove Ct
Length: 0.06 miles
Direction: E-W
Direction: E-W
Jacana Ct
Length: 0.04 miles
Directions: E-W, N-S, SE-NW
Address range: 5200 to 5299
Directions: E-W, N-S, SE-NW
Address range: 5200 to 5299
Macaw Ln
Length: 0.04 miles
Direction: E-W
Direction: E-W
Macaw Way
Length: 0.03 miles
Directions: N-S, SE-NW
Address range: 5200 to 5299
Directions: N-S, SE-NW
Address range: 5200 to 5299
Ostrich Ct
Length: 0.03 miles
Direction: N-S
Address range: 5213 to 5299
Direction: N-S
Address range: 5213 to 5299
Wong Way
Length: 0.03 miles
Direction: E-W
Direction: E-W
Bingham Ct
Length: 0.03 miles
Direction: N-S
Address range: 5300 to 5399
Direction: N-S
Address range: 5300 to 5399
Cheris Ct
Length: 0.03 miles
Direction: N-S
Address range: 5300 to 5399
Direction: N-S
Address range: 5300 to 5399
Banana Grove Ct
Length: 0.03 miles
Direction: N-S
Direction: N-S
Centerhart Ct
Length: 0.03 miles
Directions: N-S, SW-NE
Address range: 5200 to 5399
Directions: N-S, SW-NE
Address range: 5200 to 5399
Sigrid Way
Length: 0.02 miles
Direction: N-S
Address range: 5310 to 5339
Direction: N-S
Address range: 5310 to 5339
Myna Ct
Length: 0.02 miles
Direction: N-S
Address range: 5200 to 5299
Direction: N-S
Address range: 5200 to 5299