Atlanta (Bird) neighborhood in San Jose, California (CA), 95125 detailed profile
Settings
X

Business Search - 14 Million verified businesses
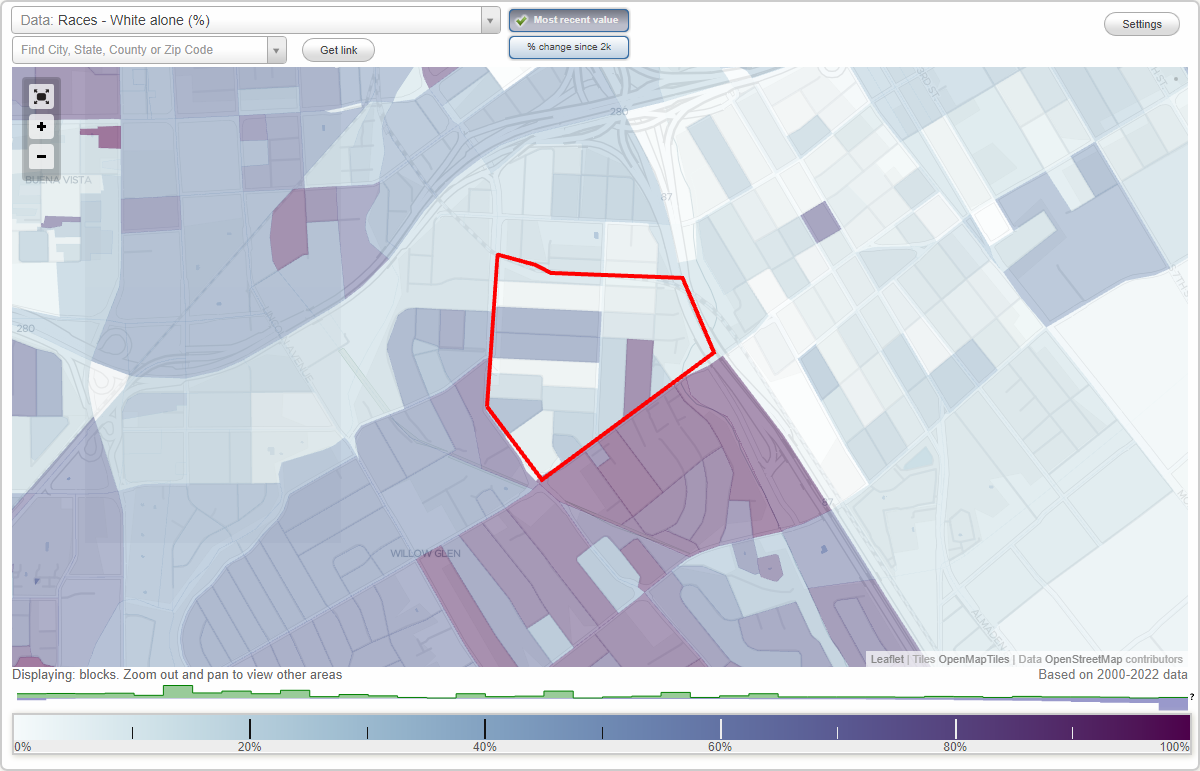
Area: 0.180 square miles
Population: 2,218
Population density:
| Atlanta (Bird): | 12,348 people per square mile |
| San Jose: | 5,554 people per square mile |

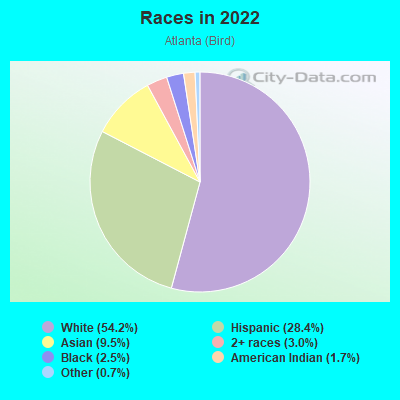
- 1,21554.2%White
- 63628.4%Hispanic or Latino
- 2149.5%Asian
- 683.0%Two or more races
- 552.5%Black
- 391.7%American Indian
- 150.7%Some other race
Median household income in 2022:
| Atlanta (Bird): | $169,513 |
| San Jose: | $133,835 |
Distribution of median household income
![Distribution of median household income]()
- 28Less than $10,000
- 37$10,000 to $19,999
- 88$20,000 to $29,999
- 51$30,000 to $39,999
- 50$40,000 to $49,999
- 27$50,000 to $59,999
- 45$60,000 to $74,999
- 95$75,000 to $99,999
- 108$100,000 to $124,999
- 44$125,000 to $149,999
- 58$150,000 to $199,999
- 376$200,000 or more

Distribution of owner-occupied house/condo value
![Distribution of owner-occupied house/condo value]()
- 8Less than $50,000
- 9$50,000 to $99,999
- 24$100,000 to $149,999
- 11$150,000 to $199,999
- 43$250,000 to $299,999
- 22$300,000 to $399,999
- 3$400,000 to $499,999
- 23$500,000 to $749,999
- 147$750,000 to $999,999
- 436$1,000,000 or more

Distribution of rent paid by renters
![Distribution of rent paid by renters]()
- 11$300 to $399
- 24$500 to $599
- 9$900 to $999
- 39$1,000 to $1,249
- 51$1,250 to $1,499
- 125$1,500 to $1,999
- 314$2,000 or more

Median rent in 2022:
| Atlanta (Bird): | $2,364 |
| San Jose: | $2,001 |
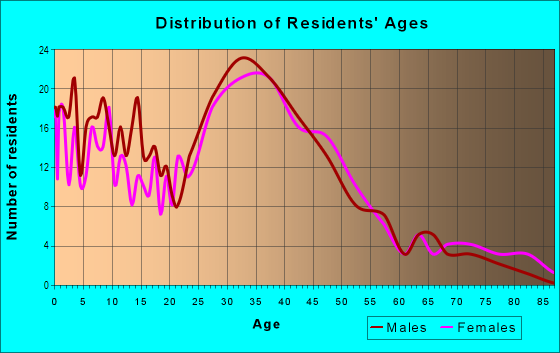
| Males: | 1,084 |
| Females: | 1,133 |
Males:
| This neighborhood: | 38.2 years |
| Whole city: | 37.6 years |
| This neighborhood: | 37.4 years |
| Whole city: | 39.1 years |
Average household size:
| Atlanta (Bird): | 2.8 people |
| San Jose: | 2.9 people |
Percentage of family households:
| Atlanta (Bird): | 57.6% |
| San Jose: | 49.9% |
| Here: | 45.3% |
| San Jose: | 53.0% |
Percentage of married-couple families with children (among all households):
| Atlanta (Bird): | 26.3% |
| San Jose: | 25.8% |
Percentage of single-mother households (among all households):
| Atlanta (Bird): | 8.9% |
| San Jose: | 5.2% |
Percentage of never married males 15 years old and over:
Percentage of never married females 15 years old and over:
| Atlanta (Bird): | 19.2% |
| San Jose: | 20.9% |
Percentage of never married females 15 years old and over:
| Atlanta (Bird): | 21.5% |
| city: | 16.7% |
Percentage of people that speak English not well or not at all:
| Atlanta (Bird): | 1.8% |
| San Jose: | 11.4% |
Percentage of people born in this state:
Percentage of people born in another U.S. state:
Percentage of native residents but born outside the U.S.:
Percentage of foreign born residents:
| Here: | 60.5% |
| San Jose: | 46.1% |
Percentage of people born in another U.S. state:
| Atlanta (Bird): | 13.9% |
| San Jose: | 10.4% |
Percentage of native residents but born outside the U.S.:
| Here: | 1.4% |
| city: | 1.7% |
Percentage of foreign born residents:
| Here: | 24.2% |
| San Jose: | 41.8% |
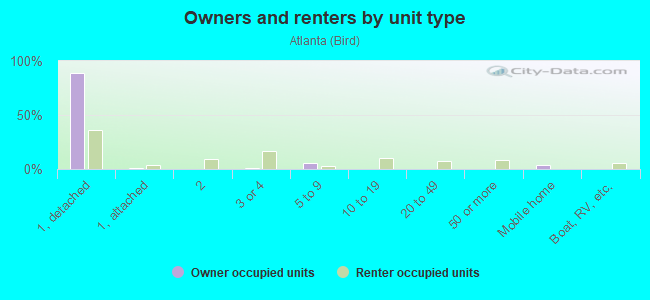
Owner-occupied
Renter-occupied

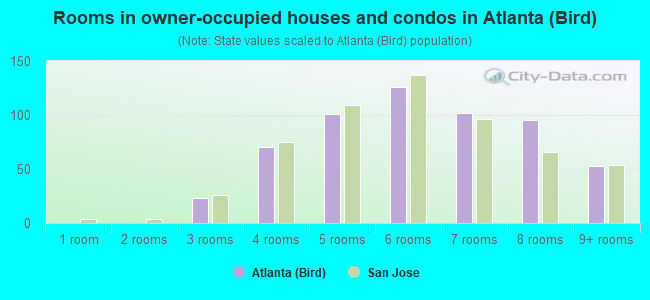
- Rooms in owner-occupied houses and condos in Atlanta <
> - 01 room
- 02 rooms
- 233 rooms
- 704 rooms
- 1015 rooms
- 1266 rooms
- 1027 rooms
- 958 rooms
- 539+ rooms
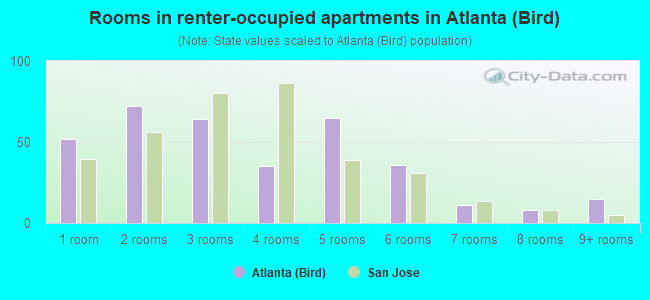
- Rooms in renter-occupied apartments in Atlanta <
> - 521 room
- 722 rooms
- 643 rooms
- 354 rooms
- 655 rooms
- 366 rooms
- 117 rooms
- 88 rooms
- 159+ rooms
Owner-occupied
Renter-occupied
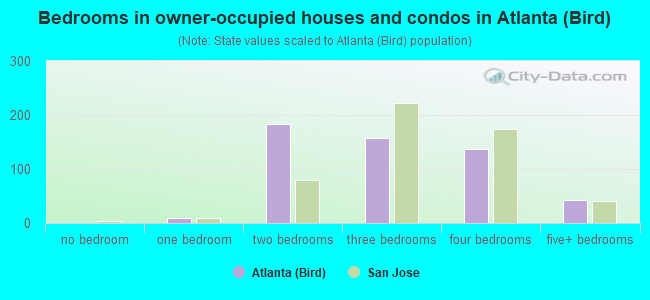
- Bedrooms in owner-occupied houses and condos in Atlanta <
> - 0no bedroom
- 91 bedroom
- 1842 bedrooms
- 1583 bedrooms
- 1374 bedrooms
- 425+ bedrooms
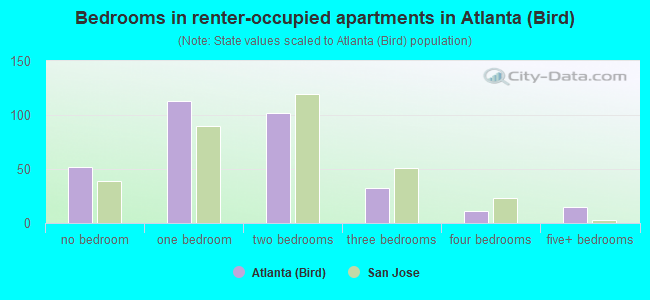
- Bedrooms in renter-occupied apartments in Atlanta <
> - 52no bedroom
- 1131 bedroom
- 1022 bedrooms
- 323 bedrooms
- 114 bedrooms
- 155+ bedrooms
Average number of cars or other vehicles available in houses/condos:
Average number of cars or other vehicles available in apartments:
| This neighborhood: | 2.4 |
| San Jose: | 2.3 |
Average number of cars or other vehicles available in apartments:
| Here: | 1.6 |
| city: | 1.6 |
Percentage of units with a mortgage:
| Atlanta (Bird): | 81.9% |
| San Jose: | 66.9% |
Average estimated value of detached houses in 2022 (79.1% of all units):
| Atlanta (Bird): | $920,107 |
| San Jose: | $1,532,815 |
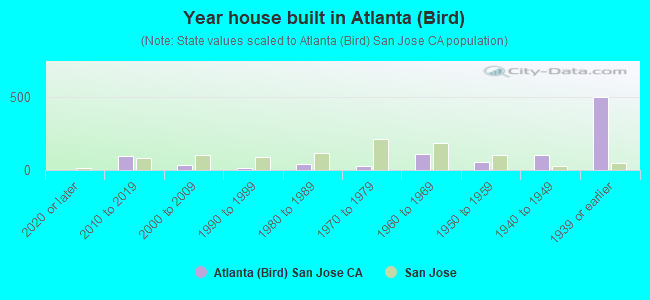
- Year house built in Atlanta <
> - 02020 or later
- 952010 to 2019
- 352000 to 2009
- 171990 to 1999
- 431980 to 1989
- 301970 to 1979
- 1081960 to 1969
- 571950 to 1959
- 1011940 to 1949
- 5011939 or earlier
City-data.com crime index for city in 2020 (higher means more crime):
| City: | 268.4 |
| U.S. average: | 219.5 |
Travel time to work (commute)
![Travel time to work (commute)]()
- 29Less than 5 minutes
- 825 to 9 minutes
- 13110 to 14 minutes
- 14915 to 19 minutes
- 25320 to 24 minutes
- 3125 to 29 minutes
- 11430 to 34 minutes
- 6135 to 39 minutes
- 4640 to 44 minutes
- 6245 to 59 minutes
- 4960 to 89 minutes
- 490 or more minutes

Means of transportation to work
![Means of transportation to work]()
- 59.4%661Drove a car alone
- 9.0%100Carpooled
- 2.2%25Bus
- 1.4%16Subway or elevated rail
- 4.5%50Long-distance train or commuter rail
- 1.6%18Light rail, streetcar or trolley
- 5.2%58Bicycle
- 0.4%5Walked
- 2.2%25Other means
- 28.3%315Worked at home

Time leaving home to go to work
![Time leaving home to go to work]()
- 1412:00 a.m. to 4:59 a.m.
- 315:00 a.m. to 5:29 a.m.
- 145:30 a.m. to 5:59 a.m.
- 796:00 a.m. to 6:29 a.m.
- 1096:30 a.m. to 6:59 a.m.
- 1537:00 a.m. to 7:29 a.m.
- 857:30 a.m. to 7:59 a.m.
- 1638:00 a.m. to 8:29 a.m.
- 1448:30 a.m. to 8:59 a.m.
- 719:00 a.m. to 9:59 a.m.
- 3910:00 a.m. to 10:59 a.m.
- 611:00 a.m. to 11:59 a.m.
- 5412:00 p.m. to 3:59 p.m.
- 144:00 p.m. to 11:59 p.m.

Occupations of males:
- Percentage of males in management occupations (except farmers):
Here: 19.0% city: 13.0%
- Percentage of males in business and financial operations occupations:
Here: 8.5% city: 4.6%
- Percentage of males in computer and mathematical occupations:
Here: 6.2% city: 13.6%
- Percentage of males in architecture and engineering occupations:
Here: 16.1% city: 10.2%
- Percentage of males in life, physical, and social science occupations:
Here: 3.5% city: 1.1%
- Percentage of males in arts, design, entertainment, sports, and media occupations:
Here: 7.5% city: 1.8%
- Percentage of males in healthcare practitioners and technical occupations:
Here: 2.8% city: 2.0%
- Percentage of males in service occupations:
Here: 7.3% city: 12.7%
- Percentage of males in sales and office occupations:
Here: 13.0% city: 12.8%
- Percentage of males in construction, extraction, and maintenance occupations:
Here: 11.7% city: 7.8%
- Percentage of males in transportation occupations:
Here: 2.6% city: 3.6%
Occupations of females:
- Percentage of females in management occupations (except farmers):
Here: 23.5% city: 11.0%
- Percentage of females in business and financial operations occupations:
Here: 10.0% city: 8.6%
- Percentage of females in computer and mathematical occupations:
Here: 1.2% city: 5.4%
- Percentage of females in life, physical, and social science occupations:
Here: 2.2% city: 1.7%
- Percentage of females in legal occupations:
Here: 6.5% city: 1.3%
- Percentage of females in education, training, and library occupations:
Here: 9.7% city: 8.1%
- Percentage of females in arts, design, entertainment, sports, and media occupations:
Here: 3.1% city: 2.0%
- Percentage of females in healthcare practitioners and technical occupations:
Here: 11.4% city: 6.8%
- Percentage of females in service occupations:
Here: 5.1% city: 21.7%
- Percentage of females in sales and office occupations:
Here: 23.3% city: 22.0%
- Percentage of females in material moving occupations:
Here: 4.0% city: 1.5%
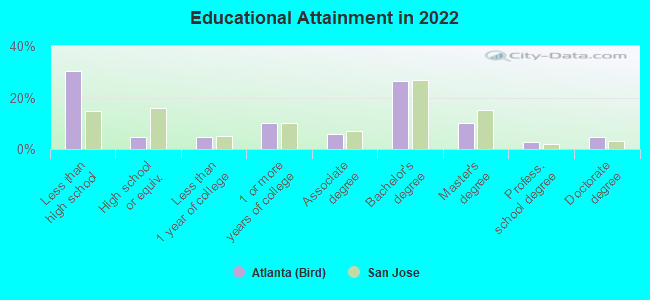
Education in this neighborhood (subdivision or community):
- Percentage of people 3 years and older in K-12 schools:
Atlanta (Bird): 19.1% San Jose: 16.1%
- Percentage of people 3 years and older in undergraduate colleges:
Atlanta (Bird): 7.9% San Jose: 6.5%
- Percentage of people 3 years and older in grad. or professional schools:
Atlanta (Bird): 4.0% San Jose: 2.0%
- Percentage of students K-12 enrolled in private schools:
Atlanta (Bird): 38.7% San Jose: 14.9%
Percentage of population below poverty level:
| Atlanta (Bird): | 2.5% |
| San Jose: | 9.0% |
Median year owner moved in (as recorded in 2022):
Median year renter moved in (as recorded in 2022):
| Atlanta (Bird): | 2007 |
| San Jose: | 2008 |
Median year renter moved in (as recorded in 2022):
| Atlanta (Bird): | 2018 |
| San Jose: | 2020 |
Percentage of married-couple families with both working:
| Atlanta (Bird): | 103.2% |
| San Jose: | 72.5% |
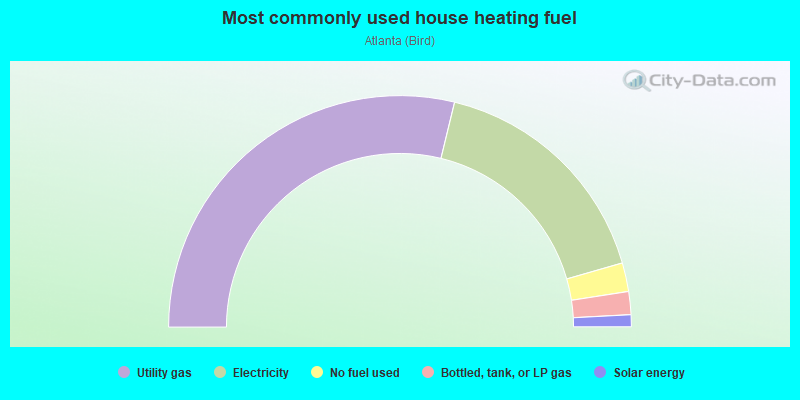
- 57.6%Utility gas
- 33.5%Electricity
- 4.0%No fuel used
- 3.2%Bottled, tank, or LP gas
- 1.7%Solar energy
Roads and streets:
Delmas Ave
Length: 0.39 miles
Directions: N-S, SE-NW
Address range: 862 to 1099
Directions: N-S, SE-NW
Address range: 862 to 1099
Prevost St
Length: 0.29 miles
Direction: N-S
Address range: 860 to 999
Direction: N-S
Address range: 860 to 999
Willow St
Length: 0.27 miles
Directions: E-W, SE-NW, SW-NE
Address range: 501 to 751
Directions: E-W, SE-NW, SW-NE
Address range: 501 to 751
Atlanta Ave
Length: 0.25 miles
Direction: E-W
Address range: 300 to 399
Direction: E-W
Address range: 300 to 399
Hull Ave
Length: 0.23 miles
Direction: E-W
Address range: 300 to 399
Direction: E-W
Address range: 300 to 399
Spencer Ave
Length: 0.20 miles
Direction: N-S
Address range: 900 to 1099
Direction: N-S
Address range: 900 to 1099
Fuller Ave
Length: 0.18 miles
Direction: E-W
Address range: 300 to 399
Direction: E-W
Address range: 300 to 399
Marshall Ave
Length: 0.16 miles
Direction: E-W
Address range: 400 to 499
Direction: E-W
Address range: 400 to 499
Snyder Ave
Length: 0.16 miles
Direction: E-W
Address range: 400 to 542
Direction: E-W
Address range: 400 to 542
Warren Ave
Length: 0.13 miles
Directions: N-S, SE-NW
Address range: 1000 to 1099
Directions: N-S, SE-NW
Address range: 1000 to 1099
Shepherd Ave
Length: 0.11 miles
Directions: E-W, SE-NW
Address range: 400 to 499
Directions: E-W, SE-NW
Address range: 400 to 499
Willis Ave
Length: 0.08 miles
Directions: N-S, SE-NW
Address range: 1000 to 1099
Directions: N-S, SE-NW
Address range: 1000 to 1099
Mills Ct
Length: 0.03 miles
Direction: N-S
Address range: 900 to 999
Direction: N-S
Address range: 900 to 999
Railroad features:
Union Pacific RR
Length: 0.41 miles
Direction: E-W
Direction: E-W
Other features:
Guadalupe Riv
Length: 0.07 miles
Directions: N-S, SW-NE
Directions: N-S, SW-NE