Arlington Heights neighborhood in Pittsburgh, Pennsylvania (PA), 15210 detailed profile
Settings
X

Business Search - 14 Million verified businesses
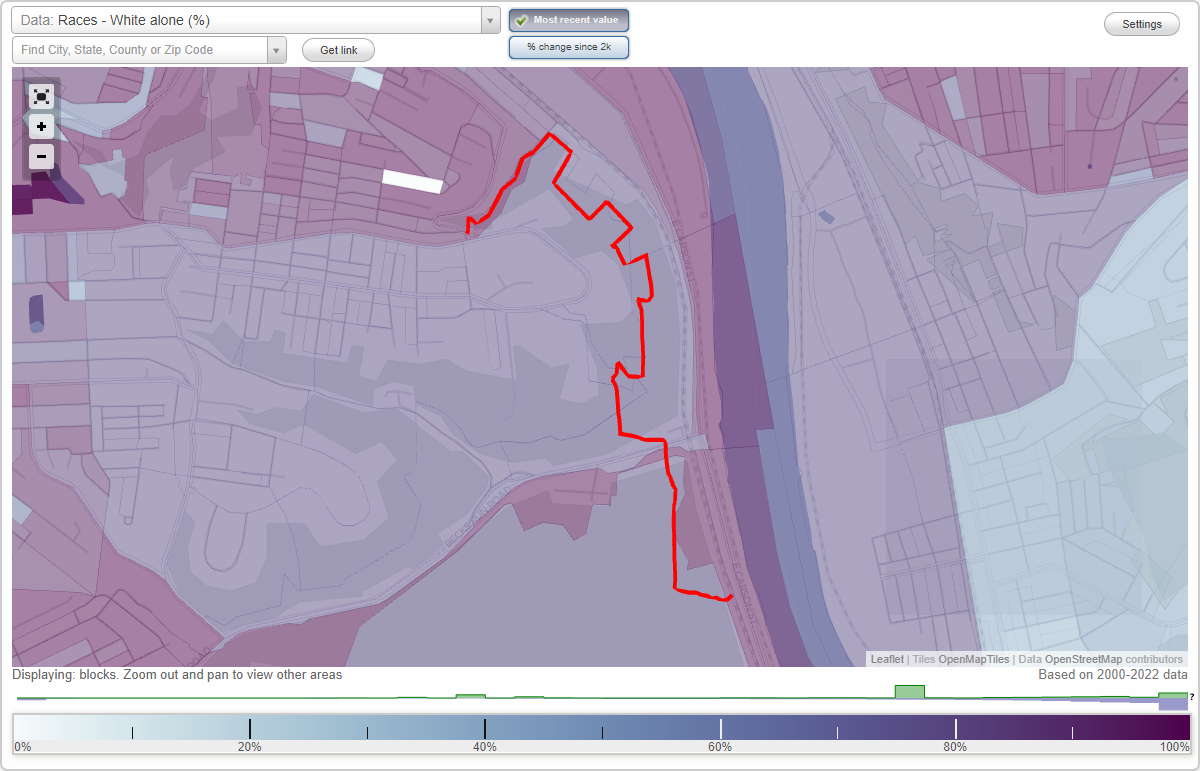
Area: 0.131 square miles
Population: 669
Population density:
| Arlington Heights: | 5,090 people per square mile |
| Pittsburgh: | 5,449 people per square mile |

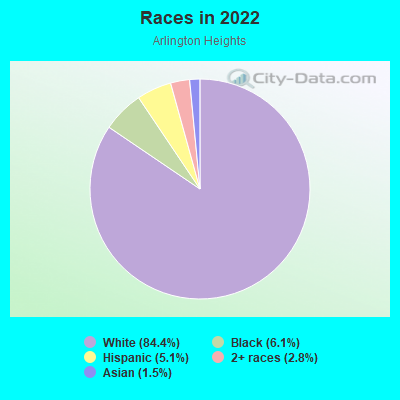
- 56484.4%White
- 416.1%Black
- 345.1%Hispanic or Latino
- 192.8%Two or more races
- 101.5%Asian
Median household income in 2022:
| Arlington Heights: | $54,138 |
| Pittsburgh: | $63,380 |
Distribution of median household income
![Distribution of median household income]()
- 13Less than $10,000
- 38$10,000 to $19,999
- 24$20,000 to $29,999
- 51$30,000 to $39,999
- 44$40,000 to $49,999
- 23$50,000 to $59,999
- 57$60,000 to $74,999
- 17$75,000 to $99,999
- 9$100,000 to $124,999
- 24$125,000 to $149,999
- 30$150,000 to $199,999
- 33$200,000 or more

Distribution of owner-occupied house/condo value
![Distribution of owner-occupied house/condo value]()
- 17Less than $50,000
- 44$50,000 to $99,999
- 24$100,000 to $149,999
- 19$150,000 to $199,999
- 47$200,000 to $249,999
- 4$250,000 to $299,999
- 8$300,000 to $399,999
- 16$400,000 to $499,999

Distribution of rent paid by renters
![Distribution of rent paid by renters]()
- 3$200 to $299
- 3$300 to $399
- 4$400 to $499
- 7$500 to $599
- 5$600 to $699
- 37$700 to $799
- 27$800 to $899
- 16$900 to $999
- 29$1,000 to $1,249
- 17$1,250 to $1,499
- 12$1,500 to $1,999
- 22$2,000 or more

Median rent in 2022:
| Arlington Heights: | $934 |
| Pittsburgh: | $981 |
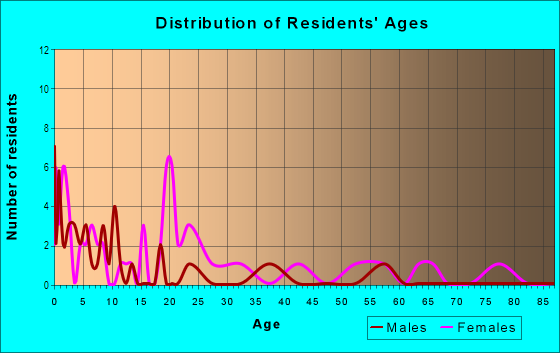
| Males: | 282 |
| Females: | 386 |
Males:
| This neighborhood: | 37.4 years |
| Whole city: | 33.3 years |
| This neighborhood: | 35.1 years |
| Whole city: | 32.9 years |
Average household size:
| Arlington Heights: | 1.9 people |
| Pittsburgh: | 24.0 people |
Percentage of family households:
| Arlington Heights: | 34.1% |
| Pittsburgh: | 28.6% |
| Here: | 28.3% |
| Pittsburgh: | 27.2% |
Percentage of married-couple families with children (among all households):
| Arlington Heights: | 8.8% |
| Pittsburgh: | 24.6% |
Percentage of single-mother households (among all households):
| Arlington Heights: | 41.2% |
| Pittsburgh: | 14.6% |
Percentage of never married males 15 years old and over:
Percentage of never married females 15 years old and over:
| Arlington Heights: | 24.3% |
| Pittsburgh: | 28.4% |
Percentage of never married females 15 years old and over:
| Arlington Heights: | 21.5% |
| city: | 27.6% |
Percentage of people that speak English not well or not at all:
| Arlington Heights: | 0.0% |
| Pittsburgh: | 1.2% |
Percentage of people born in this state:
Percentage of people born in another U.S. state:
Percentage of native residents but born outside the U.S.:
Percentage of foreign born residents:
| Here: | 79.3% |
| Pittsburgh: | 65.9% |
Percentage of people born in another U.S. state:
| Arlington Heights: | 15.7% |
| Pittsburgh: | 24.4% |
Percentage of native residents but born outside the U.S.:
| Here: | 1.8% |
| city: | 1.5% |
Percentage of foreign born residents:
| Here: | 3.3% |
| Pittsburgh: | 8.2% |
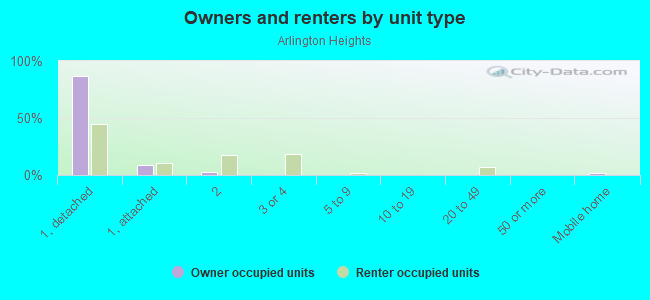
Owner-occupied
Renter-occupied

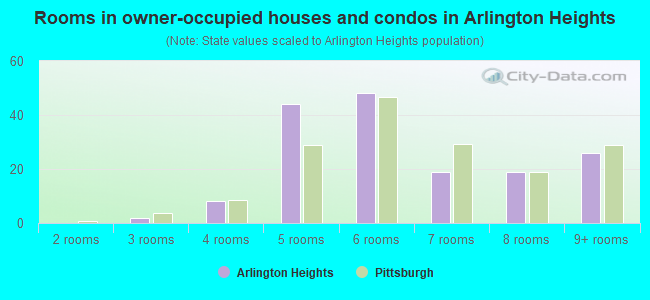
- Rooms in owner-occupied houses and condos in Arlington Heights
- 01 room
- 02 rooms
- 23 rooms
- 84 rooms
- 445 rooms
- 486 rooms
- 197 rooms
- 198 rooms
- 269+ rooms
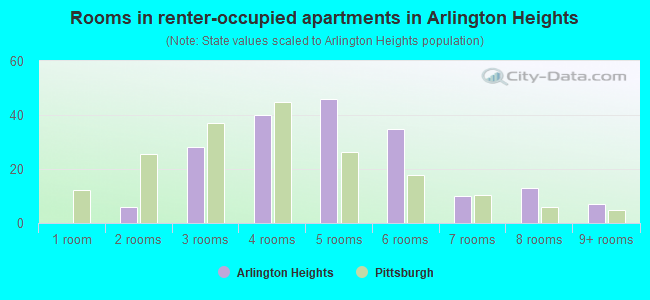
- Rooms in renter-occupied apartments in Arlington Heights
- 01 room
- 62 rooms
- 283 rooms
- 404 rooms
- 465 rooms
- 356 rooms
- 107 rooms
- 138 rooms
- 79+ rooms
Owner-occupied
Renter-occupied
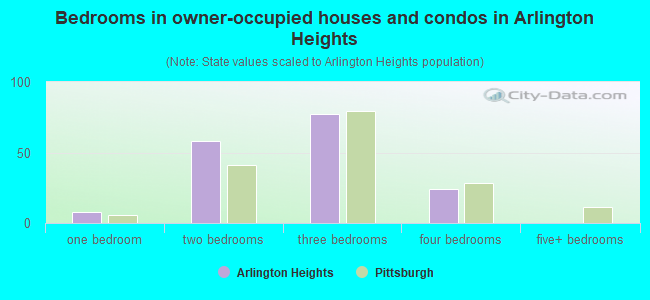
- Bedrooms in owner-occupied houses and condos in Arlington Heights
- 0no bedroom
- 81 bedroom
- 582 bedrooms
- 773 bedrooms
- 244 bedrooms
- 05+ bedrooms
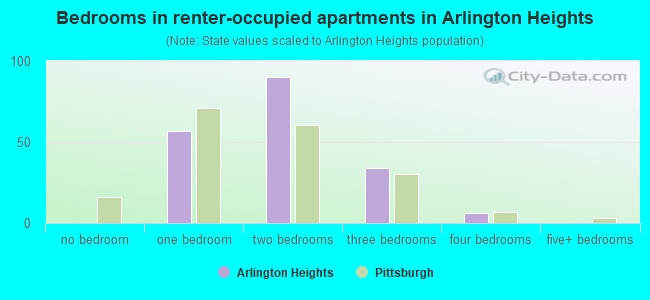
- Bedrooms in renter-occupied apartments in Arlington Heights
- 0no bedroom
- 571 bedroom
- 902 bedrooms
- 343 bedrooms
- 64 bedrooms
- 05+ bedrooms
Average number of cars or other vehicles available in houses/condos:
Average number of cars or other vehicles available in apartments:
| This neighborhood: | 1.5 |
| Pittsburgh: | 1.5 |
Average number of cars or other vehicles available in apartments:
| Here: | 1.1 |
| city: | 0.9 |
Percentage of units with a mortgage:
| Arlington Heights: | 34.9% |
| Pittsburgh: | 56.7% |
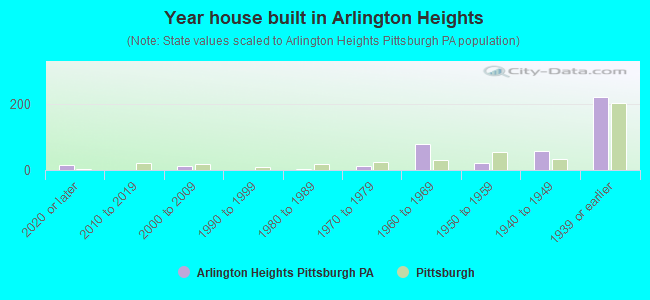
- Year house built in Arlington Heights
- 152020 or later
- 02010 to 2019
- 112000 to 2009
- 01990 to 1999
- 21980 to 1989
- 111970 to 1979
- 781960 to 1969
- 211950 to 1959
- 571940 to 1949
- 2191939 or earlier
City-data.com crime index for city in 2019 (higher means more crime):
| City: | 257.1 |
| U.S. average: | 223.9 |
Travel time to work (commute)
![Travel time to work (commute)]()
- 2Less than 5 minutes
- 325 to 9 minutes
- 1710 to 14 minutes
- 5015 to 19 minutes
- 5820 to 24 minutes
- 3025 to 29 minutes
- 9330 to 34 minutes
- 235 to 39 minutes
- 440 to 44 minutes
- 2445 to 59 minutes
- 4860 to 89 minutes
- 290 or more minutes

Means of transportation to work
![Means of transportation to work]()
- 53.1%225Drove a car alone
- 5.4%23Carpooled
- 24.3%103Bus
- 0.7%3Taxi
- 2.4%10Walked
- 13.2%56Worked at home

Time leaving home to go to work
![Time leaving home to go to work]()
- 1112:00 a.m. to 4:59 a.m.
- 95:00 a.m. to 5:29 a.m.
- 95:30 a.m. to 5:59 a.m.
- 126:00 a.m. to 6:29 a.m.
- 376:30 a.m. to 6:59 a.m.
- 327:00 a.m. to 7:29 a.m.
- 267:30 a.m. to 7:59 a.m.
- 368:00 a.m. to 8:29 a.m.
- 88:30 a.m. to 8:59 a.m.
- 739:00 a.m. to 9:59 a.m.
- 4910:00 a.m. to 10:59 a.m.
- 1511:00 a.m. to 11:59 a.m.
- 2112:00 p.m. to 3:59 p.m.
- 234:00 p.m. to 11:59 p.m.

Occupations of males:
- Percentage of males in management occupations (except farmers):
Here: 17.3% city: 11.1%
- Percentage of males in business and financial operations occupations:
Here: 6.8% city: 8.0%
- Percentage of males in computer and mathematical occupations:
Here: 7.1% city: 9.0%
- Percentage of males in architecture and engineering occupations:
Here: 20.0% city: 3.4%
- Percentage of males in legal occupations:
Here: 2.0% city: 1.8%
- Percentage of males in education, training, and library occupations:
Here: 1.7% city: 7.0%
- Percentage of males in arts, design, entertainment, sports, and media occupations:
Here: 2.9% city: 3.0%
- Percentage of males in healthcare practitioners and technical occupations:
Here: 6.2% city: 6.1%
- Percentage of males in service occupations:
Here: 8.0% city: 14.7%
- Percentage of males in sales and office occupations:
Here: 12.3% city: 12.2%
- Percentage of males in farming, fishing, and forestry occupations:
Here: 1.8% city: 0.2%
- Percentage of males in production occupations:
Here: 2.9% city: 3.3%
- Percentage of males in transportation occupations:
Here: 2.7% city: 4.4%
- Percentage of males in material moving occupations:
Here: 5.9% city: 3.8%
Occupations of females:
- Percentage of females in management occupations (except farmers):
Here: 14.7% city: 8.7%
- Percentage of females in business and financial operations occupations:
Here: 4.8% city: 8.1%
- Percentage of females in computer and mathematical occupations:
Here: 1.3% city: 2.8%
- Percentage of females in life, physical, and social science occupations:
Here: 2.1% city: 2.1%
- Percentage of females in community and social services occupations:
Here: 3.3% city: 3.4%
- Percentage of females in education, training, and library occupations:
Here: 3.5% city: 9.9%
- Percentage of females in arts, design, entertainment, sports, and media occupations:
Here: 1.1% city: 3.0%
- Percentage of females in healthcare practitioners and technical occupations:
Here: 6.6% city: 10.9%
- Percentage of females in service occupations:
Here: 17.2% city: 20.1%
- Percentage of females in sales and office occupations:
Here: 39.2% city: 23.5%
- Percentage of females in production occupations:
Here: 2.4% city: 1.3%
- Percentage of females in transportation occupations:
Here: 2.3% city: 0.8%
- Percentage of females in material moving occupations:
Here: 1.3% city: 1.4%
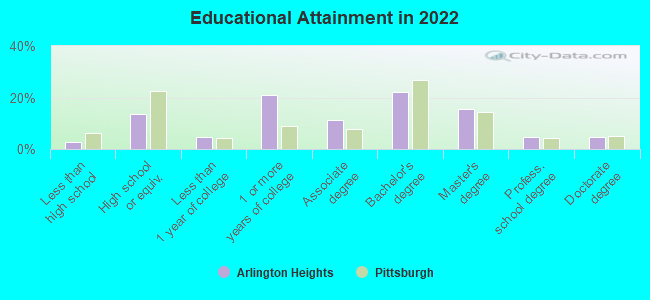
Education in this neighborhood (subdivision or community):
- Percentage of people 3 years and older in K-12 schools:
Arlington Heights: 8.0% Pittsburgh: 10.4%
- Percentage of people 3 years and older in undergraduate colleges:
Arlington Heights: 5.9% Pittsburgh: 12.9%
- Percentage of people 3 years and older in grad. or professional schools:
Arlington Heights: 3.2% Pittsburgh: 4.1%
- Percentage of students K-12 enrolled in private schools:
Arlington Heights: 7.5% Pittsburgh: 19.6%
Percentage of population below poverty level:
| Arlington Heights: | 18.3% |
| Pittsburgh: | 19.0% |
Median year owner moved in (as recorded in 2022):
Median year renter moved in (as recorded in 2022):
| Arlington Heights: | 1999 |
| Pittsburgh: | 2007 |
Median year renter moved in (as recorded in 2022):
| Arlington Heights: | 2018 |
| Pittsburgh: | 2020 |
Percentage of married-couple families with both working:
| Arlington Heights: | 61.5% |
| Pittsburgh: | 79.2% |
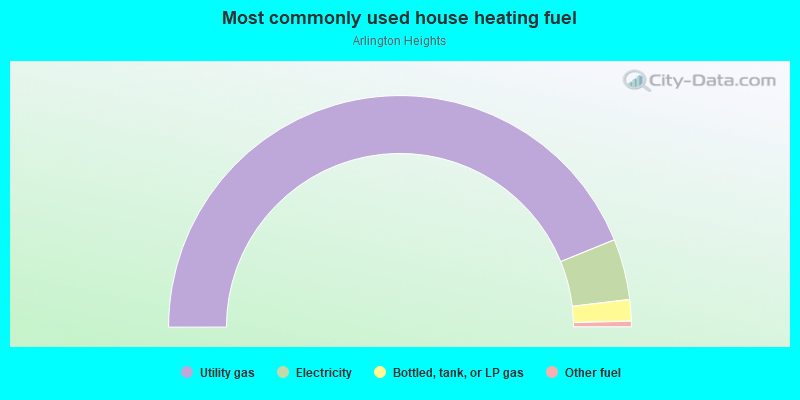
- 87.7%Utility gas
- 8.5%Electricity
- 3.0%Bottled, tank, or LP gas
- 0.8%Other fuel
Roads and streets:
Arlington Ave
Length: 0.43 miles
Directions: E-W, N-S, SE-NW, SW-NE
Address range: 3105 to 3299
Directions: E-W, N-S, SE-NW, SW-NE
Address range: 3105 to 3299
Devlin St
Length: 0.26 miles
Directions: E-W, SW-NE
Address range: 2919 to 2951
Directions: E-W, SW-NE
Address range: 2919 to 2951
Spring St
Length: 0.10 miles
Direction: E-W
Address range: 2947 to 2999
Direction: E-W
Address range: 2947 to 2999
Cordell Pl
Length: 0.09 miles
Directions: E-W, SE-NW, SW-NE
Address range: 3100 to 3199
Directions: E-W, SE-NW, SW-NE
Address range: 3100 to 3199
Zaruba St
Length: 0.07 miles
Directions: E-W, SW-NE
Address range: 3001 to 3054
Directions: E-W, SW-NE
Address range: 3001 to 3054
Castle Ave
Length: 0.04 miles
Direction: SE-NW
Address range: 200 to 299
Direction: SE-NW
Address range: 200 to 299