Airport Green neighborhood in Vancouver, Washington (WA), 98684 detailed profile
Settings
X

Business Search - 14 Million verified businesses
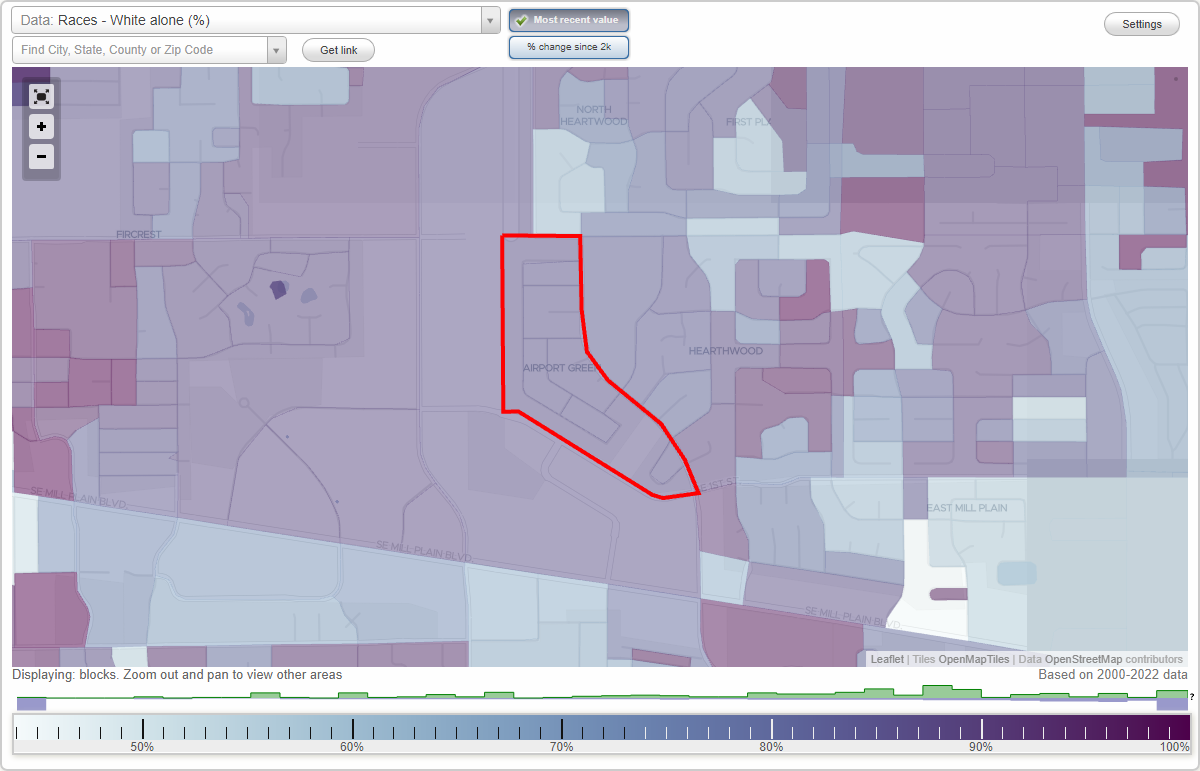
Area: 0.101 square miles
Population: 666
Population density:
| Airport Green: | 6,581 people per square mile |
| Vancouver: | 4,545 people per square mile |

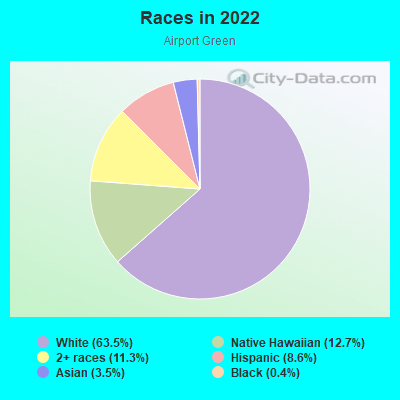
- 48563.5%White
- 9712.7%Native Hawaiian and Other
Pacific Islander - 8611.3%Two or more races
- 668.6%Hispanic or Latino
- 273.5%Asian
- 30.4%Black
Median household income in 2022:
| Airport Green: | $88,494 |
| Vancouver: | $76,799 |
Distribution of median household income
![Distribution of median household income]()
- 6Less than $10,000
- 24$10,000 to $19,999
- 12$20,000 to $29,999
- 8$30,000 to $39,999
- 27$40,000 to $49,999
- 7$50,000 to $59,999
- 71$60,000 to $74,999
- 30$75,000 to $99,999
- 21$100,000 to $124,999
- 7$125,000 to $149,999
- 50$150,000 to $199,999
- 33$200,000 or more

Distribution of owner-occupied house/condo value
![Distribution of owner-occupied house/condo value]()
- 10Less than $50,000
- 5$100,000 to $149,999
- 20$150,000 to $199,999
- 3$200,000 to $249,999
- 36$250,000 to $299,999
- 64$300,000 to $399,999
- 55$400,000 to $499,999
- 77$500,000 to $749,999
- 23$750,000 to $999,999
- 4$1,000,000 or more

Distribution of rent paid by renters
![Distribution of rent paid by renters]()
- 6$500 to $599
- 2$700 to $799
- 24$900 to $999
- 5$1,000 to $1,249
- 9$1,250 to $1,499
- 14$1,500 to $1,999
- 44$2,000 or more

Median rent in 2022:
| Airport Green: | $1,827 |
| Vancouver: | $1,452 |
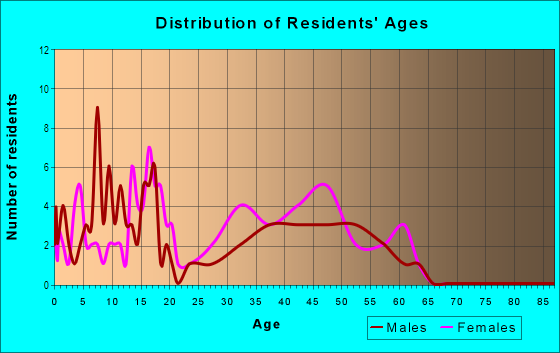
| Males: | 278 |
| Females: | 388 |
Males:
| This neighborhood: | 41.9 years |
| Whole city: | 34.7 years |
| This neighborhood: | 41.7 years |
| Whole city: | 39.9 years |
Average household size:
| Airport Green: | 2.6 people |
| Vancouver: | 2.4 people |
Percentage of family households:
| Airport Green: | 51.7% |
| Vancouver: | 40.5% |
| Here: | 67.1% |
| Vancouver: | 40.2% |
Percentage of married-couple families with children (among all households):
| Airport Green: | 36.3% |
| Vancouver: | 27.2% |
Percentage of single-mother households (among all households):
| Airport Green: | 2.2% |
| Vancouver: | 9.7% |
Percentage of never married males 15 years old and over:
Percentage of never married females 15 years old and over:
| Airport Green: | 2.7% |
| Vancouver: | 18.8% |
Percentage of never married females 15 years old and over:
| Airport Green: | 17.7% |
| city: | 17.6% |
Percentage of people that speak English not well or not at all:
| Airport Green: | 0.0% |
| Vancouver: | 4.9% |
Percentage of people born in this state:
Percentage of people born in another U.S. state:
Percentage of native residents but born outside the U.S.:
Percentage of foreign born residents:
| Here: | 32.0% |
| Vancouver: | 30.3% |
Percentage of people born in another U.S. state:
| Airport Green: | 45.2% |
| Vancouver: | 54.5% |
Percentage of native residents but born outside the U.S.:
| Here: | 1.6% |
| city: | 1.4% |
Percentage of foreign born residents:
| Here: | 21.2% |
| Vancouver: | 13.8% |
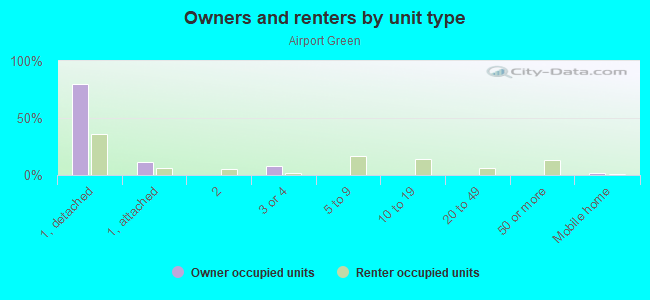
Owner-occupied
Renter-occupied

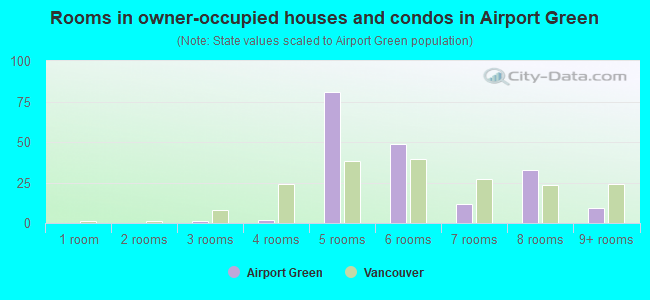
- Rooms in owner-occupied houses and condos in Airport Green
- 01 room
- 02 rooms
- 13 rooms
- 24 rooms
- 815 rooms
- 496 rooms
- 127 rooms
- 338 rooms
- 99+ rooms
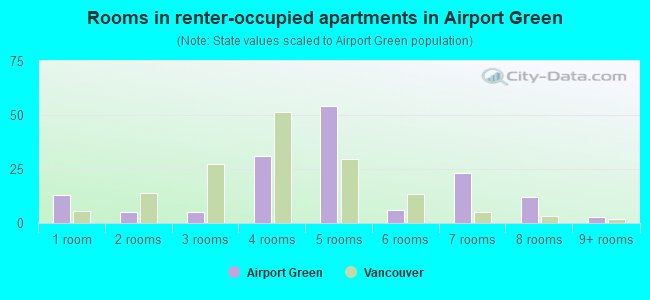
- Rooms in renter-occupied apartments in Airport Green
- 131 room
- 52 rooms
- 53 rooms
- 314 rooms
- 545 rooms
- 66 rooms
- 237 rooms
- 128 rooms
- 39+ rooms
Owner-occupied
Renter-occupied
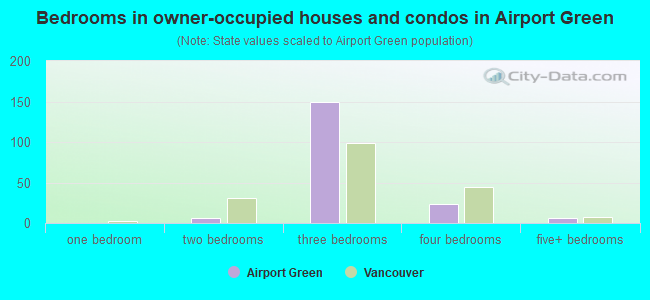
- Bedrooms in owner-occupied houses and condos in Airport Green
- 0no bedroom
- 01 bedroom
- 62 bedrooms
- 1493 bedrooms
- 244 bedrooms
- 65+ bedrooms
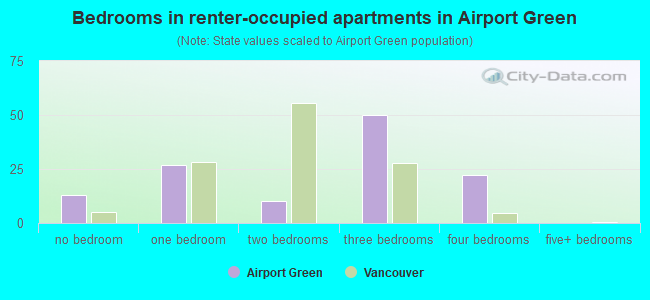
- Bedrooms in renter-occupied apartments in Airport Green
- 13no bedroom
- 271 bedroom
- 102 bedrooms
- 503 bedrooms
- 224 bedrooms
- 05+ bedrooms
Average number of cars or other vehicles available in houses/condos:
Average number of cars or other vehicles available in apartments:
| This neighborhood: | 2.7 |
| Vancouver: | 2.2 |
Average number of cars or other vehicles available in apartments:
| Here: | 1.8 |
| city: | 1.4 |
Percentage of units with a mortgage:
| Airport Green: | 75.4% |
| Vancouver: | 64.8% |
Average estimated value of detached houses in 2022 (83.3% of all units):
| Airport Green: | $622,005 |
| Washington: | $734,307 |
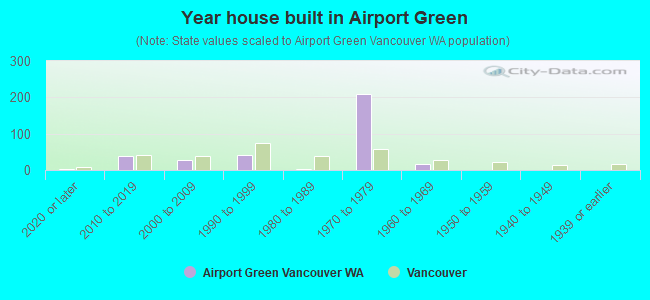
- Year house built in Airport Green
- 22020 or later
- 382010 to 2019
- 282000 to 2009
- 401990 to 1999
- 31980 to 1989
- 2081970 to 1979
- 171960 to 1969
- 11950 to 1959
- 01940 to 1949
- 11939 or earlier
City-data.com crime index for city in 2020 (higher means more crime):
| City: | 339.4 |
| U.S. average: | 219.5 |
Travel time to work (commute)
![Travel time to work (commute)]()
- 7Less than 5 minutes
- 375 to 9 minutes
- 10710 to 14 minutes
- 8915 to 19 minutes
- 6820 to 24 minutes
- 2525 to 29 minutes
- 9730 to 34 minutes
- 335 to 39 minutes
- 3840 to 44 minutes
- 2345 to 59 minutes
- 560 to 89 minutes
- 1590 or more minutes

Means of transportation to work
![Means of transportation to work]()
- 75.9%280Drove a car alone
- 9.8%36Carpooled
- 1.6%6Bus
- 0.3%1Subway or elevated rail
- 0.5%2Taxi
- 0.3%1Walked
- 0.8%3Other means
- 11.9%44Worked at home

Time leaving home to go to work
![Time leaving home to go to work]()
- 5412:00 a.m. to 4:59 a.m.
- 415:00 a.m. to 5:29 a.m.
- 175:30 a.m. to 5:59 a.m.
- 686:00 a.m. to 6:29 a.m.
- 296:30 a.m. to 6:59 a.m.
- 457:00 a.m. to 7:29 a.m.
- 637:30 a.m. to 7:59 a.m.
- 288:00 a.m. to 8:29 a.m.
- 198:30 a.m. to 8:59 a.m.
- 499:00 a.m. to 9:59 a.m.
- 1210:00 a.m. to 10:59 a.m.
- 1011:00 a.m. to 11:59 a.m.
- 3012:00 p.m. to 3:59 p.m.
- 394:00 p.m. to 11:59 p.m.

Occupations of males:
- Percentage of males in management occupations (except farmers):
Here: 4.0% city: 9.6%
- Percentage of males in business and financial operations occupations:
Here: 8.6% city: 5.2%
- Percentage of males in computer and mathematical occupations:
Here: 4.3% city: 4.9%
- Percentage of males in architecture and engineering occupations:
Here: 4.8% city: 3.6%
- Percentage of males in community and social services occupations:
Here: 6.8% city: 1.0%
- Percentage of males in service occupations:
Here: 1.1% city: 12.4%
- Percentage of males in sales and office occupations:
Here: 16.9% city: 15.7%
- Percentage of males in construction, extraction, and maintenance occupations:
Here: 2.0% city: 11.5%
- Percentage of males in production occupations:
Here: 38.0% city: 8.2%
Occupations of females:
- Percentage of females in management occupations (except farmers):
Here: 2.0% city: 8.2%
- Percentage of females in business and financial operations occupations:
Here: 5.6% city: 7.3%
- Percentage of females in computer and mathematical occupations:
Here: 6.2% city: 2.7%
- Percentage of females in architecture and engineering occupations:
Here: 1.7% city: 0.7%
- Percentage of females in community and social services occupations:
Here: 1.3% city: 1.9%
- Percentage of females in legal occupations:
Here: 1.9% city: 1.0%
- Percentage of females in healthcare practitioners and technical occupations:
Here: 7.5% city: 9.1%
- Percentage of females in service occupations:
Here: 24.5% city: 24.5%
- Percentage of females in sales and office occupations:
Here: 37.2% city: 26.7%
- Percentage of females in production occupations:
Here: 14.9% city: 3.4%
- Percentage of females in transportation occupations:
Here: 1.1% city: 2.0%
- Percentage of females in material moving occupations:
Here: 3.0% city: 2.3%
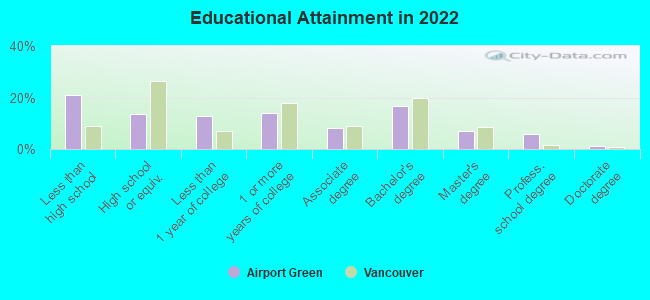
Education in this neighborhood (subdivision or community):
- Percentage of people 3 years and older in K-12 schools:
Airport Green: 19.4% Vancouver: 16.4%
- Percentage of people 3 years and older in undergraduate colleges:
Airport Green: 3.8% Vancouver: 4.1%
- Percentage of people 3 years and older in grad. or professional schools:
Airport Green: 0.3% Vancouver: 1.0%
- Percentage of students K-12 enrolled in private schools:
Airport Green: 8.9% Vancouver: 6.8%
Percentage of population below poverty level:
| Airport Green: | 12.3% |
| Vancouver: | 10.0% |
Median year owner moved in (as recorded in 2022):
Median year renter moved in (as recorded in 2022):
| Airport Green: | 2009 |
| Vancouver: | 2012 |
Median year renter moved in (as recorded in 2022):
| Airport Green: | 2018 |
| Vancouver: | 2020 |
Percentage of married-couple families with both working:
| Airport Green: | 108.7% |
| Vancouver: | 55.7% |
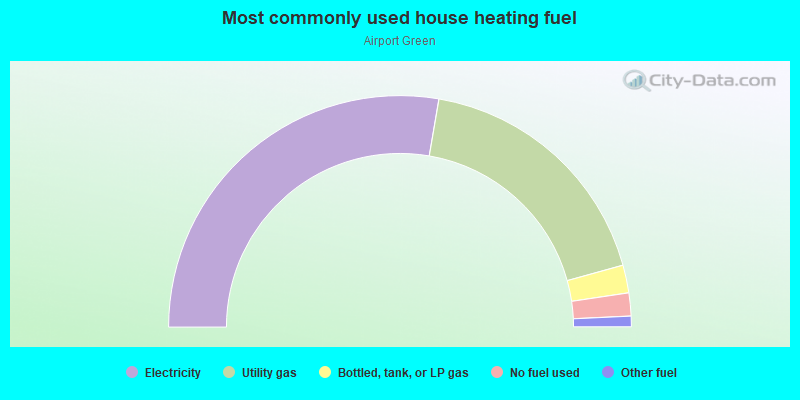
- 55.4%Electricity
- 36.0%Utility gas
- 3.9%Bottled, tank, or LP gas
- 3.2%No fuel used
- 1.5%Other fuel
Roads and streets:
NE Hearthwood Blvd
Length: 0.40 miles
Directions: N-S, SE-NW
Address range: 100 to 350
Directions: N-S, SE-NW
Address range: 100 to 350
NE Airport Dr
Length: 0.32 miles
Directions: E-W, N-S, SE-NW, SW-NE
Address range: 13800 to 14399
Directions: E-W, N-S, SE-NW, SW-NE
Address range: 13800 to 14399
NE 138th Ave
Length: 0.29 miles
Directions: N-S, SE-NW, SW-NE
Address range: 400 to 899
Directions: N-S, SE-NW, SW-NE
Address range: 400 to 899
NE Piper Rd
Length: 0.23 miles
Directions: E-W, SE-NW
Address range: 13900 to 14499
Directions: E-W, SE-NW
Address range: 13900 to 14499
NE 6th St
Length: 0.18 miles
Direction: E-W
Address range: 13800 to 14099
Direction: E-W
Address range: 13800 to 14099
NE 7th Way
Length: 0.17 miles
Direction: E-W
Address range: 13800 to 14099
Direction: E-W
Address range: 13800 to 14099
NE 8th St
Length: 0.17 miles
Directions: E-W, SW-NE
Address range: 13800 to 14099
Directions: E-W, SW-NE
Address range: 13800 to 14099
NE Juniper Ave
Length: 0.12 miles
Directions: N-S, SE-NW, SW-NE
Address range: 100 to 199
Directions: N-S, SE-NW, SW-NE
Address range: 100 to 199
NE Coast Pine Ave
Length: 0.11 miles
Directions: E-W, SE-NW, SW-NE
Address range: 100 to 199
Directions: E-W, SE-NW, SW-NE
Address range: 100 to 199
NE 7th Cir
Length: 0.09 miles
Direction: E-W
Address range: 13900 to 14099
Direction: E-W
Address range: 13900 to 14099
NE 139th Ave
Length: 0.08 miles
Direction: N-S
Address range: 400 to 599
Direction: N-S
Address range: 400 to 599
NE 144th Ave
Length: 0.07 miles
Direction: SW-NE
Address range: 300 to 399
Direction: SW-NE
Address range: 300 to 399
NE 140th Ave
Length: 0.06 miles
Direction: SW-NE
Direction: SW-NE
NE 5th Cir
Length: 0.05 miles
Directions: E-W, SW-NE
Address range: 14000 to 14199
Directions: E-W, SW-NE
Address range: 14000 to 14199