52nd St Discount Shopping neighborhood in Philadelphia, Pennsylvania (PA), 19139, 19143 detailed profile
Settings
X

Business Search - 14 Million verified businesses
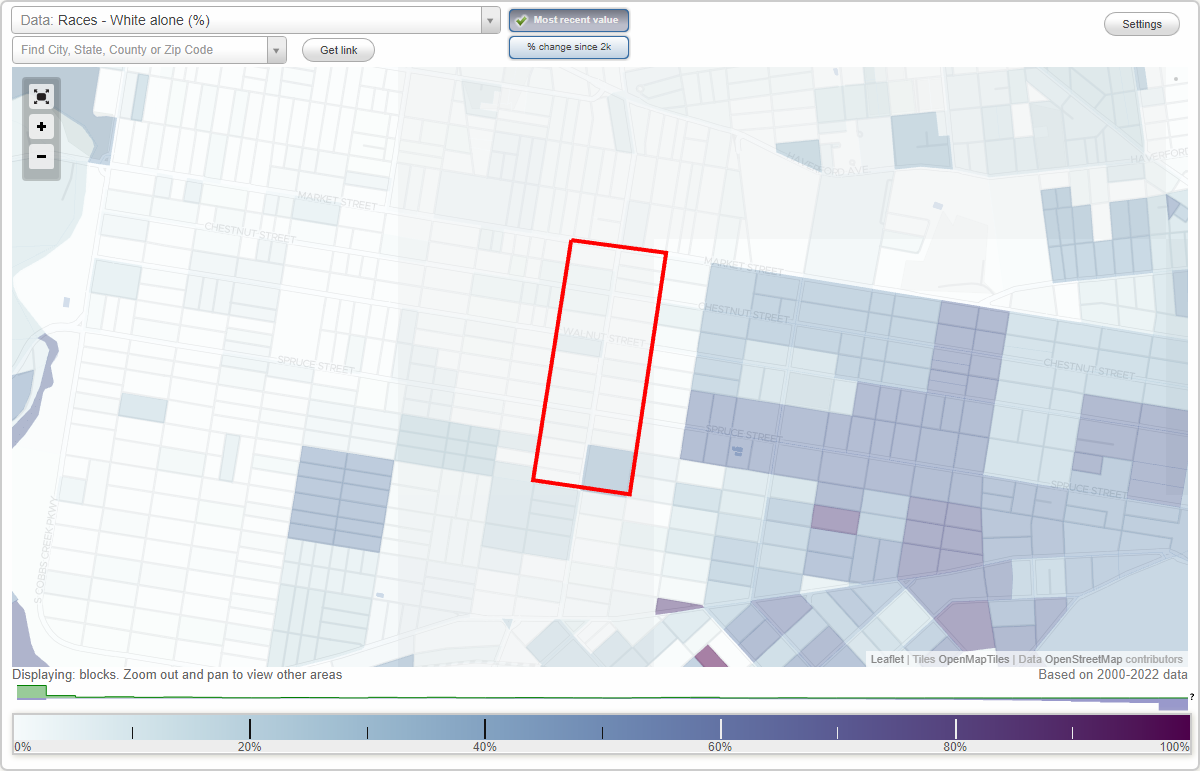
Area: 0.122 square miles
Population: 3,161
Population density:
| 52nd St Discount Shopping: | 26,010 people per square mile |
| Philadelphia: | 11,602 people per square mile |

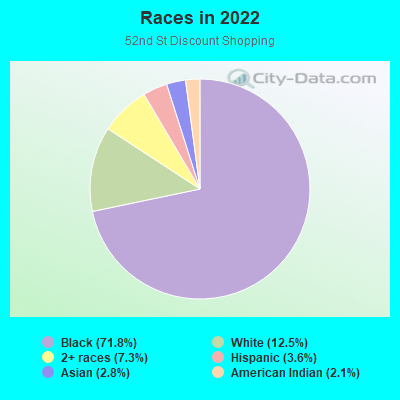
- 2,54971.8%Black
- 44412.5%White
- 2587.3%Two or more races
- 1273.6%Hispanic or Latino
- 1012.8%Asian
- 732.1%American Indian
Distribution of median household income
![Distribution of median household income]()
- 327Less than $10,000
- 454$10,000 to $19,999
- 332$20,000 to $29,999
- 162$30,000 to $39,999
- 273$40,000 to $49,999
- 219$50,000 to $59,999
- 212$60,000 to $74,999
- 213$75,000 to $99,999
- 224$100,000 to $124,999
- 127$125,000 to $149,999
- 87$150,000 to $199,999
- 61$200,000 or more

Distribution of owner-occupied house/condo value
![Distribution of owner-occupied house/condo value]()
- 218Less than $50,000
- 669$50,000 to $99,999
- 467$100,000 to $149,999
- 216$150,000 to $199,999
- 110$200,000 to $249,999
- 169$250,000 to $299,999
- 68$300,000 to $399,999
- 138$400,000 to $499,999
- 42$500,000 to $749,999
- 28$1,000,000 or more

Distribution of rent paid by renters
![Distribution of rent paid by renters]()
- 171$100 to $199
- 201$200 to $299
- 148$300 to $399
- 191$400 to $499
- 174$500 to $599
- 211$600 to $699
- 334$700 to $799
- 94$800 to $899
- 438$900 to $999
- 257$1,000 to $1,249
- 111$1,250 to $1,499
- 199$1,500 to $1,999
- 185$2,000 or more

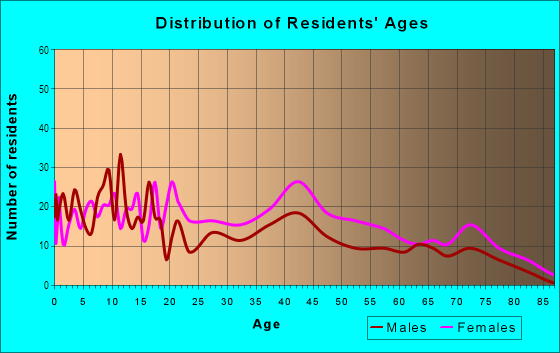
| Males: | 1,563 |
| Females: | 1,597 |
Males:
| This neighborhood: | 34.2 years |
| Whole city: | 34.1 years |
| This neighborhood: | 38.8 years |
| Whole city: | 36.3 years |
Average household size:
| 52nd St Discount Shopping: | 2.2 people |
| Philadelphia: | 2.2 people |
Percentage of family households:
| 52nd St Discount Shopping: | 36.7% |
| Philadelphia: | 36.5% |
| Here: | 31.4% |
| Philadelphia: | 28.0% |
Percentage of married-couple families with children (among all households):
| 52nd St Discount Shopping: | 41.5% |
| Philadelphia: | 23.5% |
Percentage of single-mother households (among all households):
| 52nd St Discount Shopping: | 50.2% |
| Philadelphia: | 17.6% |
Percentage of never married males 15 years old and over:
Percentage of never married females 15 years old and over:
| 52nd St Discount Shopping: | 28.4% |
| Philadelphia: | 23.9% |
Percentage of never married females 15 years old and over:
| 52nd St Discount Shopping: | 24.4% |
| city: | 26.0% |
Percentage of people that speak English not well or not at all:
| 52nd St Discount Shopping: | 1.0% |
| Philadelphia: | 7.0% |
Percentage of people born in this state:
Percentage of people born in another U.S. state:
Percentage of native residents but born outside the U.S.:
Percentage of foreign born residents:
| Here: | 65.7% |
| Philadelphia: | 61.6% |
Percentage of people born in another U.S. state:
| 52nd St Discount Shopping: | 23.8% |
| Philadelphia: | 18.9% |
Percentage of native residents but born outside the U.S.:
| Here: | 1.3% |
| city: | 3.7% |
Percentage of foreign born residents:
| Here: | 9.2% |
| Philadelphia: | 15.7% |
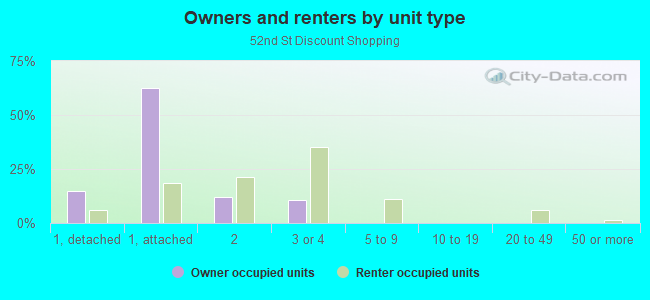
Owner-occupied
Renter-occupied

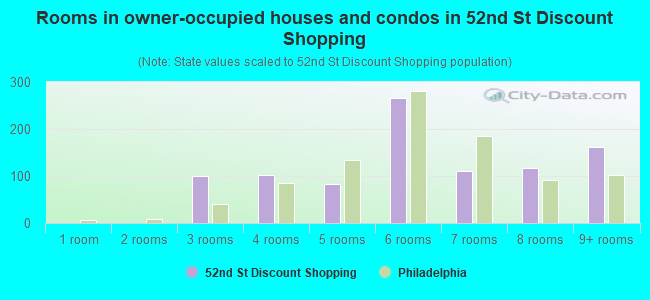
- Rooms in owner-occupied houses and condos in 52nd St Discount Shopping
- 01 room
- 02 rooms
- 1003 rooms
- 1024 rooms
- 825 rooms
- 2656 rooms
- 1107 rooms
- 1168 rooms
- 1619+ rooms
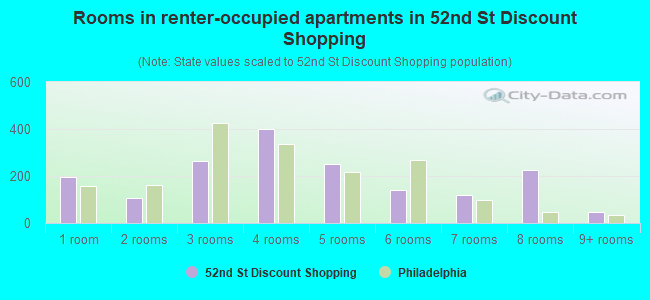
- Rooms in renter-occupied apartments in 52nd St Discount Shopping
- 1961 room
- 1062 rooms
- 2643 rooms
- 4014 rooms
- 2505 rooms
- 1396 rooms
- 1197 rooms
- 2268 rooms
- 459+ rooms
Owner-occupied
Renter-occupied
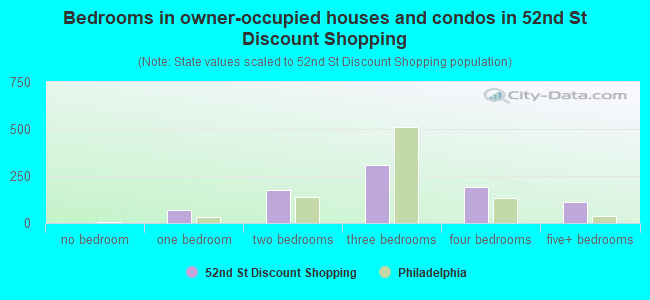
- Bedrooms in owner-occupied houses and condos in 52nd St Discount Shopping
- 0no bedroom
- 681 bedroom
- 1762 bedrooms
- 3093 bedrooms
- 1894 bedrooms
- 1145+ bedrooms
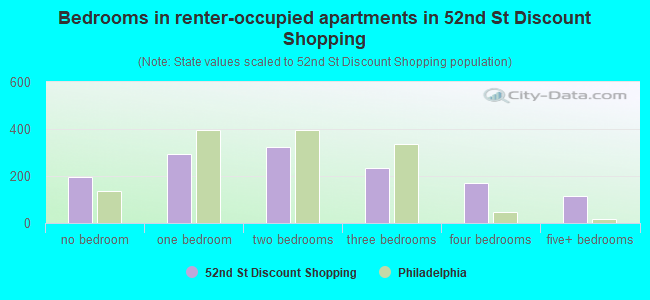
- Bedrooms in renter-occupied apartments in 52nd St Discount Shopping
- 196no bedroom
- 2941 bedroom
- 3232 bedrooms
- 2363 bedrooms
- 1694 bedrooms
- 1165+ bedrooms
Average number of cars or other vehicles available in houses/condos:
Average number of cars or other vehicles available in apartments:
| This neighborhood: | 1.2 |
| Philadelphia: | 1.3 |
Average number of cars or other vehicles available in apartments:
| Here: | 1.0 |
| city: | 0.8 |
Percentage of units with a mortgage:
| 52nd St Discount Shopping: | 51.5% |
| Philadelphia: | 58.9% |
Average estimated value of townhouses or other attached units in 2022 (44.6% of all units):
| This neighborhood: | $147,099 |
| city: | $243,508 |
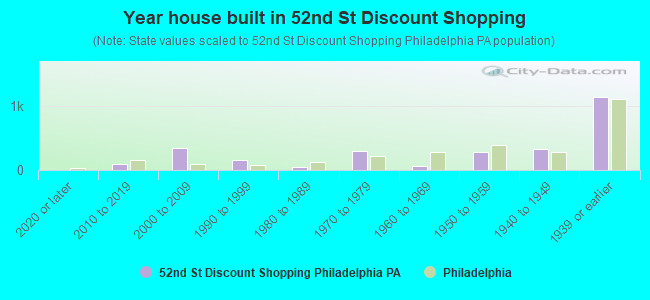
- Year house built in 52nd St Discount Shopping
- 62020 or later
- 992010 to 2019
- 3482000 to 2009
- 1511990 to 1999
- 451980 to 1989
- 3051970 to 1979
- 681960 to 1969
- 2791950 to 1959
- 3351940 to 1949
- 1,1391939 or earlier
City-data.com crime index for city in 2020 (higher means more crime):
| City: | 169.8 |
| U.S. average: | 219.5 |
Travel time to work (commute)
![Travel time to work (commute)]()
- 160Less than 5 minutes
- 655 to 9 minutes
- 4910 to 14 minutes
- 8415 to 19 minutes
- 9620 to 24 minutes
- 6925 to 29 minutes
- 35730 to 34 minutes
- 3435 to 39 minutes
- 4940 to 44 minutes
- 15545 to 59 minutes
- 8260 to 89 minutes
- 14690 or more minutes

Means of transportation to work
![Means of transportation to work]()
- 43.3%685Drove a car alone
- 10.1%160Carpooled
- 28.8%456Bus
- 9.1%144Subway or elevated rail
- 7.8%124Long-distance train or commuter rail
- 1.9%30Light rail, streetcar or trolley
- 6.3%99Taxi
- 8.2%130Bicycle
- 8.2%130Walked
- 4.0%64Other means
- 12.8%202Worked at home

Time leaving home to go to work
![Time leaving home to go to work]()
- 2412:00 a.m. to 4:59 a.m.
- 375:00 a.m. to 5:29 a.m.
- 1085:30 a.m. to 5:59 a.m.
- 396:00 a.m. to 6:29 a.m.
- 576:30 a.m. to 6:59 a.m.
- 1437:00 a.m. to 7:29 a.m.
- 1417:30 a.m. to 7:59 a.m.
- 1178:00 a.m. to 8:29 a.m.
- 578:30 a.m. to 8:59 a.m.
- 1019:00 a.m. to 9:59 a.m.
- 3010:00 a.m. to 10:59 a.m.
- 6011:00 a.m. to 11:59 a.m.
- 19912:00 p.m. to 3:59 p.m.
- 3184:00 p.m. to 11:59 p.m.

Occupations of males:
- Percentage of males in management occupations (except farmers):
Here: 8.6% city: 9.1%
- Percentage of males in business and financial operations occupations:
Here: 9.2% city: 6.0%
- Percentage of males in computer and mathematical occupations:
Here: 5.6% city: 4.6%
- Percentage of males in education, training, and library occupations:
Here: 7.0% city: 4.0%
- Percentage of males in arts, design, entertainment, sports, and media occupations:
Here: 4.0% city: 2.5%
- Percentage of males in healthcare practitioners and technical occupations:
Here: 2.4% city: 4.3%
- Percentage of males in service occupations:
Here: 30.3% city: 19.3%
- Percentage of males in sales and office occupations:
Here: 9.4% city: 14.1%
- Percentage of males in construction, extraction, and maintenance occupations:
Here: 5.1% city: 6.4%
- Percentage of males in production occupations:
Here: 4.4% city: 5.0%
- Percentage of males in transportation occupations:
Here: 1.2% city: 6.9%
- Percentage of males in material moving occupations:
Here: 7.4% city: 6.2%
Occupations of females:
- Percentage of females in management occupations (except farmers):
Here: 9.4% city: 9.1%
- Percentage of females in business and financial operations occupations:
Here: 6.8% city: 6.6%
- Percentage of females in computer and mathematical occupations:
Here: 2.5% city: 1.7%
- Percentage of females in community and social services occupations:
Here: 5.4% city: 3.6%
- Percentage of females in education, training, and library occupations:
Here: 15.1% city: 8.5%
- Percentage of females in arts, design, entertainment, sports, and media occupations:
Here: 2.2% city: 2.4%
- Percentage of females in healthcare practitioners and technical occupations:
Here: 4.8% city: 10.3%
- Percentage of females in service occupations:
Here: 29.4% city: 24.4%
- Percentage of females in sales and office occupations:
Here: 15.8% city: 23.4%
- Percentage of females in production occupations:
Here: 4.3% city: 2.4%
- Percentage of females in material moving occupations:
Here: 4.2% city: 1.7%
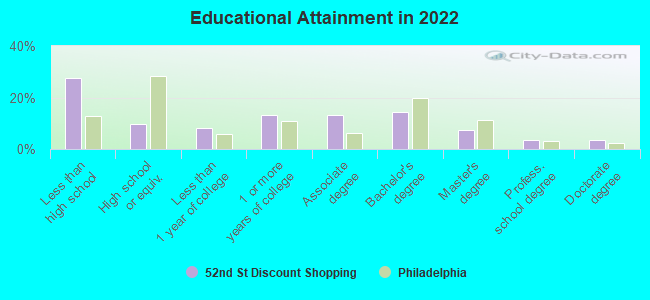
Education in this neighborhood (subdivision or community):
- Percentage of people 3 years and older in K-12 schools:
52nd St Discount Shopping: 43.6% Philadelphia: 15.6%
- Percentage of people 3 years and older in undergraduate colleges:
52nd St Discount Shopping: 17.3% Philadelphia: 6.0%
- Percentage of people 3 years and older in grad. or professional schools:
52nd St Discount Shopping: 12.8% Philadelphia: 2.8%
- Percentage of students K-12 enrolled in private schools:
52nd St Discount Shopping: 18.2% Philadelphia: 25.0%
Percentage of population below poverty level:
| 52nd St Discount Shopping: | 28.9% |
| Philadelphia: | 21.7% |
Median year owner moved in (as recorded in 2022):
Median year renter moved in (as recorded in 2022):
| 52nd St Discount Shopping: | 1998 |
| Philadelphia: | 2007 |
Median year renter moved in (as recorded in 2022):
| 52nd St Discount Shopping: | 2016 |
| Philadelphia: | 2019 |
Percentage of married-couple families with both working:
| 52nd St Discount Shopping: | 205.3% |
| Philadelphia: | 71.4% |
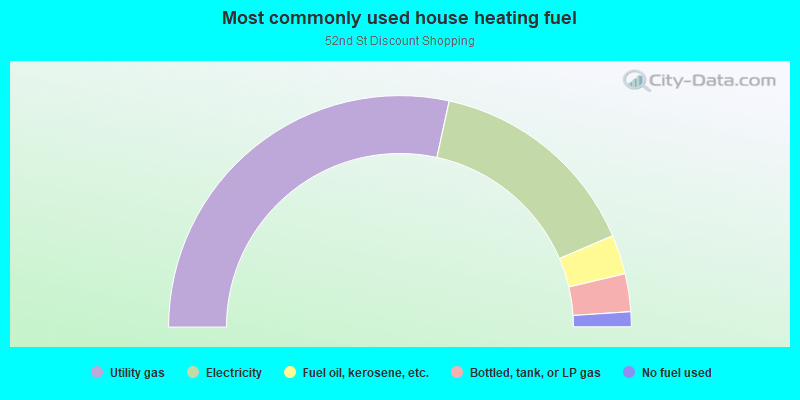
- 56.9%Utility gas
- 30.3%Electricity
- 5.5%Fuel oil, kerosene, etc.
- 5.3%Bottled, tank, or LP gas
- 2.1%No fuel used
Highways in this neighborhood:
S 52nd St
Length: 0.49 miles
Direction: N-S
Address range: 10 to 463
Direction: N-S
Address range: 10 to 463
Walnut St (State Rte 3)
Length: 0.14 miles
Direction: E-W
Address range: 5100 to 5199
Direction: E-W
Address range: 5100 to 5199
State Rte 3 (Chestnut St)
Length: 0.14 miles
Direction: E-W
Address range: 5100 to 5199
Direction: E-W
Address range: 5100 to 5199
Roads and streets:
S 51st St
Length: 0.49 miles
Direction: N-S
Address range: 1 to 448
Direction: N-S
Address range: 1 to 448
Ludlow St
Length: 0.14 miles
Direction: E-W
Address range: 5100 to 5199
Direction: E-W
Address range: 5100 to 5199
Pine St
Length: 0.14 miles
Direction: E-W
Address range: 5100 to 5199
Direction: E-W
Address range: 5100 to 5199
Ranstead St
Length: 0.14 miles
Direction: E-W
Address range: 5100 to 5199
Direction: E-W
Address range: 5100 to 5199
Chancellor St
Length: 0.14 miles
Direction: E-W
Address range: 5100 to 5199
Direction: E-W
Address range: 5100 to 5199
Spruce St
Length: 0.14 miles
Direction: E-W
Address range: 5100 to 5199
Direction: E-W
Address range: 5100 to 5199
Irving St
Length: 0.14 miles
Direction: E-W
Address range: 5100 to 5199
Direction: E-W
Address range: 5100 to 5199
Sansom St
Length: 0.14 miles
Direction: E-W
Address range: 5100 to 5199
Direction: E-W
Address range: 5100 to 5199
Locust St
Length: 0.14 miles
Direction: E-W
Address range: 5100 to 5199
Direction: E-W
Address range: 5100 to 5199
Delancey St
Length: 0.14 miles
Direction: E-W
Address range: 5100 to 5199
Direction: E-W
Address range: 5100 to 5199
Market St
Length: 0.07 miles
Direction: E-W
Address range: 5100 to 5131
Direction: E-W
Address range: 5100 to 5131