Little River, South Carolina Submit your own pictures of this place and show them to the world
OSM Map
General Map
Google Map
MSN Map
OSM Map
General Map
Google Map
MSN Map
OSM Map
General Map
Google Map
MSN Map
OSM Map
General Map
Google Map
MSN Map
Please wait while loading the map...
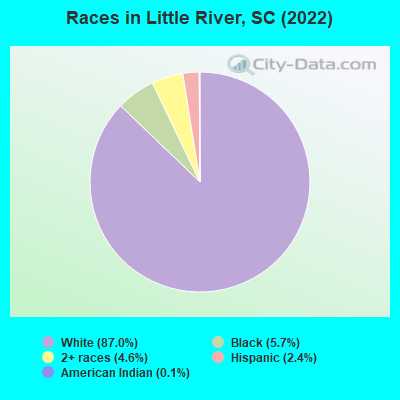
Population in 2010: 8,960. Population change since 2000: +27.5%Males: 4,161 Females: 4,799
March 2022 cost of living index in Little River: 90.5 (less than average, U.S. average is 100) Percentage of residents living in poverty in 2022: 10.4%for White Non-Hispanic residents , 16.6% for Black residents , 6.1% for Hispanic or Latino residents , 35.0% for other race residents )
Profiles of local businesses
Business Search - 14 Million verified businesses
Data:
Median household income ($)
Median household income (% change since 2000)
Household income diversity
Ratio of average income to average house value (%)
Ratio of average income to average rent
Median household income ($) - White
Median household income ($) - Black or African American
Median household income ($) - Asian
Median household income ($) - Hispanic or Latino
Median household income ($) - American Indian and Alaska Native
Median household income ($) - Multirace
Median household income ($) - Other Race
Median household income for houses/condos with a mortgage ($)
Median household income for apartments without a mortgage ($)
Races - White alone (%)
Races - White alone (% change since 2000)
Races - Black alone (%)
Races - Black alone (% change since 2000)
Races - American Indian alone (%)
Races - American Indian alone (% change since 2000)
Races - Asian alone (%)
Races - Asian alone (% change since 2000)
Races - Hispanic (%)
Races - Hispanic (% change since 2000)
Races - Native Hawaiian and Other Pacific Islander alone (%)
Races - Native Hawaiian and Other Pacific Islander alone (% change since 2000)
Races - Two or more races (%)
Races - Two or more races (% change since 2000)
Races - Other race alone (%)
Races - Other race alone (% change since 2000)
Racial diversity
Unemployment (%)
Unemployment (% change since 2000)
Unemployment (%) - White
Unemployment (%) - Black or African American
Unemployment (%) - Asian
Unemployment (%) - Hispanic or Latino
Unemployment (%) - American Indian and Alaska Native
Unemployment (%) - Multirace
Unemployment (%) - Other Race
Population density (people per square mile)
Population - Males (%)
Population - Females (%)
Population - Males (%) - White
Population - Males (%) - Black or African American
Population - Males (%) - Asian
Population - Males (%) - Hispanic or Latino
Population - Males (%) - American Indian and Alaska Native
Population - Males (%) - Multirace
Population - Males (%) - Other Race
Population - Females (%) - White
Population - Females (%) - Black or African American
Population - Females (%) - Asian
Population - Females (%) - Hispanic or Latino
Population - Females (%) - American Indian and Alaska Native
Population - Females (%) - Multirace
Population - Females (%) - Other Race
Coronavirus confirmed cases (May 21, 2024)
Deaths caused by coronavirus (May 21, 2024)
Coronavirus confirmed cases (per 100k population) (May 21, 2024)
Deaths caused by coronavirus (per 100k population) (May 21, 2024)
Daily increase in number of cases (May 21, 2024)
Weekly increase in number of cases (May 21, 2024)
Cases doubled (in days) (May 21, 2024)
Hospitalized patients (Apr 18, 2022)
Negative test results (Apr 18, 2022)
Total test results (Apr 18, 2022)
COVID Vaccine doses distributed (per 100k population) (Sep 19, 2023)
COVID Vaccine doses administered (per 100k population) (Sep 19, 2023)
COVID Vaccine doses distributed (Sep 19, 2023)
COVID Vaccine doses administered (Sep 19, 2023)
Likely homosexual households (%)
Likely homosexual households (% change since 2000)
Likely homosexual households - Lesbian couples (%)
Likely homosexual households - Lesbian couples (% change since 2000)
Likely homosexual households - Gay men (%)
Likely homosexual households - Gay men (% change since 2000)
Cost of living index
Median gross rent ($)
Median contract rent ($)
Median monthly housing costs ($)
Median house or condo value ($)
Median house or condo value ($ change since 2000)
Mean house or condo value by units in structure - 1, detached ($)
Mean house or condo value by units in structure - 1, attached ($)
Mean house or condo value by units in structure - 2 ($)
Mean house or condo value by units in structure by units in structure - 3 or 4 ($)
Mean house or condo value by units in structure - 5 or more ($)
Mean house or condo value by units in structure - Boat, RV, van, etc. ($)
Mean house or condo value by units in structure - Mobile home ($)
Median house or condo value ($) - White
Median house or condo value ($) - Black or African American
Median house or condo value ($) - Asian
Median house or condo value ($) - Hispanic or Latino
Median house or condo value ($) - American Indian and Alaska Native
Median house or condo value ($) - Multirace
Median house or condo value ($) - Other Race
Median resident age
Resident age diversity
Median resident age - Males
Median resident age - Females
Median resident age - White
Median resident age - Black or African American
Median resident age - Asian
Median resident age - Hispanic or Latino
Median resident age - American Indian and Alaska Native
Median resident age - Multirace
Median resident age - Other Race
Median resident age - Males - White
Median resident age - Males - Black or African American
Median resident age - Males - Asian
Median resident age - Males - Hispanic or Latino
Median resident age - Males - American Indian and Alaska Native
Median resident age - Males - Multirace
Median resident age - Males - Other Race
Median resident age - Females - White
Median resident age - Females - Black or African American
Median resident age - Females - Asian
Median resident age - Females - Hispanic or Latino
Median resident age - Females - American Indian and Alaska Native
Median resident age - Females - Multirace
Median resident age - Females - Other Race
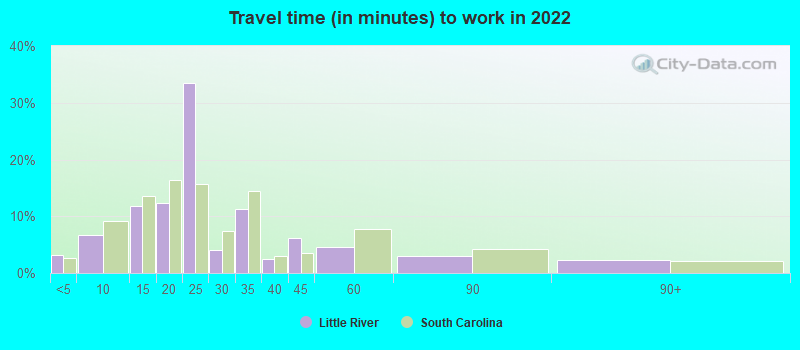
Commute - mean travel time to work (minutes)
Travel time to work - Less than 5 minutes (%)
Travel time to work - Less than 5 minutes (% change since 2000)
Travel time to work - 5 to 9 minutes (%)
Travel time to work - 5 to 9 minutes (% change since 2000)
Travel time to work - 10 to 19 minutes (%)
Travel time to work - 10 to 19 minutes (% change since 2000)
Travel time to work - 20 to 29 minutes (%)
Travel time to work - 20 to 29 minutes (% change since 2000)
Travel time to work - 30 to 39 minutes (%)
Travel time to work - 30 to 39 minutes (% change since 2000)
Travel time to work - 40 to 59 minutes (%)
Travel time to work - 40 to 59 minutes (% change since 2000)
Travel time to work - 60 to 89 minutes (%)
Travel time to work - 60 to 89 minutes (% change since 2000)
Travel time to work - 90 or more minutes (%)
Travel time to work - 90 or more minutes (% change since 2000)
Marital status - Never married (%)
Marital status - Now married (%)
Marital status - Separated (%)
Marital status - Widowed (%)
Marital status - Divorced (%)
Median family income ($)
Median family income (% change since 2000)
Median non-family income ($)
Median non-family income (% change since 2000)
Median per capita income ($)
Median per capita income (% change since 2000)
Median family income ($) - White
Median family income ($) - Black or African American
Median family income ($) - Asian
Median family income ($) - Hispanic or Latino
Median family income ($) - American Indian and Alaska Native
Median family income ($) - Multirace
Median family income ($) - Other Race
Median year house/condo built
Median year apartment built
Year house built - Built 2005 or later (%)
Year house built - Built 2000 to 2004 (%)
Year house built - Built 1990 to 1999 (%)
Year house built - Built 1980 to 1989 (%)
Year house built - Built 1970 to 1979 (%)
Year house built - Built 1960 to 1969 (%)
Year house built - Built 1950 to 1959 (%)
Year house built - Built 1940 to 1949 (%)
Year house built - Built 1939 or earlier (%)
Average household size
Household density (households per square mile)
Average household size - White
Average household size - Black or African American
Average household size - Asian
Average household size - Hispanic or Latino
Average household size - American Indian and Alaska Native
Average household size - Multirace
Average household size - Other Race
Occupied housing units (%)
Vacant housing units (%)
Owner occupied housing units (%)
Renter occupied housing units (%)
Vacancy status - For rent (%)
Vacancy status - For sale only (%)
Vacancy status - Rented or sold, not occupied (%)
Vacancy status - For seasonal, recreational, or occasional use (%)
Vacancy status - For migrant workers (%)
Vacancy status - Other vacant (%)
Residents with income below the poverty level (%)
Residents with income below 50% of the poverty level (%)
Children below poverty level (%)
Poor families by family type - Married-couple family (%)
Poor families by family type - Male, no wife present (%)
Poor families by family type - Female, no husband present (%)
Poverty status for native-born residents (%)
Poverty status for foreign-born residents (%)
Poverty among high school graduates not in families (%)
Poverty among people who did not graduate high school not in families (%)
Residents with income below the poverty level (%) - White
Residents with income below the poverty level (%) - Black or African American
Residents with income below the poverty level (%) - Asian
Residents with income below the poverty level (%) - Hispanic or Latino
Residents with income below the poverty level (%) - American Indian and Alaska Native
Residents with income below the poverty level (%) - Multirace
Residents with income below the poverty level (%) - Other Race
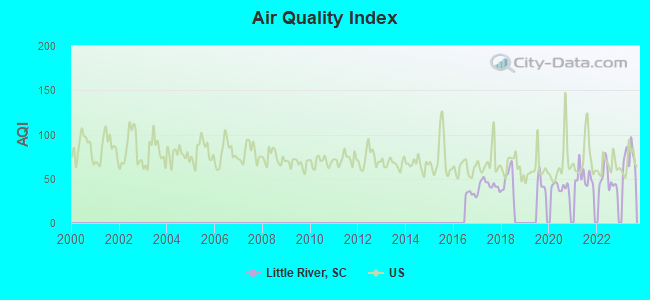
Air pollution - Air Quality Index (AQI)
Air pollution - CO
Air pollution - NO2
Air pollution - SO2
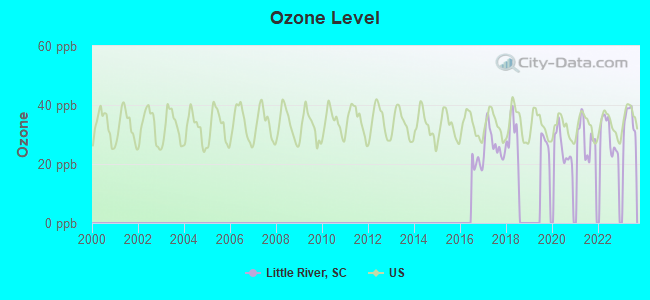
Air pollution - Ozone
Air pollution - PM10
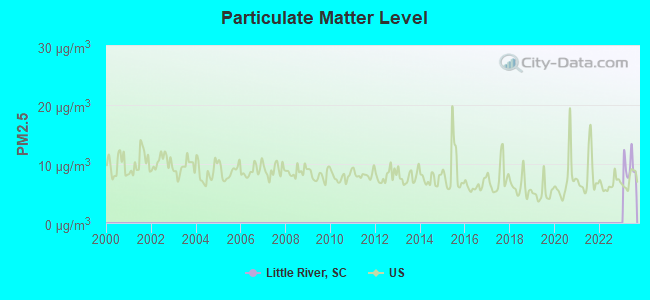
Air pollution - PM25
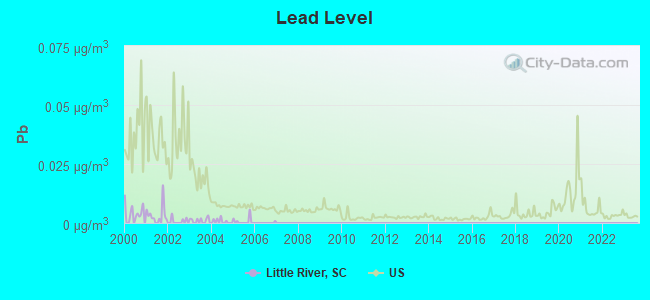
Air pollution - Pb
Crime - Murders per 100,000 population
Crime - Rapes per 100,000 population
Crime - Robberies per 100,000 population
Crime - Assaults per 100,000 population
Crime - Burglaries per 100,000 population
Crime - Thefts per 100,000 population
Crime - Auto thefts per 100,000 population
Crime - Arson per 100,000 population
Crime - City-data.com crime index
Crime - Violent crime index
Crime - Property crime index
Crime - Murders per 100,000 population (5 year average)
Crime - Rapes per 100,000 population (5 year average)
Crime - Robberies per 100,000 population (5 year average)
Crime - Assaults per 100,000 population (5 year average)
Crime - Burglaries per 100,000 population (5 year average)
Crime - Thefts per 100,000 population (5 year average)
Crime - Auto thefts per 100,000 population (5 year average)
Crime - Arson per 100,000 population (5 year average)
Crime - City-data.com crime index (5 year average)
Crime - Violent crime index (5 year average)
Crime - Property crime index (5 year average)
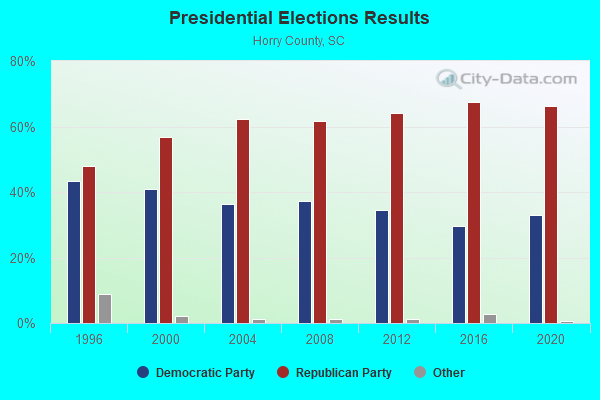
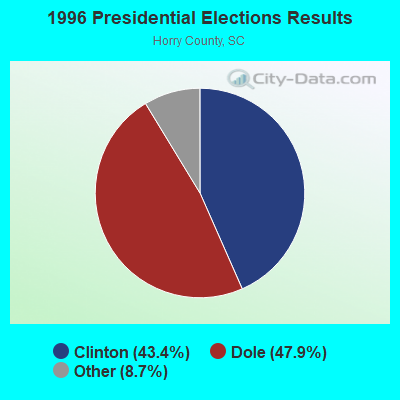
1996 Presidential Elections Results (%) - Democratic Party (Clinton)
1996 Presidential Elections Results (%) - Republican Party (Dole)
1996 Presidential Elections Results (%) - Other
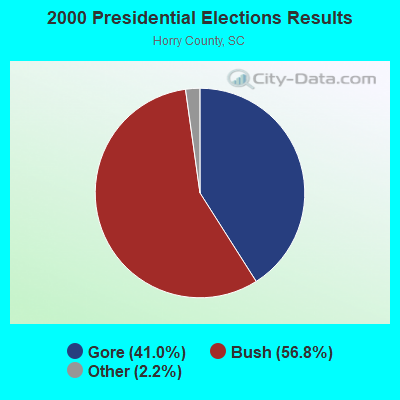
2000 Presidential Elections Results (%) - Democratic Party (Gore)
2000 Presidential Elections Results (%) - Republican Party (Bush)
2000 Presidential Elections Results (%) - Other
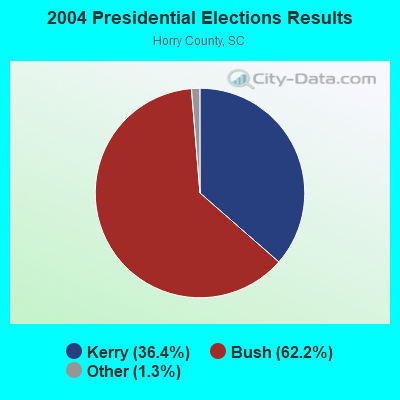
2004 Presidential Elections Results (%) - Democratic Party (Kerry)
2004 Presidential Elections Results (%) - Republican Party (Bush)
2004 Presidential Elections Results (%) - Other
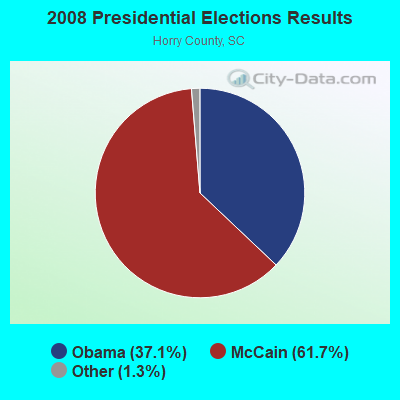
2008 Presidential Elections Results (%) - Democratic Party (Obama)
2008 Presidential Elections Results (%) - Republican Party (McCain)
2008 Presidential Elections Results (%) - Other
2012 Presidential Elections Results (%) - Democratic Party (Obama)
2012 Presidential Elections Results (%) - Republican Party (Romney)
2012 Presidential Elections Results (%) - Other
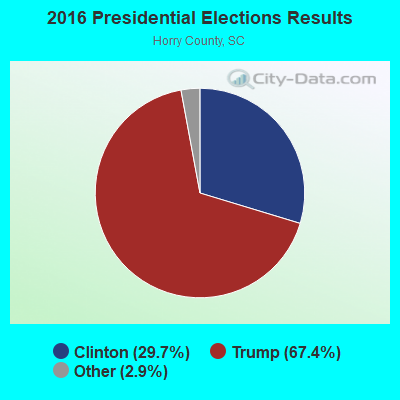
2016 Presidential Elections Results (%) - Democratic Party (Clinton)
2016 Presidential Elections Results (%) - Republican Party (Trump)
2016 Presidential Elections Results (%) - Other
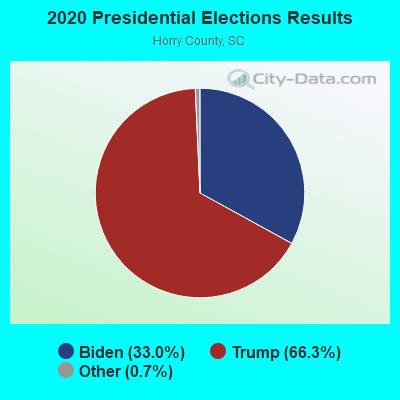
2020 Presidential Elections Results (%) - Democratic Party (Biden)
2020 Presidential Elections Results (%) - Republican Party (Trump)
2020 Presidential Elections Results (%) - Other
Ancestries Reported - Arab (%)
Ancestries Reported - Czech (%)
Ancestries Reported - Danish (%)
Ancestries Reported - Dutch (%)
Ancestries Reported - English (%)
Ancestries Reported - French (%)
Ancestries Reported - French Canadian (%)
Ancestries Reported - German (%)
Ancestries Reported - Greek (%)
Ancestries Reported - Hungarian (%)
Ancestries Reported - Irish (%)
Ancestries Reported - Italian (%)
Ancestries Reported - Lithuanian (%)
Ancestries Reported - Norwegian (%)
Ancestries Reported - Polish (%)
Ancestries Reported - Portuguese (%)
Ancestries Reported - Russian (%)
Ancestries Reported - Scotch-Irish (%)
Ancestries Reported - Scottish (%)
Ancestries Reported - Slovak (%)
Ancestries Reported - Subsaharan African (%)
Ancestries Reported - Swedish (%)
Ancestries Reported - Swiss (%)
Ancestries Reported - Ukrainian (%)
Ancestries Reported - United States (%)
Ancestries Reported - Welsh (%)
Ancestries Reported - West Indian (%)
Ancestries Reported - Other (%)
Educational Attainment - No schooling completed (%)
Educational Attainment - Less than high school (%)
Educational Attainment - High school or equivalent (%)
Educational Attainment - Less than 1 year of college (%)
Educational Attainment - 1 or more years of college (%)
Educational Attainment - Associate degree (%)
Educational Attainment - Bachelor's degree (%)
Educational Attainment - Master's degree (%)
Educational Attainment - Professional school degree (%)
Educational Attainment - Doctorate degree (%)
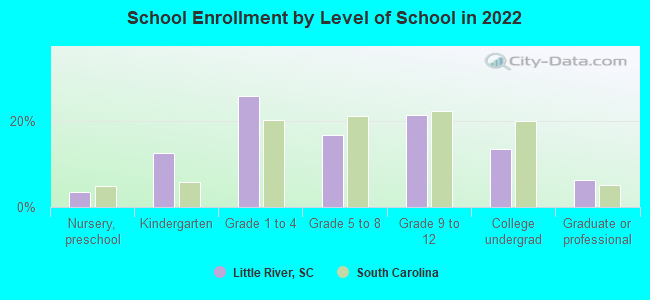
School Enrollment - Nursery, preschool (%)
School Enrollment - Kindergarten (%)
School Enrollment - Grade 1 to 4 (%)
School Enrollment - Grade 5 to 8 (%)
School Enrollment - Grade 9 to 12 (%)
School Enrollment - College undergrad (%)
School Enrollment - Graduate or professional (%)
School Enrollment - Not enrolled in school (%)
School enrollment - Public schools (%)
School enrollment - Private schools (%)
School enrollment - Not enrolled (%)
Median number of rooms in houses and condos
Median number of rooms in apartments
Housing units lacking complete plumbing facilities (%)
Housing units lacking complete kitchen facilities (%)
Density of houses
Urban houses (%)
Rural houses (%)
Households with people 60 years and over (%)
Households with people 65 years and over (%)
Households with people 75 years and over (%)
Households with one or more nonrelatives (%)
Households with no nonrelatives (%)
Population in households (%)
Family households (%)
Nonfamily households (%)
Population in families (%)
Family households with own children (%)
Median number of bedrooms in owner occupied houses
Mean number of bedrooms in owner occupied houses
Median number of bedrooms in renter occupied houses
Mean number of bedrooms in renter occupied houses
Median number of vehichles in owner occupied houses
Mean number of vehichles in owner occupied houses
Median number of vehichles in renter occupied houses
Mean number of vehichles in renter occupied houses
Mortgage status - with mortgage (%)
Mortgage status - with second mortgage (%)
Mortgage status - with home equity loan (%)
Mortgage status - with both second mortgage and home equity loan (%)
Mortgage status - without a mortgage (%)
Average family size
Average family size - White
Average family size - Black or African American
Average family size - Asian
Average family size - Hispanic or Latino
Average family size - American Indian and Alaska Native
Average family size - Multirace
Average family size - Other Race
Geographical mobility - Same house 1 year ago (%)
Geographical mobility - Moved within same county (%)
Geographical mobility - Moved from different county within same state (%)
Geographical mobility - Moved from different state (%)
Geographical mobility - Moved from abroad (%)
Place of birth - Born in state of residence (%)
Place of birth - Born in other state (%)
Place of birth - Native, outside of US (%)
Place of birth - Foreign born (%)
Housing units in structures - 1, detached (%)
Housing units in structures - 1, attached (%)
Housing units in structures - 2 (%)
Housing units in structures - 3 or 4 (%)
Housing units in structures - 5 to 9 (%)
Housing units in structures - 10 to 19 (%)
Housing units in structures - 20 to 49 (%)
Housing units in structures - 50 or more (%)
Housing units in structures - Mobile home (%)
Housing units in structures - Boat, RV, van, etc. (%)
House/condo owner moved in on average (years ago)
Renter moved in on average (years ago)
Year householder moved into unit - Moved in 1999 to March 2000 (%)
Year householder moved into unit - Moved in 1995 to 1998 (%)
Year householder moved into unit - Moved in 1990 to 1994 (%)
Year householder moved into unit - Moved in 1980 to 1989 (%)
Year householder moved into unit - Moved in 1970 to 1979 (%)
Year householder moved into unit - Moved in 1969 or earlier (%)
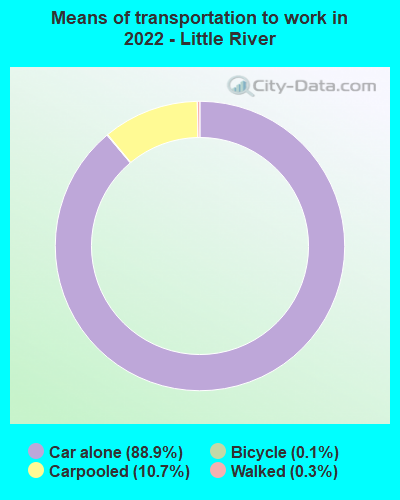
Means of transportation to work - Drove car alone (%)
Means of transportation to work - Carpooled (%)
Means of transportation to work - Public transportation (%)
Means of transportation to work - Bus or trolley bus (%)
Means of transportation to work - Streetcar or trolley car (%)
Means of transportation to work - Subway or elevated (%)
Means of transportation to work - Railroad (%)
Means of transportation to work - Ferryboat (%)
Means of transportation to work - Taxicab (%)
Means of transportation to work - Motorcycle (%)
Means of transportation to work - Bicycle (%)
Means of transportation to work - Walked (%)
Means of transportation to work - Other means (%)
Working at home (%)
Industry diversity
Most Common Industries - Agriculture, forestry, fishing and hunting, and mining (%)
Most Common Industries - Agriculture, forestry, fishing and hunting (%)
Most Common Industries - Mining, quarrying, and oil and gas extraction (%)
Most Common Industries - Construction (%)
Most Common Industries - Manufacturing (%)
Most Common Industries - Wholesale trade (%)
Most Common Industries - Retail trade (%)
Most Common Industries - Transportation and warehousing, and utilities (%)
Most Common Industries - Transportation and warehousing (%)
Most Common Industries - Utilities (%)
Most Common Industries - Information (%)
Most Common Industries - Finance and insurance, and real estate and rental and leasing (%)
Most Common Industries - Finance and insurance (%)
Most Common Industries - Real estate and rental and leasing (%)
Most Common Industries - Professional, scientific, and management, and administrative and waste management services (%)
Most Common Industries - Professional, scientific, and technical services (%)
Most Common Industries - Management of companies and enterprises (%)
Most Common Industries - Administrative and support and waste management services (%)
Most Common Industries - Educational services, and health care and social assistance (%)
Most Common Industries - Educational services (%)
Most Common Industries - Health care and social assistance (%)
Most Common Industries - Arts, entertainment, and recreation, and accommodation and food services (%)
Most Common Industries - Arts, entertainment, and recreation (%)
Most Common Industries - Accommodation and food services (%)
Most Common Industries - Other services, except public administration (%)
Most Common Industries - Public administration (%)
Occupation diversity
Most Common Occupations - Management, business, science, and arts occupations (%)
Most Common Occupations - Management, business, and financial occupations (%)
Most Common Occupations - Management occupations (%)
Most Common Occupations - Business and financial operations occupations (%)
Most Common Occupations - Computer, engineering, and science occupations (%)
Most Common Occupations - Computer and mathematical occupations (%)
Most Common Occupations - Architecture and engineering occupations (%)
Most Common Occupations - Life, physical, and social science occupations (%)
Most Common Occupations - Education, legal, community service, arts, and media occupations (%)
Most Common Occupations - Community and social service occupations (%)
Most Common Occupations - Legal occupations (%)
Most Common Occupations - Education, training, and library occupations (%)
Most Common Occupations - Arts, design, entertainment, sports, and media occupations (%)
Most Common Occupations - Healthcare practitioners and technical occupations (%)
Most Common Occupations - Health diagnosing and treating practitioners and other technical occupations (%)
Most Common Occupations - Health technologists and technicians (%)
Most Common Occupations - Service occupations (%)
Most Common Occupations - Healthcare support occupations (%)
Most Common Occupations - Protective service occupations (%)
Most Common Occupations - Fire fighting and prevention, and other protective service workers including supervisors (%)
Most Common Occupations - Law enforcement workers including supervisors (%)
Most Common Occupations - Food preparation and serving related occupations (%)
Most Common Occupations - Building and grounds cleaning and maintenance occupations (%)
Most Common Occupations - Personal care and service occupations (%)
Most Common Occupations - Sales and office occupations (%)
Most Common Occupations - Sales and related occupations (%)
Most Common Occupations - Office and administrative support occupations (%)
Most Common Occupations - Natural resources, construction, and maintenance occupations (%)
Most Common Occupations - Farming, fishing, and forestry occupations (%)
Most Common Occupations - Construction and extraction occupations (%)
Most Common Occupations - Installation, maintenance, and repair occupations (%)
Most Common Occupations - Production, transportation, and material moving occupations (%)
Most Common Occupations - Production occupations (%)
Most Common Occupations - Transportation occupations (%)
Most Common Occupations - Material moving occupations (%)
People in Group quarters - Institutionalized population (%)
People in Group quarters - Correctional institutions (%)
People in Group quarters - Federal prisons and detention centers (%)
People in Group quarters - Halfway houses (%)
People in Group quarters - Local jails and other confinement facilities (including police lockups) (%)
People in Group quarters - Military disciplinary barracks (%)
People in Group quarters - State prisons (%)
People in Group quarters - Other types of correctional institutions (%)
People in Group quarters - Nursing homes (%)
People in Group quarters - Hospitals/wards, hospices, and schools for the handicapped (%)
People in Group quarters - Hospitals/wards and hospices for chronically ill (%)
People in Group quarters - Hospices or homes for chronically ill (%)
People in Group quarters - Military hospitals or wards for chronically ill (%)
People in Group quarters - Other hospitals or wards for chronically ill (%)
People in Group quarters - Hospitals or wards for drug/alcohol abuse (%)
People in Group quarters - Mental (Psychiatric) hospitals or wards (%)
People in Group quarters - Schools, hospitals, or wards for the mentally retarded (%)
People in Group quarters - Schools, hospitals, or wards for the physically handicapped (%)
People in Group quarters - Institutions for the deaf (%)
People in Group quarters - Institutions for the blind (%)
People in Group quarters - Orthopedic wards and institutions for the physically handicapped (%)
People in Group quarters - Wards in general hospitals for patients who have no usual home elsewhere (%)
People in Group quarters - Wards in military hospitals for patients who have no usual home elsewhere (%)
People in Group quarters - Juvenile institutions (%)
People in Group quarters - Long-term care (%)
People in Group quarters - Homes for abused, dependent, and neglected children (%)
People in Group quarters - Residential treatment centers for emotionally disturbed children (%)
People in Group quarters - Training schools for juvenile delinquents (%)
People in Group quarters - Short-term care, detention or diagnostic centers for delinquent children (%)
People in Group quarters - Type of juvenile institution unknown (%)
People in Group quarters - Noninstitutionalized population (%)
People in Group quarters - College dormitories (includes college quarters off campus) (%)
People in Group quarters - Military quarters (%)
People in Group quarters - On base (%)
People in Group quarters - Barracks, unaccompanied personnel housing (UPH), (Enlisted/Officer), ;and similar group living quarters for military personnel (%)
People in Group quarters - Transient quarters for temporary residents (%)
People in Group quarters - Military ships (%)
People in Group quarters - Group homes (%)
People in Group quarters - Homes or halfway houses for drug/alcohol abuse (%)
People in Group quarters - Homes for the mentally ill (%)
People in Group quarters - Homes for the mentally retarded (%)
People in Group quarters - Homes for the physically handicapped (%)
People in Group quarters - Other group homes (%)
People in Group quarters - Religious group quarters (%)
People in Group quarters - Dormitories (%)
People in Group quarters - Agriculture workers' dormitories on farms (%)
People in Group quarters - Job Corps and vocational training facilities (%)
People in Group quarters - Other workers' dormitories (%)
People in Group quarters - Crews of maritime vessels (%)
People in Group quarters - Other nonhousehold living situations (%)
People in Group quarters - Other noninstitutional group quarters (%)
Residents speaking English at home (%)
Residents speaking English at home - Born in the United States (%)
Residents speaking English at home - Native, born elsewhere (%)
Residents speaking English at home - Foreign born (%)
Residents speaking Spanish at home (%)
Residents speaking Spanish at home - Born in the United States (%)
Residents speaking Spanish at home - Native, born elsewhere (%)
Residents speaking Spanish at home - Foreign born (%)
Residents speaking other language at home (%)
Residents speaking other language at home - Born in the United States (%)
Residents speaking other language at home - Native, born elsewhere (%)
Residents speaking other language at home - Foreign born (%)
Class of Workers - Employee of private company (%)
Class of Workers - Self-employed in own incorporated business (%)
Class of Workers - Private not-for-profit wage and salary workers (%)
Class of Workers - Local government workers (%)
Class of Workers - State government workers (%)
Class of Workers - Federal government workers (%)
Class of Workers - Self-employed workers in own not incorporated business and Unpaid family workers (%)
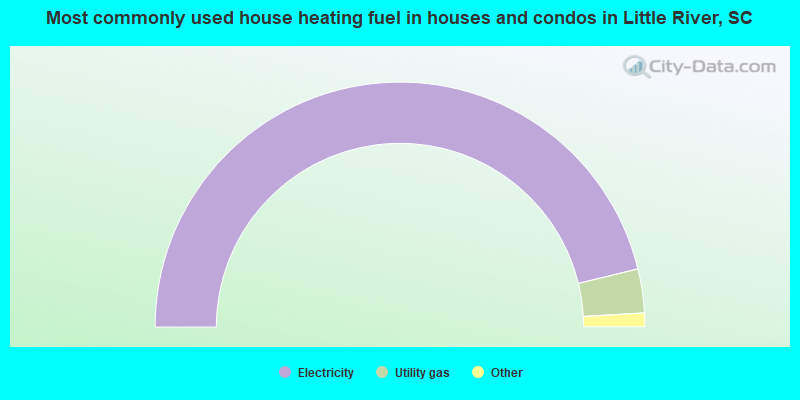
House heating fuel used in houses and condos - Utility gas (%)
House heating fuel used in houses and condos - Bottled, tank, or LP gas (%)
House heating fuel used in houses and condos - Electricity (%)
House heating fuel used in houses and condos - Fuel oil, kerosene, etc. (%)
House heating fuel used in houses and condos - Coal or coke (%)
House heating fuel used in houses and condos - Wood (%)
House heating fuel used in houses and condos - Solar energy (%)
House heating fuel used in houses and condos - Other fuel (%)
House heating fuel used in houses and condos - No fuel used (%)
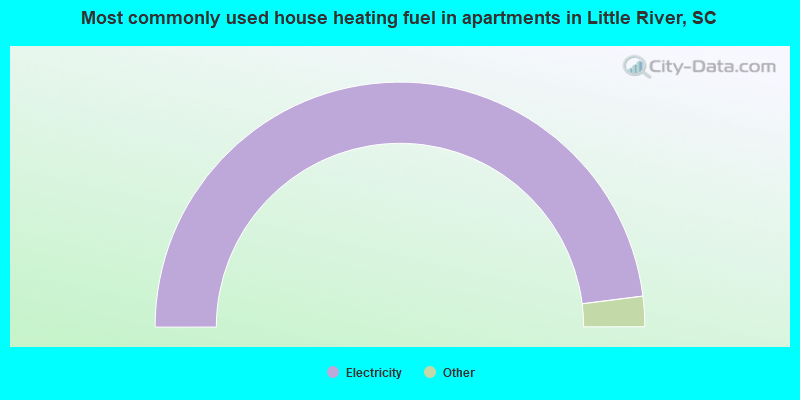
House heating fuel used in apartments - Utility gas (%)
House heating fuel used in apartments - Bottled, tank, or LP gas (%)
House heating fuel used in apartments - Electricity (%)
House heating fuel used in apartments - Fuel oil, kerosene, etc. (%)
House heating fuel used in apartments - Coal or coke (%)
House heating fuel used in apartments - Wood (%)
House heating fuel used in apartments - Solar energy (%)
House heating fuel used in apartments - Other fuel (%)
House heating fuel used in apartments - No fuel used (%)
Armed forces status - In Armed Forces (%)
Armed forces status - Civilian (%)
Armed forces status - Civilian - Veteran (%)
Armed forces status - Civilian - Nonveteran (%)
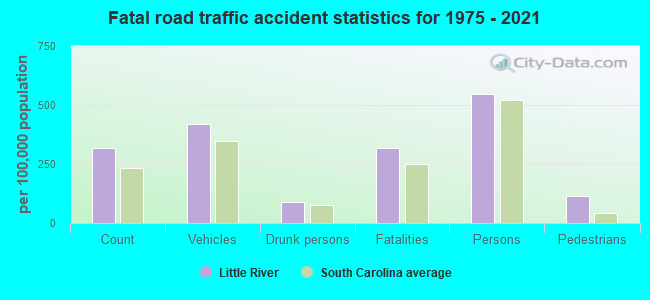
Fatal accidents locations in years 2005-2021
Fatal accidents locations in 2005
Fatal accidents locations in 2006
Fatal accidents locations in 2007
Fatal accidents locations in 2008
Fatal accidents locations in 2009
Fatal accidents locations in 2010
Fatal accidents locations in 2011
Fatal accidents locations in 2012
Fatal accidents locations in 2013
Fatal accidents locations in 2014
Fatal accidents locations in 2015
Fatal accidents locations in 2016
Fatal accidents locations in 2017
Fatal accidents locations in 2018
Fatal accidents locations in 2019
Fatal accidents locations in 2020
Fatal accidents locations in 2021
Alcohol use - People drinking some alcohol every month (%)
Alcohol use - People not drinking at all (%)
Alcohol use - Average days/month drinking alcohol
Alcohol use - Average drinks/week
Alcohol use - Average days/year people drink much
Audiometry - Average condition of hearing (%)
Audiometry - People that can hear a whisper from across a quiet room (%)
Audiometry - People that can hear normal voice from across a quiet room (%)
Audiometry - Ears ringing, roaring, buzzing (%)
Audiometry - Had a job exposure to loud noise (%)
Audiometry - Had off-work exposure to loud noise (%)
Blood Pressure & Cholesterol - Has high blood pressure (%)
Blood Pressure & Cholesterol - Checking blood pressure at home (%)
Blood Pressure & Cholesterol - Frequently checking blood cholesterol (%)
Blood Pressure & Cholesterol - Has high cholesterol level (%)
Consumer Behavior - Money monthly spent on food at supermarket/grocery store
Consumer Behavior - Money monthly spent on food at other stores
Consumer Behavior - Money monthly spent on eating out
Consumer Behavior - Money monthly spent on carryout/delivered foods
Consumer Behavior - Income spent on food at supermarket/grocery store (%)
Consumer Behavior - Income spent on food at other stores (%)
Consumer Behavior - Income spent on eating out (%)
Consumer Behavior - Income spent on carryout/delivered foods (%)
Current Health Status - General health condition (%)
Current Health Status - Blood donors (%)
Current Health Status - Has blood ever tested for HIV virus (%)
Current Health Status - Left-handed people (%)
Dermatology - People using sunscreen (%)
Diabetes - Diabetics (%)
Diabetes - Had a blood test for high blood sugar (%)
Diabetes - People taking insulin (%)
Diet Behavior & Nutrition - Diet health (%)
Diet Behavior & Nutrition - Milk product consumption (# of products/month)
Diet Behavior & Nutrition - Meals not home prepared (#/week)
Diet Behavior & Nutrition - Meals from fast food or pizza place (#/week)
Diet Behavior & Nutrition - Ready-to-eat foods (#/month)
Diet Behavior & Nutrition - Frozen meals/pizza (#/month)
Drug Use - People that ever used marijuana or hashish (%)
Drug Use - Ever used hard drugs (%)
Drug Use - Ever used any form of cocaine (%)
Drug Use - Ever used heroin (%)
Drug Use - Ever used methamphetamine (%)
Health Insurance - People covered by health insurance (%)
Kidney Conditions-Urology - Avg. # of times urinating at night
Medical Conditions - People with asthma (%)
Medical Conditions - People with anemia (%)
Medical Conditions - People with psoriasis (%)
Medical Conditions - People with overweight (%)
Medical Conditions - Elderly people having difficulties in thinking or remembering (%)
Medical Conditions - People who ever received blood transfusion (%)
Medical Conditions - People having trouble seeing even with glass/contacts (%)
Medical Conditions - People with arthritis (%)
Medical Conditions - People with gout (%)
Medical Conditions - People with congestive heart failure (%)
Medical Conditions - People with coronary heart disease (%)
Medical Conditions - People with angina pectoris (%)
Medical Conditions - People who ever had heart attack (%)
Medical Conditions - People who ever had stroke (%)
Medical Conditions - People with emphysema (%)
Medical Conditions - People with thyroid problem (%)
Medical Conditions - People with chronic bronchitis (%)
Medical Conditions - People with any liver condition (%)
Medical Conditions - People who ever had cancer or malignancy (%)
Mental Health - People who have little interest in doing things (%)
Mental Health - People feeling down, depressed, or hopeless (%)
Mental Health - People who have trouble sleeping or sleeping too much (%)
Mental Health - People feeling tired or having little energy (%)
Mental Health - People with poor appetite or overeating (%)
Mental Health - People feeling bad about themself (%)
Mental Health - People who have trouble concentrating on things (%)
Mental Health - People moving or speaking slowly or too fast (%)
Mental Health - People having thoughts they would be better off dead (%)
Oral Health - Average years since last visit a dentist
Oral Health - People embarrassed because of mouth (%)
Oral Health - People with gum disease (%)
Oral Health - General health of teeth and gums (%)
Oral Health - Average days a week using dental floss/device
Oral Health - Average days a week using mouthwash for dental problem
Oral Health - Average number of teeth
Pesticide Use - Households using pesticides to control insects (%)
Pesticide Use - Households using pesticides to kill weeds (%)
Physical Activity - People doing vigorous-intensity work activities (%)
Physical Activity - People doing moderate-intensity work activities (%)
Physical Activity - People walking or bicycling (%)
Physical Activity - People doing vigorous-intensity recreational activities (%)
Physical Activity - People doing moderate-intensity recreational activities (%)
Physical Activity - Average hours a day doing sedentary activities
Physical Activity - Average hours a day watching TV or videos
Physical Activity - Average hours a day using computer
Physical Functioning - People having limitations keeping them from working (%)
Physical Functioning - People limited in amount of work they can do (%)
Physical Functioning - People that need special equipment to walk (%)
Physical Functioning - People experiencing confusion/memory problems (%)
Physical Functioning - People requiring special healthcare equipment (%)
Prescription Medications - Average number of prescription medicines taking
Preventive Aspirin Use - Adults 40+ taking low-dose aspirin (%)
Reproductive Health - Vaginal deliveries (%)
Reproductive Health - Cesarean deliveries (%)
Reproductive Health - Deliveries resulted in a live birth (%)
Reproductive Health - Pregnancies resulted in a delivery (%)
Reproductive Health - Women breastfeeding newborns (%)
Reproductive Health - Women that had a hysterectomy (%)
Reproductive Health - Women that had both ovaries removed (%)
Reproductive Health - Women that have ever taken birth control pills (%)
Reproductive Health - Women taking birth control pills (%)
Reproductive Health - Women that have ever used Depo-Provera or injectables (%)
Reproductive Health - Women that have ever used female hormones (%)
Sexual Behavior - People 18+ that ever had sex (vaginal, anal, or oral) (%)
Sexual Behavior - Males 18+ that ever had vaginal sex with a woman (%)
Sexual Behavior - Males 18+ that ever performed oral sex on a woman (%)
Sexual Behavior - Males 18+ that ever had anal sex with a woman (%)
Sexual Behavior - Males 18+ that ever had any sex with a man (%)
Sexual Behavior - Females 18+ that ever had vaginal sex with a man (%)
Sexual Behavior - Females 18+ that ever performed oral sex on a man (%)
Sexual Behavior - Females 18+ that ever had anal sex with a man (%)
Sexual Behavior - Females 18+ that ever had any kind of sex with a woman (%)
Sexual Behavior - Average age people first had sex
Sexual Behavior - Average number of female sex partners in lifetime (males 18+)
Sexual Behavior - Average number of female vaginal sex partners in lifetime (males 18+)
Sexual Behavior - Average age people first performed oral sex on a woman (18+)
Sexual Behavior - Average number of woman performed oral sex on in lifetime (18+)
Sexual Behavior - Average number of male sex partners in lifetime (males 18+)
Sexual Behavior - Average number of male anal sex partners in lifetime (males 18+)
Sexual Behavior - Average age people first performed oral sex on a man (18+)
Sexual Behavior - Average number of male oral sex partners in lifetime (18+)
Sexual Behavior - People using protection when performing oral sex (%)
Sexual Behavior - Average number of times people have vaginal or anal sex a year
Sexual Behavior - People having sex without condom (%)
Sexual Behavior - Average number of male sex partners in lifetime (females 18+)
Sexual Behavior - Average number of male vaginal sex partners in lifetime (females 18+)
Sexual Behavior - Average number of female sex partners in lifetime (females 18+)
Sexual Behavior - Circumcised males 18+ (%)
Sleep Disorders - Average hours sleeping at night
Sleep Disorders - People that has trouble sleeping (%)
Smoking-Cigarette Use - People smoking cigarettes (%)
Taste & Smell - People 40+ having problems with smell (%)
Taste & Smell - People 40+ having problems with taste (%)
Taste & Smell - People 40+ that ever had wisdom teeth removed (%)
Taste & Smell - People 40+ that ever had tonsils teeth removed (%)
Taste & Smell - People 40+ that ever had a loss of consciousness because of a head injury (%)
Taste & Smell - People 40+ that ever had a broken nose or other serious injury to face or skull (%)
Taste & Smell - People 40+ that ever had two or more sinus infections (%)
Weight - Average height (inches)
Weight - Average weight (pounds)
Weight - Average BMI
Weight - People that are obese (%)
Weight - People that ever were obese (%)
Weight - People trying to lose weight (%)
Latest news from Little River, SC collected exclusively by city-data.com from local newspapers, TV, and radio stations
Little River, SC City Guides: Ancestries: European (21.8%), American (15.2%), English (13.2%), German (6.5%), Italian (5.9%), Irish (5.4%).
Current Local Time:
Land area: 10.5 square miles.
Population density: 857 people per square mile (low).
369 residents are foreign born (2.2% Europe , 0.9% Latin America , 0.5% Asia ).
This place:
3.5%South Carolina:
5.3%
Median real estate property taxes paid for housing units with mortgages in 2022: $832 (0.3%)Median real estate property taxes paid for housing units with no mortgage in 2022: $693 (0.2%)
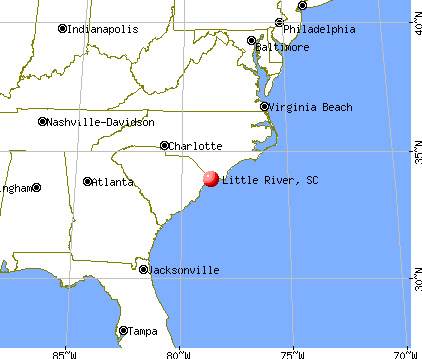
Nearest city with pop. 50,000+: Wilmington, NC
Nearest city with pop. 200,000+: Raleigh, NC
Nearest city with pop. 1,000,000+: Philadelphia, PA
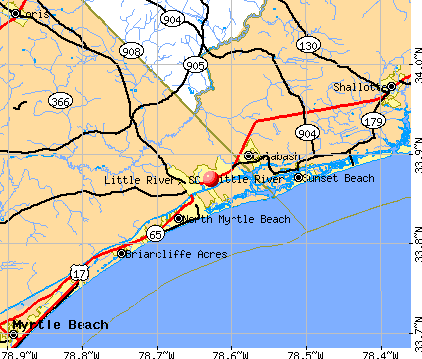
Nearest cities:
Latitude: 33.87 N, Longitude: 78.63 W
Daytime population change due to commuting: +247 (+2.3%)Workers who live and work in this place: 918 (22.6%)
Area code commonly used in this area: 843
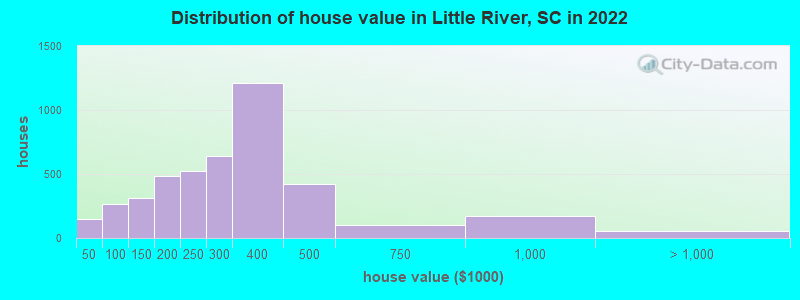
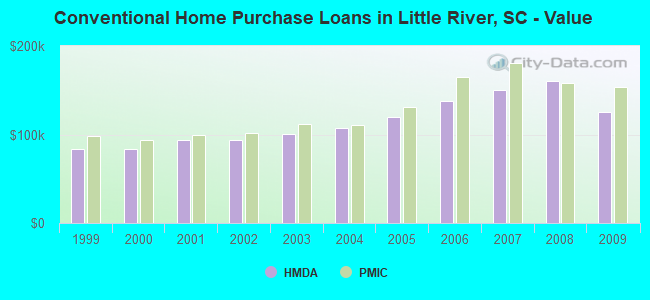
Property values in Little River, SC
Unemployment in December 2023: Here:
3.9%South Carolina:
3.1%
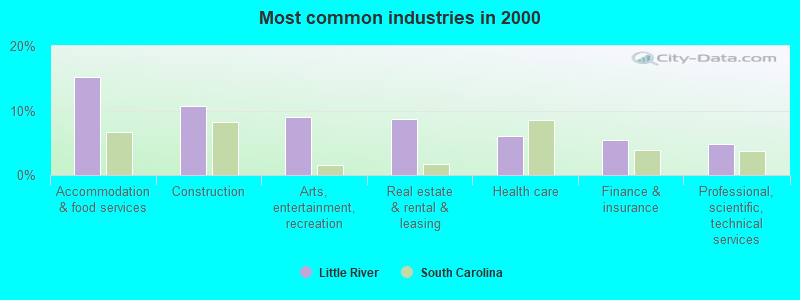
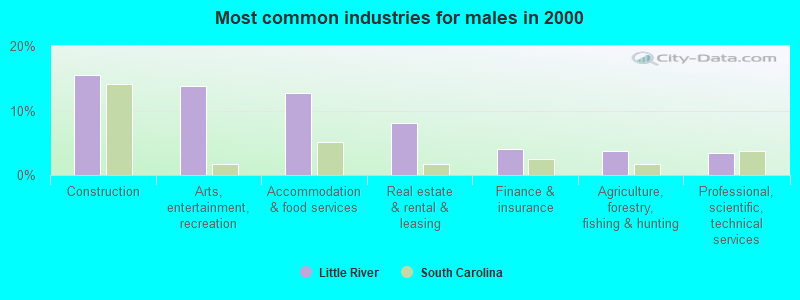
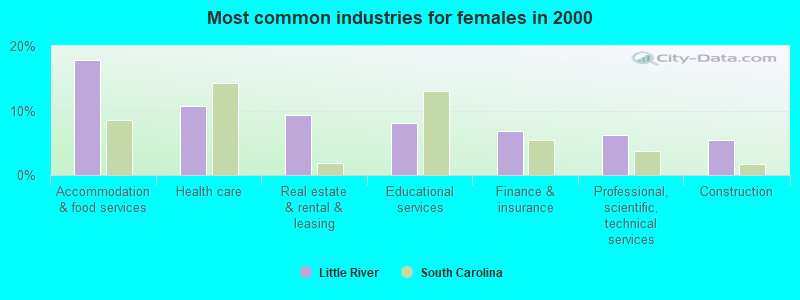
Most common industries in Little River, SC (%)
Both Males Females
Accommodation & food services (15.1%)
Construction (10.7%)
Arts, entertainment, recreation (9.0%)
Real estate & rental & leasing (8.7%)
Health care (6.1%)
Finance & insurance (5.4%)
Professional, scientific, technical services (4.7%)
Construction (15.6%)
Arts, entertainment, recreation (13.9%)
Accommodation & food services (12.6%)
Real estate & rental & leasing (8.1%)
Finance & insurance (4.0%)
Agriculture, forestry, fishing & hunting (3.7%)
Professional, scientific, technical services (3.4%)
Accommodation & food services (17.8%)
Health care (10.7%)
Real estate & rental & leasing (9.3%)
Educational services (8.1%)
Finance & insurance (6.9%)
Professional, scientific, technical services (6.2%)
Construction (5.5%)
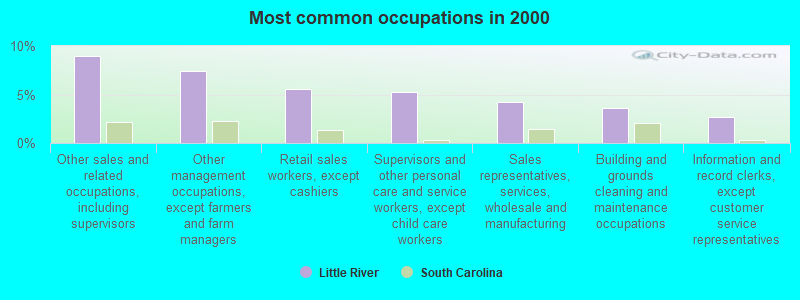
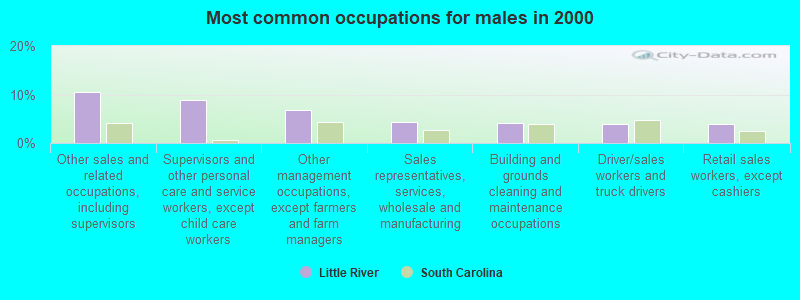
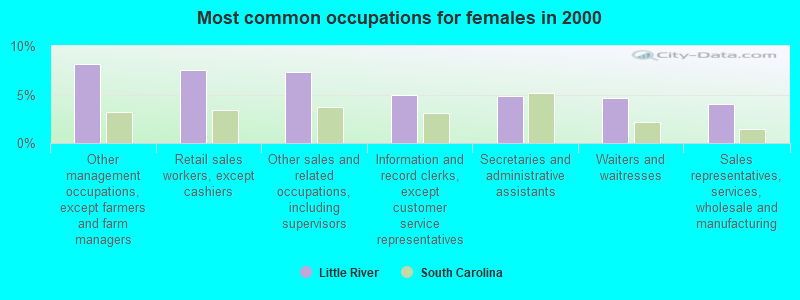
Most common occupations in Little River, SC (%)
Both Males Females
Other sales and related occupations, including supervisors (9.0%)
Other management occupations, except farmers and farm managers (7.4%)
Retail sales workers, except cashiers (5.6%)
Supervisors and other personal care and service workers, except child care workers (5.2%)
Sales representatives, services, wholesale and manufacturing (4.2%)
Building and grounds cleaning and maintenance occupations (3.6%)
Information and record clerks, except customer service representatives (2.6%)
Other sales and related occupations, including supervisors (10.5%)
Supervisors and other personal care and service workers, except child care workers (8.8%)
Other management occupations, except farmers and farm managers (6.8%)
Sales representatives, services, wholesale and manufacturing (4.4%)
Building and grounds cleaning and maintenance occupations (4.2%)
Driver/sales workers and truck drivers (3.9%)
Retail sales workers, except cashiers (3.8%)
Other management occupations, except farmers and farm managers (8.1%)
Retail sales workers, except cashiers (7.5%)
Other sales and related occupations, including supervisors (7.3%)
Information and record clerks, except customer service representatives (4.9%)
Secretaries and administrative assistants (4.9%)
Waiters and waitresses (4.6%)
Sales representatives, services, wholesale and manufacturing (4.0%)
Tornado activity:
Little River-area historical tornado activity is below South Carolina state average. It is 33% smaller than the overall U.S. average.
On 8/17/1965, a category F3 (max. wind speeds 158-206 mph) tornado 3.8 miles away from the Little River place center injured 46 people and caused between $50,000 and $500,000 in damages.
On 11/7/1995, a category F4 (max. wind speeds 207-260 mph) tornado 40.1 miles away from the place center injured one person and caused between $500,000 and $5,000,000 in damages.
Earthquake activity:
Little River-area historical earthquake activity is significantly above South Carolina state average. It is 58% smaller than the overall U.S. average. On 8/23/2011 at 17:51:04, a magnitude 5.8 (5.8 MW, Depth: 3.7 mi, Class: Moderate, Intensity: VI - VII) earthquake occurred 282.0 miles away from the city center On 11/22/1974 at 05:25:55, a magnitude 4.7 (4.7 MB, Class: Light, Intensity: IV - V) earthquake occurred 110.4 miles away from the city center On 8/9/2020 at 12:07:37, a magnitude 5.1 (5.1 MW, Depth: 4.7 mi) earthquake occurred 227.7 miles away from Little River center On 8/21/1992 at 16:31:55, a magnitude 4.4 (4.1 MB, 4.1 LG, 4.4 LG, Depth: 6.2 mi) earthquake occurred 103.0 miles away from the city center On 8/2/1974 at 08:52:09, a magnitude 4.9 (4.3 MB, 4.9 LG) earthquake occurred 221.7 miles away from Little River center On 9/25/2006 at 05:44:20, a magnitude 3.7 (3.7 ML, Depth: 3.1 mi, Class: Light, Intensity: II - III) earthquake occurred 63.0 miles away from the city center Magnitude types: regional Lg-wave magnitude (LG), body-wave magnitude (MB), local magnitude (ML), moment magnitude (MW) Natural disasters: The number of natural disasters in Horry County (22) is greater than the US average (15).Major Disasters (Presidential) Declared: 10Emergencies Declared: 5Hurricanes: 12, Fires: 3, Floods: 2, Storms: 2, Winter Storms: 2, Ice Storm: 1, Tropical Storm: 1, Other: 1 (Note: some incidents may be assigned to more than one category). Hospitals and medical centers near Little River: GRAND STRAND REGIONAL MEDICAL CENTER (about 14 miles away; MYRTLE BEACH, SC)
AUTUMN CARE OF SHALLOTTE (Nursing Home, about 16 miles away; SHALLOTTE, NC)
SOUTHEASTERN DIALYSIS SHALLOTTE (Dialysis Facility, about 16 miles away; SHALLOTTE, NC)
Heliports located in Little River: Colleges/universities with over 2000 students nearest to Little River:
Horry-Georgetown Technical College (about 23 miles; Conway, SC ; Full-time enrollment: 5,772)
Coastal Carolina University (about 23 miles; Conway, SC ; FT enrollment: 8,881)
Cape Fear Community College (about 47 miles; Wilmington, NC ; FT enrollment: 8,372)
Miller-Motte College-Wilmington (about 50 miles; Wilmington, NC ; FT enrollment: 2,395)
University of North Carolina Wilmington (about 50 miles; Wilmington, NC ; FT enrollment: 13,112)
Robeson Community College (about 57 miles; Lumberton, NC ; FT enrollment: 2,322)
Francis Marion University (about 63 miles; Florence, SC ; FT enrollment: 3,624)
Public high school in Little River:
Public elementary/middle schools in Little River: NORTH MYRTLE BEACH MIDDLE Students: 1,308, Location: 11240 HIGHWAY 90, Grades: 6-8)WATERWAY ELEMENTARY Location: 700 SANDRIDGE ROAD, Grades: PK-5)
RIVERSIDE ELEMENTARY Location: 1287 HIGHWAY 57 SOUTH, Grades: PK-5)
See full list of schools located in Little River
Notable locations in Little River: (A) , Cypress Bay Golf Course (B) , Eagle Nest Golf Course (C) , Eastport Golf Course (D) , Heather Glen Golf Course (E) , River Hills Golf and Country Club (F) , Lighthouse Twelve (G) , Coquina Harbour (H) , Crickett Cove Yacht Club (I) , Summit Place of North Myrtle Beach (J) , Horry County Fire Department Little River (K) . Display/hide their locations on the map
Shopping Center: (1) . Display/hide its location on the map
Churches in Little River include: (A) , First Baptist Church (B) , Saint Delight Church (C) , North Myrtle Beach Pentecostal Church (D) , Open Door Church (E) , Saint Paul Church (F) . Display/hide their locations on the map
Cemeteries: (1) , North Myrtle Beach Memorial Gardens (2) , Cedar Creek Cemetery (3) . Display/hide their locations on the map
Swamps: (A) . Display/hide its location on the map
Creek: (A) . Display/hide its location on the map
Tourist attractions: (1) , Libraries-Horry County - Stevens Crossroad (Cultural Attractions- Events- & Facilities; 107 Highway 57 North) (2) , Elite Concierge (4473 Mineola Avenue) (3) , Chamber of Commerce - N Myrtle Beach Office (270 Highway 17) (4) , Collins Entertainment (Arcades & Amusements; 4309 Mineola Ave) (5) , LA Belle AMIE Vineyard (Tours & Charters; 1120 Saint Joseph Road) (6) , Getaway Cruises (Tours & Charters; 4495 Baker St) (7) . Display/hide their approximate locations on the map
Hotels: (1) , Hartford Motor Inn (5409 North Ocean Boulevard) (2) , Blockade Runner Motor Inn (1910 North Ocean Boulevard) (3) , Lake Shore Motel (1443 Highway 17) (4) , Mineola Motel (1505 Highway 17) (5) , Holiday Inn Hotel & Suites North Myrtle Beach (722 Highway 17) (6) , Holiday Inn in Myrtle Beach (Coquina Harbor 722 Highway 17 North Myrtle Beach) (7) . Display/hide their approximate locations on the map
Horry County has a predicted average indoor radon screening level less than 2 pCi/L (pico curies per liter) - Low Potential Drinking water stations with addresses in Little River that have no violations reported:
LITTLE RIVER W&SA (2620002) (Population served: 16,445, Primary Water Source Type: Purch surface water)
Average household size: This place:
2.0 peopleSouth Carolina:
2.5 people
Percentage of family households: This place:
58.3%Whole state:
67.5%
Percentage of households with unmarried partners: This place:
7.0%Whole state:
6.0%
Likely homosexual households (counted as self-reported same-sex unmarried-partner households)
Lesbian couples: 0.3% of all households Gay men: 0.3% of all households
8 people in emergency and transitional shelters (with sleeping facilities) for people experiencing homelessness in 2010people in short-term care, detention or diagnostic centers for delinquent children in 2000
Banks with branches in Little River (2011 data):
Branch Banking and Trust Company: Stephens Crossroads Branch at 2496 Hwy 9 East, branch established on 2005/11/09; North Myrtle Beach Branch at 1702 Hwy 17, branch established on 1974/06/20. Info updated 2010/03/29: Bank assets: $168,867.6 mil, Deposits: $127,549.5 mil, headquarters in Winston Salem, NC, positive income , Commercial Lending Specialization, 1793 total offices , Holding Company: Bb&T Corporation
Waccamaw Bank: Little River Branch at 1180 Hwy 17, branch established on 2008/08/04. Info updated 2006/06/06: Bank assets: $562.0 mil, Deposits: $492.7 mil, headquarters in Whiteville, NC, negative income in the last year , Commercial Lending Specialization, 17 total offices , Holding Company: Waccamaw Bankshares, Inc
TD Bank, National Association: Little River Branch at 1390 Highway 17, branch established on 1986/03/21. Info updated 2010/10/04: Bank assets: $188,912.6 mil, Deposits: $153,149.8 mil, headquarters in Wilmington, DE, positive income , 1314 total offices , Holding Company: Toronto-Dominion Bank, The
First Federal Savings and Loan Association of Charleston: Little River Branch at 1376 Highway 17, branch established on 2003/06/16. Info updated 2012/02/24: Bank assets: $3,140.4 mil, Deposits: $2,278.8 mil, headquarters in Charleston, SC, negative income in the last year , Mortgage Lending Specialization, 69 total offices
First Bank: Little River Branch at 1602 Highway 17, branch established on 2008/07/14. Info updated 2011/01/25: Bank assets: $3,289.4 mil, Deposits: $2,759.1 mil, headquarters in Troy, NC, positive income , Commercial Lending Specialization, 98 total offices , Holding Company: First Bancorp
Horry County State Bank: Little River Branch at 3187 Highway 9 East, branch established on 1997/10/06. Info updated 2006/11/03: Bank assets: $537.9 mil, Deposits: $491.4 mil, headquarters in Loris, SC, negative income in the last year , Commercial Lending Specialization, 13 total offices , Holding Company: Hcsb Financial Corporation
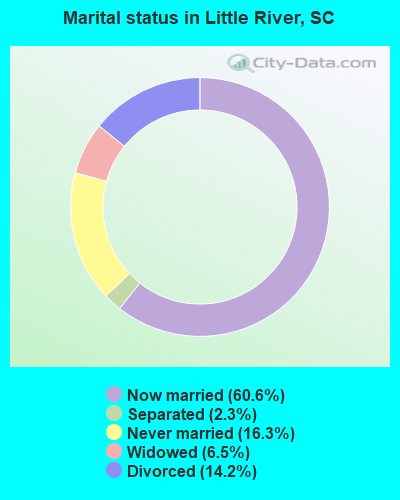
For population 15 years and over in Little River:
Never married: 16.3%Now married: 60.6%Separated: 2.3%Widowed: 6.5%Divorced: 14.2% For population 25 years and over in Little River:
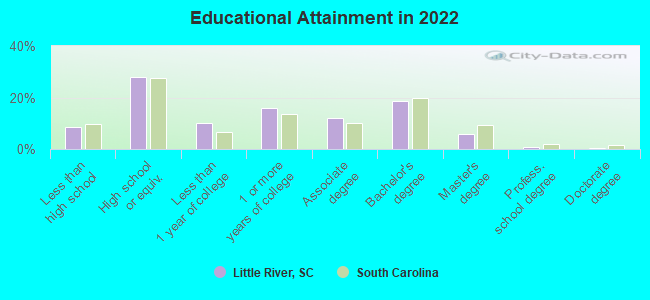
High school or higher: 91.1%Bachelor's degree or higher: 23.5%Graduate or professional degree: 6.8%Unemployed: 3.4%Mean travel time to work (commute): 24.1 minutes
Education Gini index (Inequality in education) Here:
8.6South Carolina average:
11.1
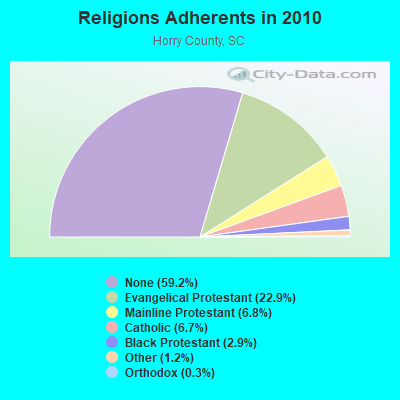
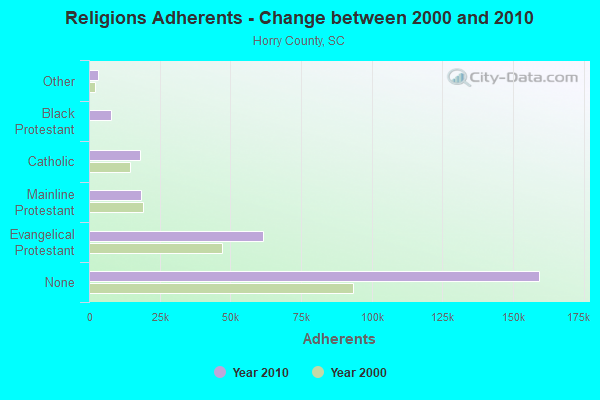
Religion statistics for Little River, SC (based on Horry County data)
Religion Adherents Congregations Evangelical Protestant 61,718 270 Mainline Protestant 18,278 39 Catholic 18,159 5 Black Protestant 7,891 41 Other 3,148 14 Orthodox 730 3 None 159,367 -
Source: Clifford Grammich, Kirk Hadaway, Richard Houseal, Dale E.Jones, Alexei Krindatch, Richie Stanley and Richard H.Taylor. 2012. 2010 U.S.Religion Census: Religious Congregations & Membership Study. Association of Statisticians of American Religious Bodies. Jones, Dale E., et al. 2002. Congregations and Membership in the United States 2000. Nashville, TN: Glenmary Research Center. Graphs represent county-level data
Food Environment Statistics: Number of grocery stores : 56Here :
2.24 / 10,000 pop.South Carolina :
1.99 / 10,000 pop.
Number of supercenters and club stores : 7This county :
0.28 / 10,000 pop.South Carolina :
0.15 / 10,000 pop.
Number of convenience stores (no gas) : 17Here :
0.68 / 10,000 pop.State :
0.85 / 10,000 pop.
Number of convenience stores (with gas) : 164Horry County :
6.57 / 10,000 pop.South Carolina :
5.38 / 10,000 pop.
Number of full-service restaurants : 459Horry County :
18.38 / 10,000 pop.South Carolina :
7.75 / 10,000 pop.
Adult diabetes rate : Here :
9.9%South Carolina :
10.6%
Adult obesity rate : Horry County :
27.1%South Carolina :
29.4%
Low-income preschool obesity rate : Horry County :
15.8%South Carolina :
13.4%
Health and Nutrition: Healthy diet rate : This city:
50.7%South Carolina:
49.2%
Average overall health of teeth and gums : Little River:
46.6%South Carolina:
46.2%
Average BMI : Little River:
29.3State:
29.0
People feeling badly about themselves : Here:
19.2%South Carolina:
20.4%
People not drinking alcohol at all : Little River:
11.9%South Carolina:
11.0%
Average hours sleeping at night : Here:
6.9South Carolina:
6.8
Overweight people : This city:
38.0%South Carolina:
34.4%
General health condition : This city:
56.2%South Carolina:
55.6%
Average condition of hearing : Little River:
75.3%State:
79.9%
More about Health and Nutrition of Little River, SC Residents
Businesses in Little River, SC
Name Count Name Count
Advance Auto Parts 1 Jones New York 1 Baskin-Robbins 1 Lane Furniture 1 Blockbuster 1 McDonald's 1 Burger King 1 Penske 1 CVS 2 Pizza Hut 1 Chevrolet 1 Sleep Inn 1 Days Inn 1 Subway 2 Dunkin Donuts 3 U-Haul 2 FedEx 1 UPS 4 Holiday Inn 1 Waffle House 1
Strongest AM radio stations in Little River:
WMIR (1200 AM; 6 kW; ATLANTIC BEACH, SC; Owner: ATLANTIC BEACH RADIO, INC.)
WQJM (1450 AM; 10 kW; MYRTLE BEACH, SC; Owner: NM LICENSING, LLC)
WNMB (900 AM; 0 kW; NORTH MYRTLE BEACH, SC; Owner: FIDELITY BROADCASTING CORPORATION)
WTAB (1370 AM; 5 kW; TABOR CITY, NC; Owner: WTAB, INC)
WMYT (1180 AM; daytime; 10 kW; CAROLINA BEACH, NC; Owner: FAMILY RADIO NETWORK, INC.)
WPJS (1330 AM; 5 kW; CONWAY, SC; Owner: WPJS BROADCASTING, INC.)
WENC (1220 AM; 5 kW; WHITEVILLE, NC; Owner: DHA COMMUNICATIONS, INC.)
WPTF (680 AM; 50 kW; RALEIGH, NC; Owner: FIRST STATE COMMUNICATIONS)
WCEO (840 AM; daytime; 50 kW; COLUMBIA, SC; Owner: EASTERN BROADCASTING GROUP, INC.)
WBAJ (890 AM; daytime; 50 kW; BLYTHEWOOD, SC; Owner: FAMILY FIRST)
WAAV (980 AM; 5 kW; LELAND, NC; Owner: CUMULUS LICENSING CORP.)
WLSC (1240 AM; 1 kW; LORIS, SC; Owner: J.A.R.C. BROADCASTING, INC.)
WJMX (970 AM; 10 kW; FLORENCE, SC; Owner: QANTUM OF FLORENCE LICENSE COMPANY, LLC)
Strongest FM radio stations in Little River:
WHQR (91.3 FM; WILMINGTON, NC; Owner: FRIENDS OF PUBLIC RADIO, INC.)
WEZV (105.9 FM; NORTH MYRTLE BEACH, SC; Owner: FIDELITY BROADCASTING CORPORATION)
WYNA (104.9 FM; CALABASH, NC; Owner: COASTLINE COMMUNICATIONS OF CAROLINA INC)
WVCO (94.9 FM; LORIS, SC; Owner: CAROLINA BEACH MUSIC BROADCASTING CORP.)
WKVC (88.9 FM; NORTH MYRTLE BEACH, SC; Owner: EDUCATIONAL MEDIA FOUNDATION)
WKZQ-FM (101.7 FM; MYRTLE BEACH, SC; Owner: NM LICENSING, LLC)
WYAV (104.1 FM; MYRTLE BEACH, SC; Owner: NM LICENSING, LLC)
WDZD (93.5 FM; OCEAN ISLE BEACH, NC; Owner: QANTUM OF MYRTLE BEACH LICENSE COMPANY, LLC)
WEGX (92.9 FM; DILLON, SC; Owner: QANTUM OF FLORENCE LICENSE COMPANY, LLC)
WGNI (102.7 FM; WILMINGTON, NC; Owner: CUMULUS LICENSING CORP.)
WMYB (92.1 FM; MYRTLE BEACH, SC; Owner: NM LICENSING, LLC)
WHMC-FM (90.1 FM; CONWAY, SC; Owner: SOUTH CAROLINA EDUCATIONAL TV COMMISSION)
WGTR (107.9 FM; BUCKSPORT, SC; Owner: QANTUM OF MYRTLE BEACH LICENSE COMPANY, LLC)
WBNU (103.7 FM; SHALLOTTE, NC; Owner: GARY E. BURNS)
WYEZ (94.5 FM; MURRELLS INLET, SC; Owner: FIDELITY BROADCASTING CORPORATION)
WMNX (97.3 FM; WILMINGTON, NC; Owner: CUMULUS LICENSING CORP.)
WWXM (97.7 FM; GARDEN CITY, SC; Owner: QANTUM OF MYRTLE BEACH LICENSE COMPANY, LLC)
WJXY-FM (93.9 FM; CONWAY, SC; Owner: CUMULUS LICENSING CORP.)
WRNN (99.5 FM; SOCASTEE, SC; Owner: NM LICENSING, LLC)
WDAI (98.5 FM; PAWLEYS ISLAND, SC; Owner: CUMULUS LICENSING CORP.)
TV broadcast stations around Little River:
WFXB (Channel 43; MYRTLE BEACH, SC; Owner: GE MEDIA, INC.)
W49AN (Channel 49; MYRTLE BEACH, SC; Owner: DOVE BROADCASTING, INC.)
WUNJ-TV (Channel 39; WILMINGTON, NC; Owner: UNIVERSITY OF NORTH CAROLINA)
WSFX-TV (Channel 26; WILMINGTON, NC; Owner: SOUTHEASTERN MEDIA HOLDINGS, INC.)
WGSI-CA (Channel 11; MYRTLE BEACH, SC; Owner: BEACH TV OF SOUTH CAROLINA, INC.)
WECT (Channel 6; WILMINGTON, NC; Owner: RAYCOM AMERICA, INC.)
WPDE-TV (Channel 15; FLORENCE, SC; Owner: GRAND STRAND COMMUNICATIONS)
WWMB (Channel 21; FLORENCE, SC; Owner: ATLANTIC MEDIA GROUP, INC.)
WGSC-CA (Channel 8; MYRTLE BEACH, SC; Owner: BEACH TV OF SOUTH CAROLINA, INC.)
WBTW (Channel 13; FLORENCE, SC; Owner: MEDIA GENERAL BROADCASTING OF SO. CAROLINA HOLDINGS, INC.)
WHMC (Channel 23; CONWAY, SC; Owner: SOUTH CAROLINA EDUCATIONAL TV COMMISSION)
W34CQ (Channel 34; MYRTLE BEACH, SC; Owner: TRINITY BROADCASTING NETWORK)
W47CK (Channel 47; SHALLOTTE, NC; Owner: CAROLINA CHRISTIAN BROADCASTING INC.)
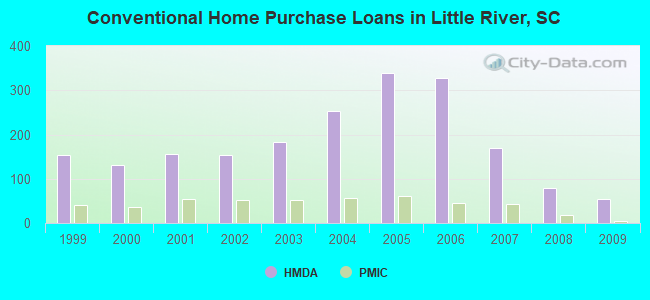
Home Mortgage Disclosure Act Aggregated Statistics For Year 2009(Based on 1 partial tract) A) FHA, FSA/RHS & VA B) Conventional C) Refinancings D) Home Improvement Loans F) Non-occupant Loans on G) Loans On Manufactured Number Average Value Number Average Value Number Average Value Number Average Value Number Average Value Number Average Value
LOANS ORIGINATED 19 $143,634 54 $125,864 171 $154,639 5 $86,632 64 $131,570 6 $66,937 APPLICATIONS APPROVED, NOT ACCEPTED 0 $0 5 $143,792 13 $160,869 1 $5,580 6 $166,623 1 $21,490 APPLICATIONS DENIED 6 $141,830 10 $101,481 76 $179,527 5 $90,094 18 $123,068 4 $62,798 APPLICATIONS WITHDRAWN 2 $147,785 6 $181,880 57 $180,034 2 $115,130 11 $163,705 2 $74,800 FILES CLOSED FOR INCOMPLETENESS 1 $127,550 1 $259,840 15 $161,767 0 $0 3 $180,857 1 $97,960
Aggregated Statistics For Year 2008(Based on 1 partial tract) A) FHA, FSA/RHS & VA B) Conventional C) Refinancings D) Home Improvement Loans E) Loans on Dwellings For 5+ Families F) Non-occupant Loans on G) Loans On Manufactured Number Average Value Number Average Value Number Average Value Number Average Value Number Average Value Number Average Value Number Average Value
LOANS ORIGINATED 10 $173,014 78 $160,032 111 $162,786 10 $61,904 1 $212,120 60 $139,583 9 $66,147 APPLICATIONS APPROVED, NOT ACCEPTED 1 $95,450 7 $157,931 15 $163,664 1 $139,550 0 $0 6 $135,177 2 $92,245 APPLICATIONS DENIED 6 $151,133 24 $149,656 76 $203,262 8 $63,006 0 $0 20 $134,094 12 $70,054 APPLICATIONS WITHDRAWN 3 $138,247 15 $198,198 35 $174,214 2 $164,810 0 $0 11 $149,522 1 $151,550 FILES CLOSED FOR INCOMPLETENESS 0 $0 4 $114,152 10 $271,481 1 $20,650 0 $0 3 $181,693 1 $57,770
Aggregated Statistics For Year 2007(Based on 1 partial tract) A) FHA, FSA/RHS & VA B) Conventional C) Refinancings D) Home Improvement Loans F) Non-occupant Loans on G) Loans On Manufactured Number Average Value Number Average Value Number Average Value Number Average Value Number Average Value Number Average Value
LOANS ORIGINATED 4 $166,275 170 $149,928 134 $160,266 11 $76,169 100 $140,920 17 $79,199 APPLICATIONS APPROVED, NOT ACCEPTED 0 $0 24 $141,399 21 $158,409 3 $72,007 13 $129,889 3 $81,590 APPLICATIONS DENIED 1 $76,190 38 $172,286 67 $169,330 12 $63,704 17 $148,761 11 $74,165 APPLICATIONS WITHDRAWN 1 $175,270 26 $208,208 36 $183,981 1 $163,830 12 $229,699 1 $92,100 FILES CLOSED FOR INCOMPLETENESS 0 $0 5 $144,964 13 $237,192 0 $0 2 $215,605 1 $42,420
Aggregated Statistics For Year 2006(Based on 1 partial tract) A) FHA, FSA/RHS & VA B) Conventional C) Refinancings D) Home Improvement Loans F) Non-occupant Loans on G) Loans On Manufactured Number Average Value Number Average Value Number Average Value Number Average Value Number Average Value Number Average Value
LOANS ORIGINATED 3 $149,690 327 $137,741 157 $137,564 13 $98,930 196 $132,095 22 $67,098 APPLICATIONS APPROVED, NOT ACCEPTED 1 $40,470 35 $154,478 21 $148,747 2 $57,775 15 $136,089 5 $65,198 APPLICATIONS DENIED 1 $173,320 52 $146,742 69 $145,164 10 $66,175 25 $126,588 13 $77,203 APPLICATIONS WITHDRAWN 1 $150,430 38 $147,806 40 $147,044 4 $64,262 18 $133,736 3 $70,983 FILES CLOSED FOR INCOMPLETENESS 0 $0 5 $174,940 16 $138,119 1 $12,560 4 $173,950 0 $0
Aggregated Statistics For Year 2005(Based on 1 partial tract) A) FHA, FSA/RHS & VA B) Conventional C) Refinancings D) Home Improvement Loans E) Loans on Dwellings For 5+ Families F) Non-occupant Loans on G) Loans On Manufactured Number Average Value Number Average Value Number Average Value Number Average Value Number Average Value Number Average Value Number Average Value
LOANS ORIGINATED 4 $163,065 339 $119,302 118 $136,392 12 $67,728 0 $0 184 $112,819 20 $62,142 APPLICATIONS APPROVED, NOT ACCEPTED 1 $46,610 36 $126,603 16 $121,967 1 $53,870 0 $0 16 $121,374 3 $78,147 APPLICATIONS DENIED 0 $0 54 $128,148 71 $123,622 10 $38,209 0 $0 25 $125,863 19 $74,035 APPLICATIONS WITHDRAWN 0 $0 32 $129,912 39 $137,489 4 $106,755 1 $44,100 15 $141,857 4 $89,870 FILES CLOSED FOR INCOMPLETENESS 0 $0 9 $113,470 24 $137,201 1 $38,520 0 $0 4 $101,172 1 $112,480
Aggregated Statistics For Year 2004(Based on 1 partial tract) A) FHA, FSA/RHS & VA B) Conventional C) Refinancings D) Home Improvement Loans E) Loans on Dwellings For 5+ Families F) Non-occupant Loans on G) Loans On Manufactured Number Average Value Number Average Value Number Average Value Number Average Value Number Average Value Number Average Value Number Average Value
LOANS ORIGINATED 4 $122,735 254 $107,363 102 $115,840 5 $44,376 1 $632,440 139 $103,070 12 $65,100 APPLICATIONS APPROVED, NOT ACCEPTED 0 $0 25 $102,028 16 $105,796 2 $38,515 0 $0 11 $94,133 6 $67,217 APPLICATIONS DENIED 1 $114,710 48 $102,941 68 $110,351 7 $42,463 0 $0 20 $101,439 18 $67,635 APPLICATIONS WITHDRAWN 0 $0 27 $131,198 37 $123,144 2 $132,015 0 $0 13 $112,498 2 $73,820 FILES CLOSED FOR INCOMPLETENESS 0 $0 4 $138,852 14 $132,712 0 $0 0 $0 2 $84,985 1 $118,060
Aggregated Statistics For Year 2003(Based on 1 partial tract) A) FHA, FSA/RHS & VA B) Conventional C) Refinancings D) Home Improvement Loans F) Non-occupant Loans on Number Average Value Number Average Value Number Average Value Number Average Value Number Average Value
LOANS ORIGINATED 4 $89,940 182 $100,295 289 $102,938 4 $24,770 154 $85,524 APPLICATIONS APPROVED, NOT ACCEPTED 0 $0 12 $89,661 29 $117,030 1 $32,380 10 $79,990 APPLICATIONS DENIED 0 $0 26 $90,632 75 $106,806 3 $33,957 16 $104,698 APPLICATIONS WITHDRAWN 0 $0 18 $112,462 44 $105,100 1 $4,740 10 $78,818 FILES CLOSED FOR INCOMPLETENESS 0 $0 3 $94,707 9 $125,843 0 $0 2 $75,355
Aggregated Statistics For Year 2002(Based on 1 partial tract) A) FHA, FSA/RHS & VA B) Conventional C) Refinancings D) Home Improvement Loans F) Non-occupant Loans on Number Average Value Number Average Value Number Average Value Number Average Value Number Average Value
LOANS ORIGINATED 4 $103,545 154 $93,542 200 $111,997 3 $15,910 103 $85,277 APPLICATIONS APPROVED, NOT ACCEPTED 1 $66,150 13 $101,635 24 $96,592 1 $22,890 7 $76,673 APPLICATIONS DENIED 2 $85,265 29 $78,649 56 $91,331 3 $8,467 10 $78,204 APPLICATIONS WITHDRAWN 1 $96,010 13 $94,658 34 $101,371 1 $13,960 10 $79,460 FILES CLOSED FOR INCOMPLETENESS 0 $0 3 $96,570 10 $98,466 0 $0 2 $95,870
Aggregated Statistics For Year 2001(Based on 1 partial tract) A) FHA, FSA/RHS & VA B) Conventional C) Refinancings D) Home Improvement Loans F) Non-occupant Loans on Number Average Value Number Average Value Number Average Value Number Average Value Number Average Value
LOANS ORIGINATED 5 $96,178 155 $94,059 172 $99,181 5 $33,046 85 $85,086 APPLICATIONS APPROVED, NOT ACCEPTED 0 $0 16 $73,927 10 $92,103 0 $0 4 $88,892 APPLICATIONS DENIED 2 $83,870 36 $72,194 53 $81,134 3 $38,517 7 $64,511 APPLICATIONS WITHDRAWN 2 $86,660 12 $108,058 35 $94,264 1 $5,860 4 $86,382 FILES CLOSED FOR INCOMPLETENESS 0 $0 1 $128,110 8 $88,230 0 $0 1 $147,090
Aggregated Statistics For Year 2000(Based on 1 partial tract) A) FHA, FSA/RHS & VA B) Conventional C) Refinancings D) Home Improvement Loans E) Loans on Dwellings For 5+ Families F) Non-occupant Loans on Number Average Value Number Average Value Number Average Value Number Average Value Number Average Value Number Average Value
LOANS ORIGINATED 3 $98,150 130 $83,341 47 $87,893 4 $22,468 1 $91,270 62 $78,031 APPLICATIONS APPROVED, NOT ACCEPTED 1 $54,420 20 $74,143 15 $86,465 1 $15,070 0 $0 4 $78,638 APPLICATIONS DENIED 3 $65,497 51 $59,213 49 $69,638 4 $18,560 0 $0 8 $60,146 APPLICATIONS WITHDRAWN 0 $0 10 $82,949 16 $52,750 1 $68,100 0 $0 4 $75,078 FILES CLOSED FOR INCOMPLETENESS 0 $0 2 $142,480 6 $69,962 0 $0 0 $0 0 $0
Aggregated Statistics For Year 1999(Based on 1 partial tract) A) FHA, FSA/RHS & VA B) Conventional C) Refinancings D) Home Improvement Loans F) Non-occupant Loans on Number Average Value Number Average Value Number Average Value Number Average Value Number Average Value
LOANS ORIGINATED 3 $88,567 153 $83,826 87 $79,772 3 $11,523 76 $76,149 APPLICATIONS APPROVED, NOT ACCEPTED 0 $0 28 $66,006 21 $69,368 1 $23,700 7 $80,573 APPLICATIONS DENIED 0 $0 69 $55,703 48 $68,776 3 $23,883 8 $80,539 APPLICATIONS WITHDRAWN 0 $0 11 $88,886 30 $76,122 0 $0 4 $80,852 FILES CLOSED FOR INCOMPLETENESS 0 $0 1 $107,900 6 $78,993 0 $0 1 $43,490
Detailed HMDA statistics for the following Tracts:
0401.00
Private Mortgage Insurance Companies Aggregated Statistics For Year 2009(Based on 1 partial tract) A) Conventional B) Refinancings C) Non-occupant Loans on Number Average Value Number Average Value Number Average Value
LOANS ORIGINATED 4 $154,062 3 $207,093 2 $110,525 APPLICATIONS APPROVED, NOT ACCEPTED 1 $216,860 0 $0 0 $0 APPLICATIONS DENIED 1 $106,340 1 $253,700 1 $62,520 APPLICATIONS WITHDRAWN 0 $0 0 $0 0 $0 FILES CLOSED FOR INCOMPLETENESS 0 $0 1 $75,080 0 $0
Aggregated Statistics For Year 2008(Based on 1 partial tract) A) Conventional B) Refinancings C) Non-occupant Loans on D) Loans On Manufactured Number Average Value Number Average Value Number Average Value Number Average Value
LOANS ORIGINATED 19 $158,646 9 $191,401 11 $134,298 0 $0 APPLICATIONS APPROVED, NOT ACCEPTED 9 $199,650 4 $224,885 3 $165,227 0 $0 APPLICATIONS DENIED 3 $144,480 1 $280,220 3 $143,737 0 $0 APPLICATIONS WITHDRAWN 1 $191,180 2 $156,435 0 $0 1 $42,980 FILES CLOSED FOR INCOMPLETENESS 1 $78,150 0 $0 1 $64,190 0 $0
Aggregated Statistics For Year 2007(Based on 1 partial tract) A) Conventional B) Refinancings C) Non-occupant Loans on D) Loans On Manufactured Number Average Value Number Average Value Number Average Value Number Average Value
LOANS ORIGINATED 43 $181,343 9 $208,209 16 $172,989 1 $149,320 APPLICATIONS APPROVED, NOT ACCEPTED 8 $191,602 2 $191,740 4 $168,715 0 $0 APPLICATIONS DENIED 1 $195,930 0 $0 0 $0 0 $0 APPLICATIONS WITHDRAWN 4 $221,118 0 $0 2 $246,165 0 $0 FILES CLOSED FOR INCOMPLETENESS 1 $78,710 0 $0 0 $0 0 $0
Aggregated Statistics For Year 2006(Based on 1 partial tract) A) Conventional B) Refinancings C) Non-occupant Loans on D) Loans On Manufactured Number Average Value Number Average Value Number Average Value Number Average Value
LOANS ORIGINATED 45 $164,942 7 $192,180 27 $157,423 1 $97,960 APPLICATIONS APPROVED, NOT ACCEPTED 8 $168,890 2 $147,505 6 $151,087 0 $0 APPLICATIONS DENIED 1 $147,360 0 $0 0 $0 0 $0 APPLICATIONS WITHDRAWN 5 $208,376 1 $156,850 3 $219,093 0 $0 FILES CLOSED FOR INCOMPLETENESS 0 $0 0 $0 0 $0 0 $0
Aggregated Statistics For Year 2005(Based on 1 partial tract) A) Conventional B) Refinancings C) Non-occupant Loans on D) Loans On Manufactured Number Average Value Number Average Value Number Average Value Number Average Value
LOANS ORIGINATED 61 $131,090 9 $162,188 31 $114,512 1 $99,080 APPLICATIONS APPROVED, NOT ACCEPTED 8 $126,921 2 $90,290 4 $136,968 1 $41,870 APPLICATIONS DENIED 1 $145,130 0 $0 1 $68,380 0 $0 APPLICATIONS WITHDRAWN 4 $156,295 1 $83,730 2 $133,970 0 $0 FILES CLOSED FOR INCOMPLETENESS 0 $0 0 $0 0 $0 0 $0
Aggregated Statistics For Year 2004(Based on 1 partial tract) A) Conventional B) Refinancings C) Non-occupant Loans on D) Loans On Manufactured Number Average Value Number Average Value Number Average Value Number Average Value
LOANS ORIGINATED 57 $111,278 11 $138,205 29 $104,335 2 $72,985 APPLICATIONS APPROVED, NOT ACCEPTED 7 $111,480 6 $121,222 4 $102,150 0 $0 APPLICATIONS DENIED 1 $47,730 1 $78,710 0 $0 0 $0 APPLICATIONS WITHDRAWN 7 $144,254 2 $164,950 3 $160,577 0 $0 FILES CLOSED FOR INCOMPLETENESS 1 $105,220 0 $0 0 $0 0 $0
Aggregated Statistics For Year 2003(Based on 1 partial tract) A) Conventional B) Refinancings C) Non-occupant Loans on Number Average Value Number Average Value Number Average Value
LOANS ORIGINATED 52 $111,323 38 $111,941 32 $97,903 APPLICATIONS APPROVED, NOT ACCEPTED 7 $120,291 6 $134,200 4 $71,660 APPLICATIONS DENIED 0 $0 1 $108,850 0 $0 APPLICATIONS WITHDRAWN 4 $124,758 3 $128,387 1 $183,090 FILES CLOSED FOR INCOMPLETENESS 1 $133,130 1 $93,220 0 $0
Aggregated Statistics For Year 2002(Based on 1 partial tract) A) Conventional B) Refinancings C) Non-occupant Loans on Number Average Value Number Average Value Number Average Value
LOANS ORIGINATED 51 $102,085 30 $109,500 26 $90,600 APPLICATIONS APPROVED, NOT ACCEPTED 8 $94,929 4 $107,872 2 $87,500 APPLICATIONS DENIED 1 $133,410 1 $91,820 0 $0 APPLICATIONS WITHDRAWN 6 $109,500 3 $100,477 3 $98,057 FILES CLOSED FOR INCOMPLETENESS 0 $0 0 $0 0 $0
Aggregated Statistics For Year 2001(Based on 1 partial tract) A) Conventional B) Refinancings C) Non-occupant Loans on Number Average Value Number Average Value Number Average Value
LOANS ORIGINATED 55 $98,872 27 $111,227 22 $100,387 APPLICATIONS APPROVED, NOT ACCEPTED 7 $102,111 3 $105,407 3 $83,730 APPLICATIONS DENIED 1 $100,480 2 $89,310 0 $0 APPLICATIONS WITHDRAWN 2 $125,175 1 $122,800 0 $0 FILES CLOSED FOR INCOMPLETENESS 1 $43,820 0 $0 0 $0
Aggregated Statistics For Year 2000(Based on 1 partial tract) A) Conventional B) Refinancings C) Non-occupant Loans on Number Average Value Number Average Value Number Average Value
LOANS ORIGINATED 36 $94,119 6 $95,267 14 $75,796 APPLICATIONS APPROVED, NOT ACCEPTED 4 $100,475 1 $144,570 1 $116,660 APPLICATIONS DENIED 1 $74,240 1 $53,590 0 $0 APPLICATIONS WITHDRAWN 3 $104,197 1 $53,030 1 $156,580 FILES CLOSED FOR INCOMPLETENESS 0 $0 0 $0 0 $0
Aggregated Statistics For Year 1999(Based on 1 partial tract) A) Conventional B) Refinancings C) Non-occupant Loans on Number Average Value Number Average Value Number Average Value
LOANS ORIGINATED 41 $98,539 6 $87,683 14 $84,616 APPLICATIONS APPROVED, NOT ACCEPTED 4 $146,160 2 $113,890 2 $154,455 APPLICATIONS DENIED 3 $108,640 0 $0 0 $0 APPLICATIONS WITHDRAWN 0 $0 0 $0 0 $0 FILES CLOSED FOR INCOMPLETENESS 1 $101,200 0 $0 0 $0
Detailed PMIC statistics for the following Tracts:
0401.00
Fire-safe hotels and motels in Little River, South Carolina:
Holiday Inn Express Hotel & Suites, 722 Hwy 17 N, Little River, South Carolina 29566 Phone: (843) 281-9400, Fax: (843) 280-0175
Days Inn Little River, 1564 Hwy 17, Little River, South Carolina 29566 Phone: (843) 249-3535, Fax: (843) 280-8225
All 2 fire-safe hotels and motels in Little River, South Carolina
Most common first names in Little River, SC among deceased individuals Name Count Lived (average)
Robert 68 72.2 years James 57 72.3 years William 56 73.8 years John 52 71.8 years Mary 42 76.8 years Dorothy 24 81.1 years Joseph 24 74.7 years Thomas 22 64.0 years Richard 21 71.0 years Charles 21 74.8 years
Most common last names in Little River, SC among deceased individuals Last name Count Lived (average)
Bellamy 67 72.4 years Gore 32 66.5 years Vereen 24 71.4 years Lewis 23 71.3 years Smith 17 80.2 years Brown 16 72.7 years Green 14 63.6 years Johnson 12 76.5 years Ward 12 74.2 years Williams 11 66.4 years
Little River compared to South Carolina state average:
Unemployed percentage significantly below state average. Black race population percentage significantly below state average. Hispanic race population percentage below state average. Median age significantly above state average. Length of stay since moving in significantly above state average. House age below state average. Little River on our top lists :
#71 on the list of "Top 100 cities with strongest arts, entertainment, recreation, accommodation and food services industries (pop. 5,000+)"
#92 on the list of "Top 100 cities with oldest residents (pop. 5,000+)"
#101 on the list of "Top 101 cities with largest percentage of males in industries: arts, entertainment, and recreation (population 5,000+)"
#2 on the list of "Top 101 counties with the highest percentage of residents that smoked 100+ cigarettes in their lives"
#13 on the list of "Top 101 counties with the largest number of people moving in compared to moving out (pop. 50,000+)"
#21 on the list of "Top 101 counties with the lowest percentage of residents that visited a dentist within the past year"
#38 on the list of "Top 101 counties with the highest percentage of residents that drank alcohol in the past 30 days"
#39 on the list of "Top 101 counties with the worst general health status score of residents (1-5), 3 years of data"
Top Patent Applicants
Kenneth L. Willeford (11)
Predice D. Hendricks (4)
Scott W. Kaufmann (2)
Stanley L. Hager (2)
Roy M. Smith (1)
Michael J. Urbaniak (1)
Steve Fotson (1)
Cathy Mason (1)
Barbara Anne Graham (1)
Steve Fortson (1)
Total of 32 patent applications in 2008-2024.


 Recent articles from our blog. Our writers, many of them Ph.D. graduates or candidates, create easy-to-read articles on a wide variety of topics.


 (47.7 miles
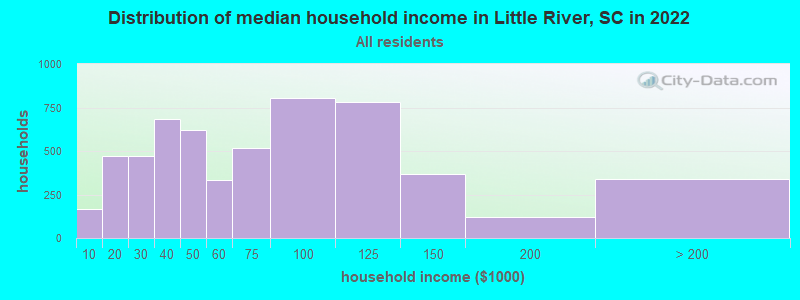


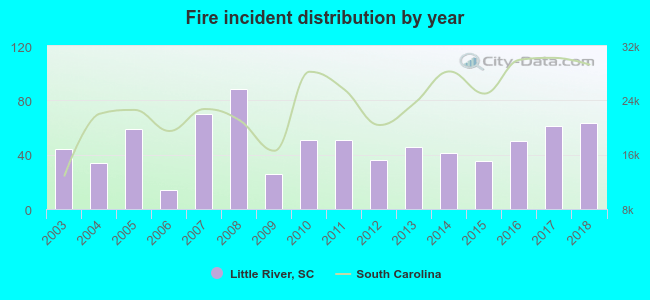 Based on the data from the years 2003 - 2018 the average number of fire incidents per year is 48. The highest number of reported fire incidents - 88 took place in 2008, and the least - 14 in 2006. The data has a rising trend.
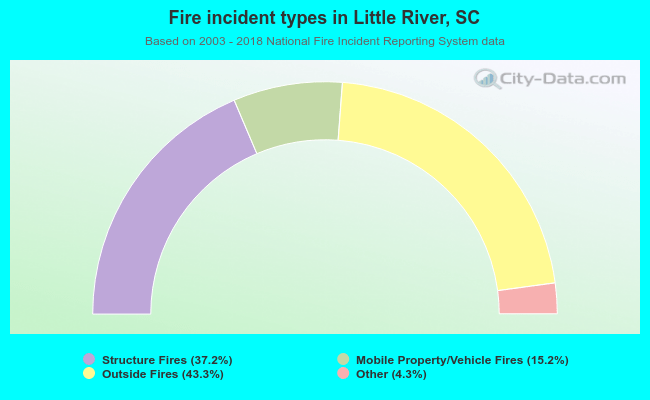 When looking into fire subcategories, the most reports belonged to: Outside Fires (43.3%), and Structure Fires (37.2%).