Bartlett, Tennessee
Submit your own pictures of this city and show them to the world
- OSM Map
- General Map
- Google Map
- MSN Map
Population change since 2000: +40.1%
| Males: 27,335 | |
| Females: 29,463 |
| Median resident age: | 42.0 years |
| Tennessee median age: | 39.2 years |
Zip codes: 38029, 38133, 38134, 38135.
Bartlett Zip Code Map| Bartlett: | $97,610 |
| TN: | $65,254 |
Estimated per capita income in 2022: $40,344 (it was $24,616 in 2000)
Bartlett city income, earnings, and wages data
Estimated median house or condo value in 2022: $306,412 (it was $133,000 in 2000)
| Bartlett: | $306,412 |
| TN: | $284,800 |
Mean prices in 2022: all housing units: $312,315; detached houses: $317,445; townhouses or other attached units: $266,407; in 2-unit structures: $296,597; in 3-to-4-unit structures: $138,859; in 5-or-more-unit structures: $242,552; mobile homes: $127,229; occupied boats, rvs, vans, etc.: $434,364
Median gross rent in 2022: $1,543.
(4.8% for White Non-Hispanic residents, 5.0% for Black residents, 0.1% for Hispanic or Latino residents, 2.1% for other race residents, 2.4% for two or more races residents)
Detailed information about poverty and poor residents in Bartlett, TN


Compare current foreclosures near Bartlett, TN:
| Photo | Address | Area | Beds / Baths | Price | Details |
|---|---|---|---|---|---|

|
#1
Gates Cv
Memphis, TN 38115
|
1,221 sq. feet
|
1 baths 2 beds |
$64,000
|
show details |

|
#2
S Greer St
Memphis, TN 38111
|
820 sq. feet
|
1 baths 2 beds |
$120,000
|
show details |

|
#3
Northgate St
Memphis, TN 38127
|
1,528 sq. feet
|
1 baths 3 beds |
$29,900
|
show details |

|
#4
Majuba Ave
Memphis, TN 38109
|
960 sq. feet
|
1 baths 3 beds |
$15,900
|
show details |

|
#5
Dolan Rd
Memphis, TN 38116
|
- sq. feet
|
2 baths 3 beds |
$82,950
|
show details |

|
#6
Chena Bay Ln
Cordova, TN 38018
|
1,951 sq. feet
|
2 baths 3 beds |
show details | |

|
#7
Almo Ave
Memphis, TN 38118
|
1,284 sq. feet
|
2 baths 2 beds |
show details | |

|
#8
Wynton St
Memphis, TN 38106
|
988 sq. feet
|
1 baths 3 beds |
show details | |

|
#9
Chimneyrock Blvd
Cordova, TN 38016
|
3,011 sq. feet
|
2 baths 4 beds |
show details | |

|
#10
S Perkins Rd
Memphis, TN 38117
|
1,249 sq. feet
|
1 baths 3 beds |
show details |
| Photo | Address | Area | Beds / Baths | Price | Details |
|---|---|---|---|---|---|

|
#11
Ginger Cir
Memphis, TN 38118
|
2,096 sq. feet
|
2 baths 3 beds |
show details | |

|
#12
N Mclean Blvd
Memphis, TN 38107
|
1,829 sq. feet
|
2 baths 3 beds |
show details | |

|
#13
E Mclemore Ave
Memphis, TN 38114
|
1,415 sq. feet
|
1 baths 3 beds |
show details | |

|
#14
Bonnie Dr
Memphis, TN 38116
|
2,422 sq. feet
|
2 baths 3 beds |
show details | |

|
#15
Olive Bark Cv
Memphis, TN 38134
|
1,668 sq. feet
|
2 baths 3 beds |
show details | |

|
#16
Whitney Ave
Memphis, TN 38127
|
1,286 sq. feet
|
1 baths 3 beds |
show details | |

|
#17
Millington Arlington Rd
Millington, TN 38053
|
2,007 sq. feet
|
2 baths 3 beds |
show details | |

|
#18
Santa Cruz Cv
Memphis, TN 38133
|
1,791 sq. feet
|
2 baths 3 beds |
show details | |

|
#19
Birch Glen Dr
Memphis, TN 38115
|
1,553 sq. feet
|
2 baths 3 beds |
show details | |

|
#20
Long Creek Rd
Memphis, TN 38125
|
2,472 sq. feet
|
2 baths 3 beds |
show details |
| Photo | Address | Area | Beds / Baths | Price | Details |
|---|---|---|---|---|---|

|
#21
Woodstock View Dr
Millington, TN 38053
|
- sq. feet
|
2 baths 3 beds |
show details | |

|
#22
Wood Mills Dr W
Cordova, TN 38016
|
2,309 sq. feet
|
2 baths 3 beds |
show details | |

|
#23
Felix Ave
Memphis, TN 38111
|
1,189 sq. feet
|
1 baths 3 beds |
show details | |

|
#24
Richland View Ln
Memphis, TN 38133
|
2,251 sq. feet
|
3 baths 4 beds |
show details | |

|
#25
Hunters Creek Dr
Olive Branch, MS 38654
|
3,183 sq. feet
|
3 baths 4 beds |
show details | |

|
#26
N Hollywood St
Memphis, TN 38112
|
1,437 sq. feet
|
1 baths 3 beds |
show details | |

|
#27
Dothan St
Memphis, TN 38118
|
- sq. feet
|
2 baths 3 beds |
show details | |

|
#28
Tanglewood St
Memphis, TN 38104
|
964 sq. feet
|
1 baths 2 beds |
show details | |

|
#29
Lucille Ave
Memphis, TN 38106
|
1,564 sq. feet
|
2 baths 4 beds |
show details | |

|
#30
Hamlet Rd
Millington, TN 38053
|
784 sq. feet
|
1 baths 2 beds |
show details |
| Photo | Address | Area | Beds / Baths | Price | Details |
|---|---|---|---|---|---|

|
#31
Maury St
Memphis, TN 38107
|
1,789 sq. feet
|
2 baths 3 beds |
show details | |

|
#32
Merryville St
Memphis, TN 38128
|
1,131 sq. feet
|
1 baths 3 beds |
show details | |

|
#33
Hermitage Dr
Memphis, TN 38116
|
2,072 sq. feet
|
3 baths 4 beds |
show details | |

|
#34
Isabelle St
Memphis, TN 38122
|
941 sq. feet
|
1 baths 2 beds |
show details | |

|
#35
Craven Rd
Arlington, TN 38002
|
2,650 sq. feet
|
2 baths 3 beds |
show details | |

|
#36
E Belz Blvd
Memphis, TN 38109
|
175,250 sq. feet
|
1 baths 1 beds |
show details | |

|
#37
Carney St
Memphis, TN 38127
|
1,070 sq. feet
|
2 baths 3 beds |
show details | |

|
#38
Old Brownsville Rd
Arlington, TN 38002
|
2,236 sq. feet
|
2 baths 4 beds |
show details | |

|
#39
Capri St
Memphis, TN 38117
|
1,358 sq. feet
|
1 baths 3 beds |
show details | |

|
#40
Montgomery Rd
Millington, TN 38053
|
1,370 sq. feet
|
2 baths 3 beds |
show details |
| Photo | Address | Area | Beds / Baths | Price | Details |
|---|---|---|---|---|---|

|
#41
Friars Pl
Cordova, TN 38016
|
2,402 sq. feet
|
2 baths 4 beds |
show details | |

|
#42
Cotton Fall Dr
Atoka, TN 38004
|
1,665 sq. feet
|
3 baths 4 beds |
show details | |

|
#43
Lloydminster Cv
Memphis, TN 38141
|
1,304 sq. feet
|
2 baths 3 beds |
show details | |

|
#44
Macon Wood Cv
Cordova, TN 38018
|
2,876 sq. feet
|
4 baths 4 beds |
show details | |

|
#45
Harbor Bend Rd
Memphis, TN 38103
|
2,477 sq. feet
|
3 baths 3 beds |
show details | |

|
#46
Faxon Ave
Memphis, TN 38122
|
1,771 sq. feet
|
2 baths 2 beds |
show details | |

|
#47
N Ball Rd
Memphis, TN 38106
|
912 sq. feet
|
1 baths 3 beds |
show details | |

|
#48
Schanna Dr
Memphis, TN 38135
|
1,924 sq. feet
|
2 baths 3 beds |
show details | |

|
#49
Kirby Lakes Dr
Memphis, TN 38135
|
2,122 sq. feet
|
2 baths 3 beds |
show details | |

|
Check over 1 million property listings on Foreclosure.com!
|
browse all offers | |||


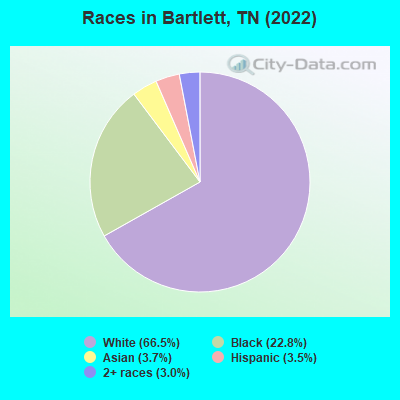
- 37,79766.5%White alone
- 12,94622.8%Black alone
- 2,0793.7%Asian alone
- 1,9913.5%Hispanic
- 1,6973.0%Two or more races
- 200.04%American Indian alone
- 200.04%Other race alone
Races in Bartlett detailed stats: ancestries, foreign born residents, place of birth
According to our research of Tennessee and other state lists, there were 12 registered sex offenders living in Bartlett, Tennessee as of June 07, 2024.
The ratio of all residents to sex offenders in Bartlett is 4,847 to 1.
The ratio of registered sex offenders to all residents in this city is much lower than the state average.
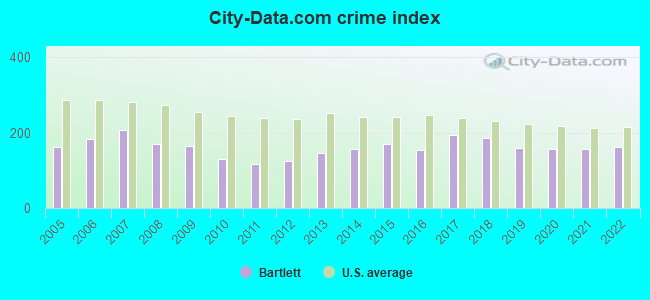
The City-Data.com crime index weighs serious crimes and violent crimes more heavily. Higher means more crime, U.S. average is 246.1. It adjusts for the number of visitors and daily workers commuting into cities.
- means the value is smaller than the state average.- means the value is about the same as the state average.
- means the value is bigger than the state average.
Crime rate in Bartlett detailed stats: murders, rapes, robberies, assaults, burglaries, thefts, arson
Full-time law enforcement employees in 2021, including police officers: 161 (124 officers - 113 male; 11 female).
| Officers per 1,000 residents here: | 2.08 |
| Tennessee average: | 2.57 |
 Recent articles from our blog. Our writers, many of them Ph.D. graduates or candidates, create easy-to-read articles on a wide variety of topics.

 | Weather in bartlett (8 replies) |
| Lakeland or Bartlett - commute, apartment ideas? (9 replies) |
| Compare commutes to UTHSC from Bartlett/Arlington/Collierville (11 replies) |
| Public High School Detailed Reputations (Bartlett, Arlington, Collierville) (8 replies) |
| considering moving to highland condos in bartlett (5 replies) |
| Opinions on Bartlett, TN (10 replies) |
Latest news from Bartlett, TN collected exclusively by city-data.com from local newspapers, TV, and radio stations
Bartlett, TN City Guides:
Ancestries: American (12.7%), English (10.7%), German (5.8%), Irish (5.4%), European (4.8%), Italian (2.3%).
Current Local Time: CST time zone
Incorporated in 1866
Elevation: 290 feet
Land area: 19.1 square miles.
Population density: 2,976 people per square mile (average).
4,025 residents are foreign born (4.1% Asia, 1.1% Latin America).
| This city: | 7.1% |
| Tennessee: | 5.4% |
Median real estate property taxes paid for housing units with mortgages in 2022: $2,607 (0.8%)
Median real estate property taxes paid for housing units with no mortgage in 2022: $2,767 (0.9%)
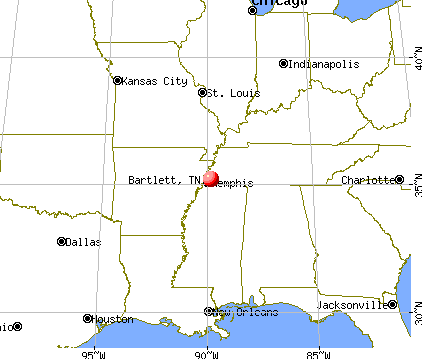
Nearest city with pop. 50,000+: Memphis, TN  (10.4 miles , pop. 650,100).
Nearest city with pop. 1,000,000+: Dallas, TX (432.0 miles , pop. 1,188,580).
Nearest cities:
), ), ), Latitude: 35.22 N, Longitude: 89.84 W
Daytime population change due to commuting: -7,758 (-13.6%)
Workers who live and work in this city: 6,367 (23.2%)
Area code commonly used in this area: 901
Property values in Bartlett, TN

Bartlett, Tennessee accommodation & food services, waste management - Economy and Business Data
Single-family new house construction building permits:
- 2022: 29 buildings, average cost: $510,600
- 2021: 44 buildings, average cost: $369,400
- 2020: 35 buildings, average cost: $274,100
- 2019: 30 buildings, average cost: $229,700
- 2018: 81 buildings, average cost: $232,000
- 2017: 177 buildings, average cost: $249,700
- 2016: 205 buildings, average cost: $232,300
- 2015: 221 buildings, average cost: $216,000
- 2014: 202 buildings, average cost: $197,200
- 2013: 159 buildings, average cost: $201,700
- 2012: 121 buildings, average cost: $178,700
- 2011: 87 buildings, average cost: $169,600
- 2010: 81 buildings, average cost: $172,800
- 2009: 89 buildings, average cost: $168,500
- 2008: 107 buildings, average cost: $174,200
- 2007: 215 buildings, average cost: $218,300
- 2006: 358 buildings, average cost: $223,200
- 2005: 313 buildings, average cost: $193,200
- 2004: 337 buildings, average cost: $185,200
- 2003: 372 buildings, average cost: $170,100
- 2002: 354 buildings, average cost: $151,600
- 2001: 280 buildings, average cost: $142,000
- 2000: 241 buildings, average cost: $150,500
- 1999: 305 buildings, average cost: $146,300
- 1998: 364 buildings, average cost: $144,200
- 1997: 457 buildings, average cost: $132,200
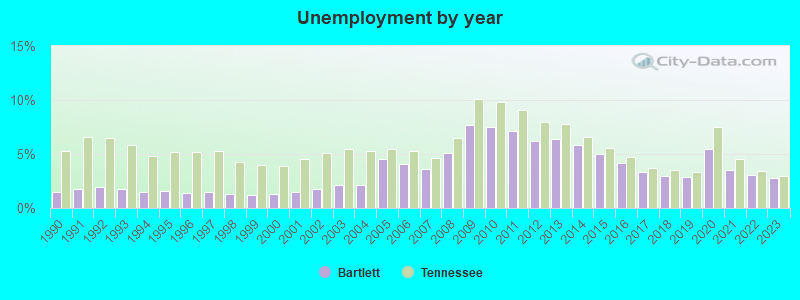
| Here: | 2.8% |
| Tennessee: | 3.0% |
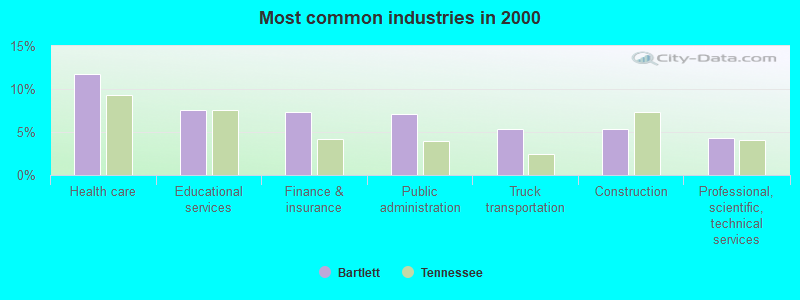
- Health care (11.8%)
- Educational services (7.6%)
- Finance & insurance (7.4%)
- Public administration (7.1%)
- Truck transportation (5.3%)
- Construction (5.3%)
- Professional, scientific, technical services (4.4%)
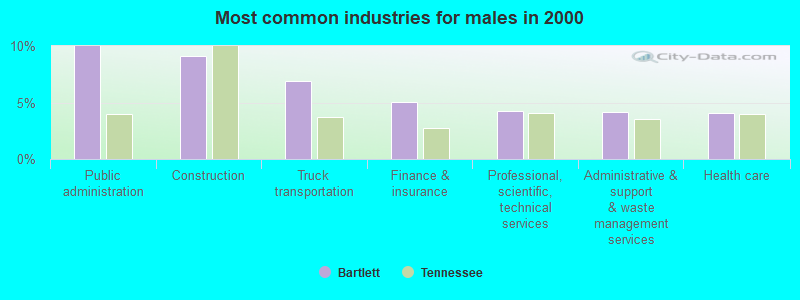
- Public administration (10.0%)
- Construction (9.1%)
- Truck transportation (6.9%)
- Finance & insurance (5.0%)
- Professional, scientific, technical services (4.3%)
- Administrative & support & waste management services (4.2%)
- Health care (4.1%)
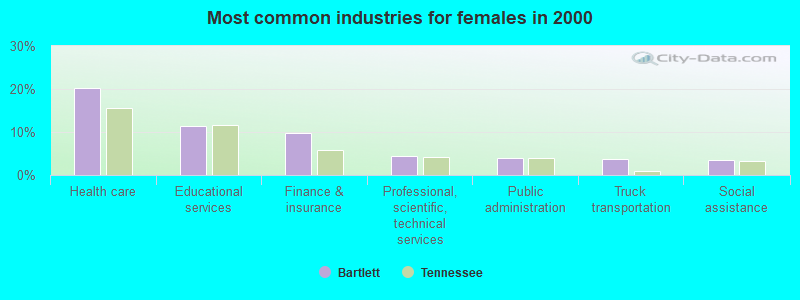
- Health care (20.1%)
- Educational services (11.5%)
- Finance & insurance (9.9%)
- Professional, scientific, technical services (4.5%)
- Public administration (4.0%)
- Truck transportation (3.7%)
- Social assistance (3.4%)
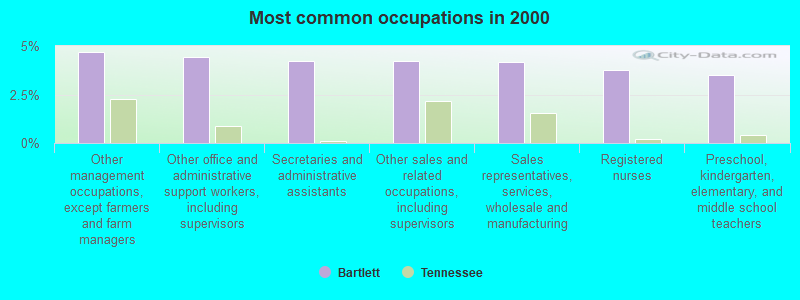
- Other management occupations, except farmers and farm managers (4.7%)
- Other office and administrative support workers, including supervisors (4.4%)
- Secretaries and administrative assistants (4.2%)
- Other sales and related occupations, including supervisors (4.2%)
- Sales representatives, services, wholesale and manufacturing (4.2%)
- Registered nurses (3.8%)
- Preschool, kindergarten, elementary, and middle school teachers (3.5%)
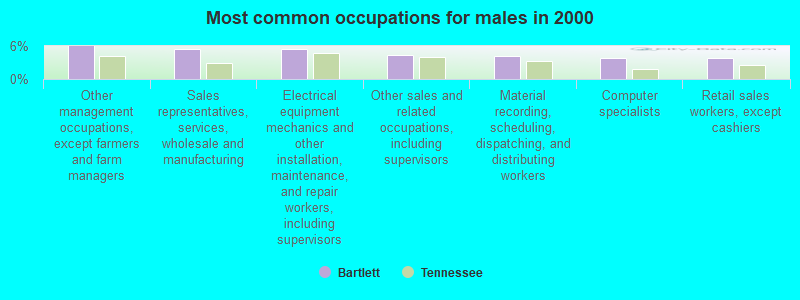
- Other management occupations, except farmers and farm managers (5.9%)
- Sales representatives, services, wholesale and manufacturing (5.4%)
- Electrical equipment mechanics and other installation, maintenance, and repair workers, including supervisors (5.4%)
- Other sales and related occupations, including supervisors (4.3%)
- Material recording, scheduling, dispatching, and distributing workers (4.3%)
- Computer specialists (3.8%)
- Retail sales workers, except cashiers (3.8%)
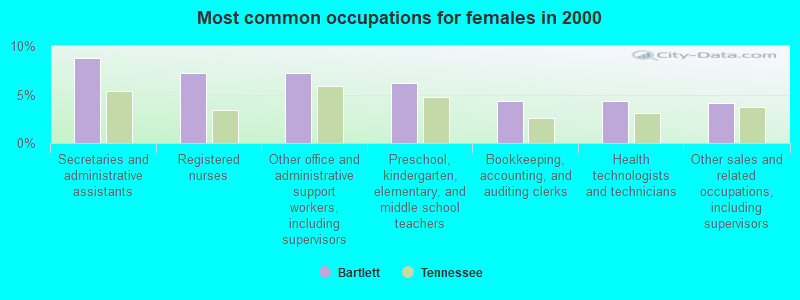
- Secretaries and administrative assistants (8.7%)
- Registered nurses (7.3%)
- Other office and administrative support workers, including supervisors (7.3%)
- Preschool, kindergarten, elementary, and middle school teachers (6.2%)
- Bookkeeping, accounting, and auditing clerks (4.4%)
- Health technologists and technicians (4.3%)
- Other sales and related occupations, including supervisors (4.1%)
Average climate in Bartlett, Tennessee
Based on data reported by over 4,000 weather stations


|
|

(lower is better)
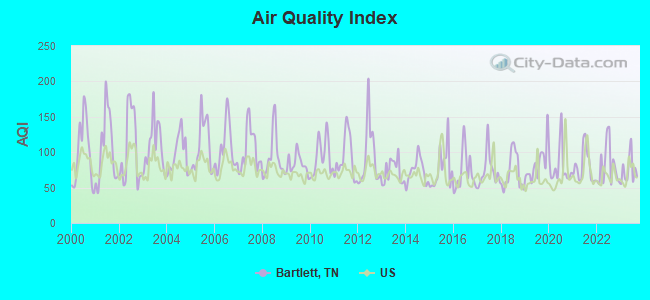
Air Quality Index (AQI) level in 2023 was 74.6. This is about average.
| City: | 74.6 |
| U.S.: | 72.6 |
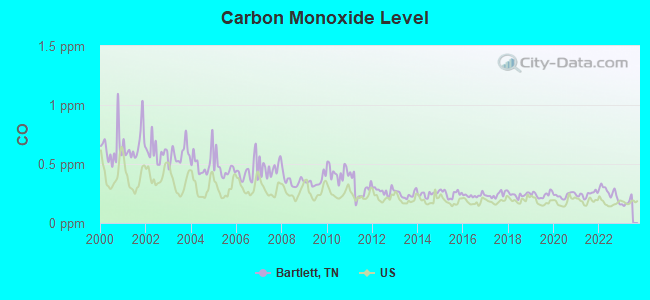
Carbon Monoxide (CO) [ppm] level in 2022 was 0.258. This is about average. Closest monitor was 4.6 miles away from the city center.
| City: | 0.258 |
| U.S.: | 0.251 |
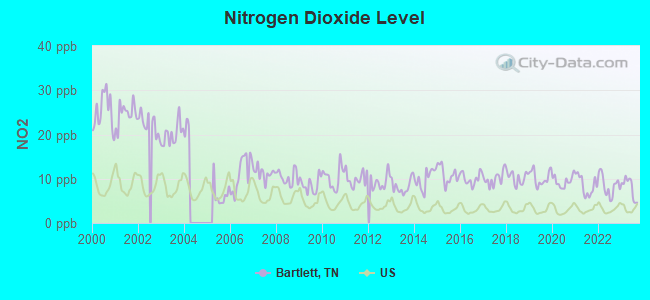
Nitrogen Dioxide (NO2) [ppb] level in 2023 was 7.98. This is significantly worse than average. Closest monitor was 4.6 miles away from the city center.
| City: | 7.98 |
| U.S.: | 5.11 |
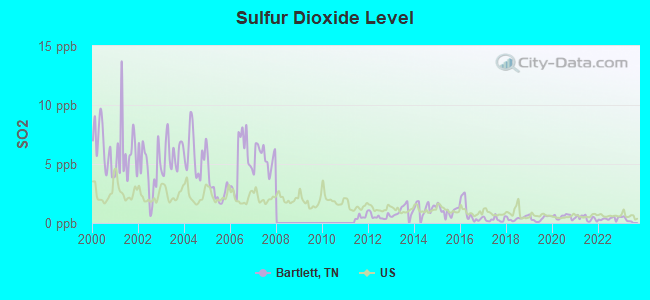
Sulfur Dioxide (SO2) [ppb] level in 2022 was 0.365. This is significantly better than average. Closest monitor was 5.0 miles away from the city center.
| City: | 0.365 |
| U.S.: | 1.515 |

Ozone [ppb] level in 2023 was 32.6. This is about average. Closest monitor was 5.0 miles away from the city center.
| City: | 32.6 |
| U.S.: | 33.3 |
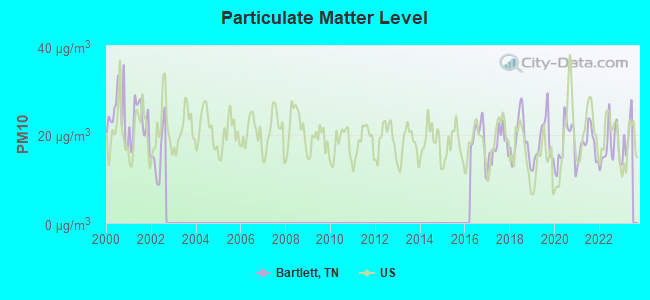
Particulate Matter (PM10) [µg/m3] level in 2022 was 17.3. This is about average. Closest monitor was 5.0 miles away from the city center.
| City: | 17.3 |
| U.S.: | 19.2 |
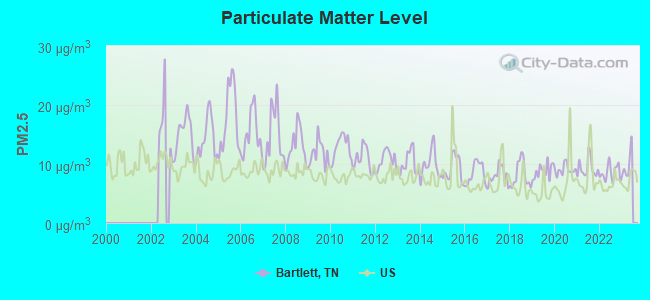
Particulate Matter (PM2.5) [µg/m3] level in 2022 was 8.54. This is about average. Closest monitor was 4.6 miles away from the city center.
| City: | 8.54 |
| U.S.: | 8.11 |
Tornado activity:
Bartlett-area historical tornado activity is above Tennessee state average. It is 102% greater than the overall U.S. average.
On 3/21/1952, a category F4 (max. wind speeds 207-260 mph) tornado 26.1 miles away from the Bartlett city center killed 16 people and injured 74 people and caused between $50,000 and $500,000 in damages.
On 4/3/1968, a category F3 (max. wind speeds 158-206 mph) tornado 8.6 miles away from the city center killed 4 people and injured 32 people and caused between $500,000 and $5,000,000 in damages.
Earthquake activity:
Bartlett-area historical earthquake activity is significantly above Tennessee state average. It is 373% greater than the overall U.S. average.On 3/25/1976 at 00:41:20, a magnitude 5.0 (4.9 MB, 5.0 LG, Class: Moderate, Intensity: VI - VII) earthquake occurred 39.6 miles away from the city center
On 5/4/1991 at 01:18:54, a magnitude 5.0 (4.4 MB, 4.6 LG, 5.0 LG, Depth: 3.1 mi) earthquake occurred 92.8 miles away from Bartlett center
On 4/27/1989 at 16:47:49, a magnitude 4.7 (4.6 MB, 4.7 LG, 4.3 LG, Class: Light, Intensity: IV - V) earthquake occurred 54.3 miles away from the city center
On 9/26/1990 at 13:18:51, a magnitude 5.0 (4.7 MB, 4.8 LG, 5.0 LG, Depth: 7.7 mi) earthquake occurred 135.5 miles away from the city center
On 3/25/1976 at 01:00:11, a magnitude 4.5 (4.1 MB, 4.5 LG) earthquake occurred 44.9 miles away from Bartlett center
On 4/18/2008 at 09:36:59, a magnitude 5.4 (5.1 MB, 4.8 MS, 5.4 MW, 5.2 MW) earthquake occurred 248.2 miles away from the city center
Magnitude types: regional Lg-wave magnitude (LG), body-wave magnitude (MB), surface-wave magnitude (MS), moment magnitude (MW)
Natural disasters:
The number of natural disasters in Shelby County (18) is near the US average (15).Major Disasters (Presidential) Declared: 14
Emergencies Declared: 2
Causes of natural disasters: Floods: 13, Storms: 13, Tornadoes: 8, Winds: 8, Winter Storms: 2, Flash Flood: 1, Heavy Rain: 1, Hurricane: 1, Ice Storm: 1, Other: 1 (Note: some incidents may be assigned to more than one category).

Hospitals and medical centers in Bartlett:
- SAINT FRANCIS BARTLETT MEDICAL CENTER (Proprietary, 2986 KATE BOND RD)
- AVE MARIA HOME (2805 CHARLES BRYAN RD)
- RAINBOW HEALTH AND REHAB OF MEMPHIS, LLC (8119 MEMPHIS-ARLINGTON ROAD)
- THE KINGS DAUGHTERS AND SONS (3568 APPLING ROAD)
- FMC BARTLETT (3348 N GERMANTOWN RD)
- AMEDISYS HOME HEALTH CARE (6645 STAGE ROAD, SUITE 102)
- HOME HEALTH CARE OF WEST TENNESSEE, INC (2995 APPLING RD SUITE 102)
Heliports located in Bartlett:
Amtrak station near Bartlett:
- 14 miles: MEMPHIS (545 S. MAIN ST.) . Services: ticket office, partially wheelchair accessible, enclosed waiting area, public restrooms, public payphones, vending machines, free short-term parking, free long-term parking, call for car rental service, call for taxi service, public transit connection.
College/University in Bartlett:
Colleges/universities with over 2000 students nearest to Bartlett:
- Rhodes College (about 10 miles; Memphis, TN; Full-time enrollment: 2,052)
- University of Memphis (about 11 miles; Memphis, TN; FT enrollment: 17,427)
- Southwest Tennessee Community College (about 13 miles; Memphis, TN; FT enrollment: 8,043)
- Northwest Mississippi Community College (about 43 miles; Senatobia, MS; FT enrollment: 6,607)
- University of Mississippi (about 62 miles; University, MS; FT enrollment: 17,642)
- Dyersburg State Community College (about 63 miles; Dyersburg, TN; FT enrollment: 2,211)
- Union University (about 64 miles; Jackson, TN; FT enrollment: 4,051)
Public high school in Bartlett:
Private high school in Bartlett:
Public elementary/middle school in Bartlett:
- KATE BOND ELEMENTARY SCHOOL (Students: 980, Location: 2727 KATE BOND RD, Grades: PK-5)
User-submitted facts and corrections:
- Bartlett, TN has 3 zip codes. 38133, 38134, 38135 added by garydw
- Another hospital in the area is a new one (2 years old) called St. Francis Hospital Bartlett.
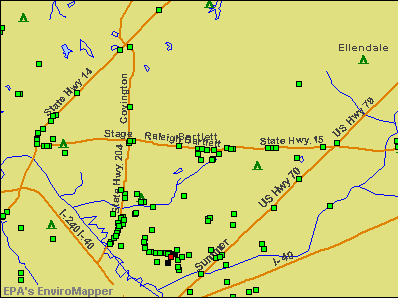
Points of interest:
Notable locations in Bartlett: Corporate Park (A), Corporate Park East (B), Fullview Baptist Church Christian Life Center (C), Ellendale Baptist Church Family Life Center (D), Bartlett Fire Department (E), Lakeside Behavioral Health System (F), City of Bartlett Fire Department (G). Display/hide their locations on the map
Shopping Centers: Bartlett Plaza Shopping Center (1), Town Center Shopping Center (2). Display/hide their locations on the map
Churches in Bartlett include: Fellowship Baptist Church (A), Bartlett United Methodist Church (B), Bartlett Baptist Church (C), Alliance Bible Church (D), Ellendale Baptist Church (E), Fullview Church (F), Curry Memorial Church (G), The Church of Jesus Christ of Latter Day Saints (H), Quail Ridge Church of Christ (I). Display/hide their locations on the map
Cemetery: Toll Gate Cemetery (1). Display/hide its location on the map
Reservoir: Robinson Lake (A). Display/hide its location on the map
Parks in Bartlett include: Bartlett East Park (1), Freeman Park (2), Elmore Park (3). Display/hide their locations on the map
Hotels: Suburban Extended Stay Hotel (7380 Stage Road Hwy 64) (1), Hampton Inn & Suites Memphis/Wolfchase (2935 North Germantown Road) (2). Display/hide their approximate locations on the map
Birthplace of: Sammy Swindell - Racing driver.
Drinking water stations with addresses in Bartlett that have no violations reported:
- BARTLETT WATER SYSTEM (Population served: 53,432, Primary Water Source Type: Groundwater)
| This city: | 2.8 people |
| Tennessee: | 2.5 people |
| This city: | 79.9% |
| Whole state: | 67.3% |
| This city: | 2.9% |
| Whole state: | 5.8% |
Likely homosexual households (counted as self-reported same-sex unmarried-partner households)
- Lesbian couples: 0.3% of all households
- Gay men: 0.3% of all households
People in group quarters in Bartlett in 2010:
- 244 people in nursing facilities/skilled-nursing facilities
- 219 people in residential treatment centers for juveniles (non-correctional)
- 175 people in mental (psychiatric) hospitals and psychiatric units in other hospitals
- 28 people in local jails and other municipal confinement facilities
- 22 people in group homes for juveniles (non-correctional)
- 13 people in workers' group living quarters and job corps centers
- 2 people in other noninstitutional facilities
People in group quarters in Bartlett in 2000:
- 150 people in nursing homes
- 138 people in homes for abused, dependent, and neglected children
- 25 people in mental (psychiatric) hospitals or wards
- 8 people in homes for the mentally retarded
- 3 people in other noninstitutional group quarters
- 2 people in religious group quarters
Banks with most branches in Bartlett (2011 data):
- Regions Bank: Bartlett Branch, Bartlett East Branch, Wolfchase Branch. Info updated 2011/02/24: Bank assets: $123,368.2 mil, Deposits: $98,301.3 mil, headquarters in Birmingham, AL, positive income, Commercial Lending Specialization, 1778 total offices, Holding Company: Regions Financial Corporation
- BancorpSouth Bank: Shelby Branch at 6675 Stage Road, branch established on 1995/09/01; Wolfchase Branch at 8166 Stage Road, branch established on 1998/06/27. Info updated 2007/07/18: Bank assets: $12,990.3 mil, Deposits: $10,863.8 mil, headquarters in Tupelo, MS, positive income, Commercial Lending Specialization, 271 total offices, Holding Company: Bancorpsouth, Inc.
- First Tennessee Bank, National Association: Bartlett Main Branch at 6891 Summer Avenue, branch established on 1989/01/23; Stage Road Branch at 5931 Stage Road, branch established on 1975/09/15. Info updated 2009/09/08: Bank assets: $24,563.4 mil, Deposits: $16,402.1 mil, headquarters in Memphis, TN, positive income, Commercial Lending Specialization, 180 total offices, Holding Company: First Horizon National Corporation
- Bank of Bartlett: Bank Of Bartlett at 6281 Stage Road, branch established on 1980/05/19; U.S. Highway 64 Branch at 7984 U.S. Highway 64, branch established on 1998/12/07. Info updated 2006/11/03: Bank assets: $373.2 mil, Deposits: $319.5 mil, local headquarters, negative income in the last year, Mortgage Lending Specialization, 8 total offices, Holding Company: West Tennessee Bancshares, Inc.
- Independent Bank: Kroger-Bartlett Branch at 5995 Stage Road, branch established on 2007/05/16. Info updated 2006/11/03: Bank assets: $819.3 mil, Deposits: $691.2 mil, headquarters in Memphis, TN, positive income, Consumer Lending Specialization, 10 total offices, Holding Company: Independent Holdings, Inc
- First Bank: Firstbank, Bartlett Branch at 8398 Highway 64, branch established on 2007/02/13. Info updated 2012/02/21: Bank assets: $2,074.4 mil, Deposits: $1,734.5 mil, headquarters in Lexington, TN, positive income, Commercial Lending Specialization, 54 total offices, Holding Company: First South Bancorp, Inc.
- SunTrust Bank: Bartlett Branch - 928 at 6633 Stage Road, branch established on 1991/07/08. Info updated 2010/05/27: Bank assets: $171,291.7 mil, Deposits: $129,833.2 mil, headquarters in Atlanta, GA, positive income, Commercial Lending Specialization, 1716 total offices, Holding Company: Suntrust Banks, Inc.
- Trustmark National Bank: Bartlett Branch at 6767 Summer Avenue, branch established on 1961/04/01. Info updated 2012/03/26: Bank assets: $9,612.1 mil, Deposits: $7,410.1 mil, headquarters in Jackson, MS, positive income, Commercial Lending Specialization, 186 total offices, Holding Company: Trustmark Corporation
- First Citizens National Bank: Bartlett Branch at 7580 Highway 70, branch established on 1999/05/03. Info updated 2006/11/03: Bank assets: $1,053.2 mil, Deposits: $856.0 mil, headquarters in Dyersburg, TN, positive income, Commercial Lending Specialization, 19 total offices, Holding Company: First Citizens Bancshares, Inc.
For population 15 years and over in Bartlett:
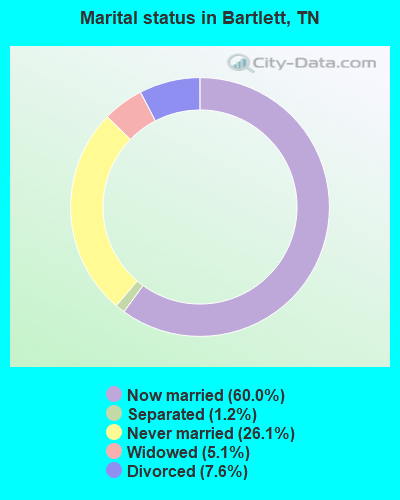
- Never married: 26.1%
- Now married: 60.0%
- Separated: 1.2%
- Widowed: 5.1%
- Divorced: 7.6%
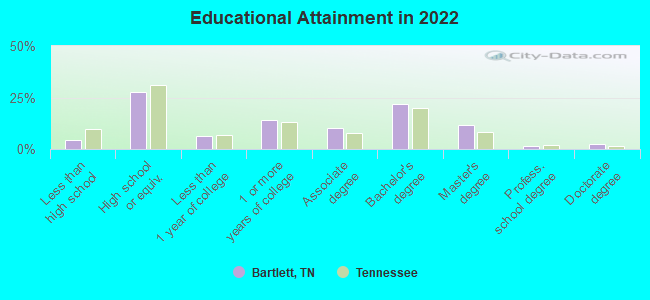
For population 25 years and over in Bartlett:
- High school or higher: 94.9%
- Bachelor's degree or higher: 36.0%
- Graduate or professional degree: 14.9%
- Unemployed: 2.3%
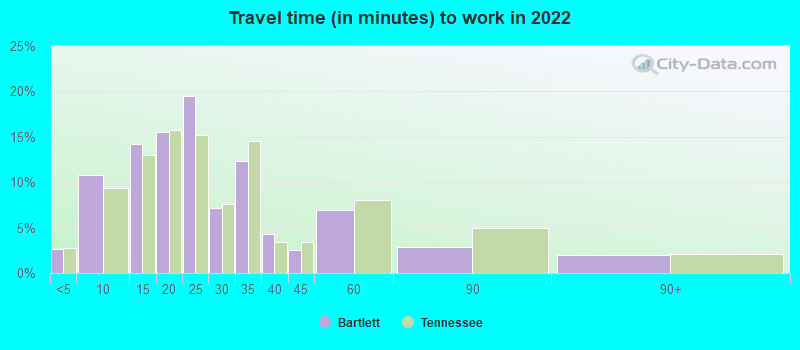
- Mean travel time to work (commute): 21.1 minutes
| Here: | 10.2 |
| Tennessee average: | 11.4 |
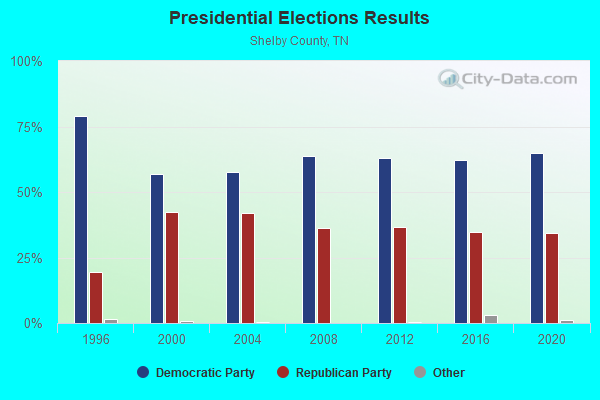
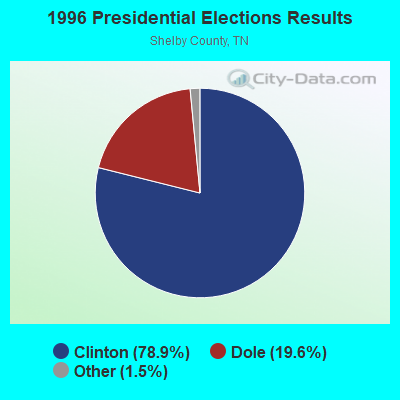
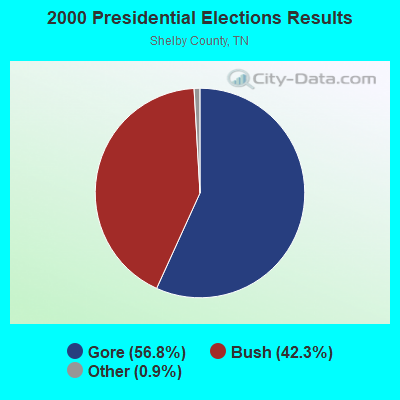
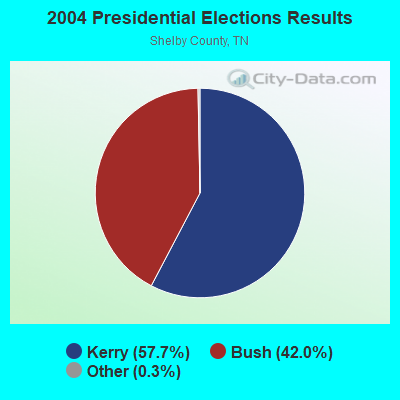
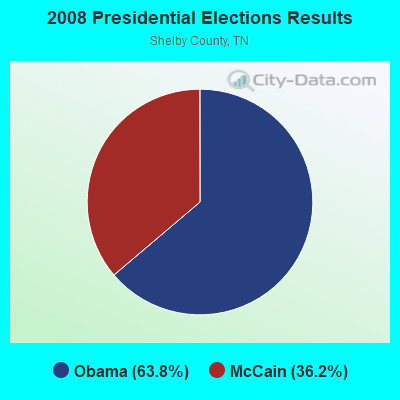
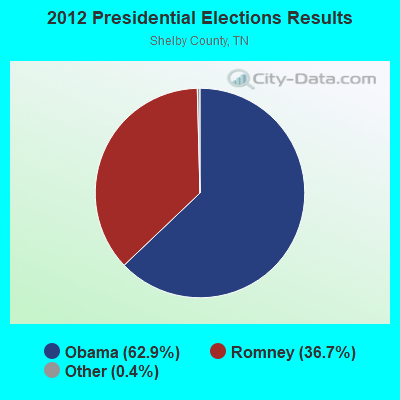
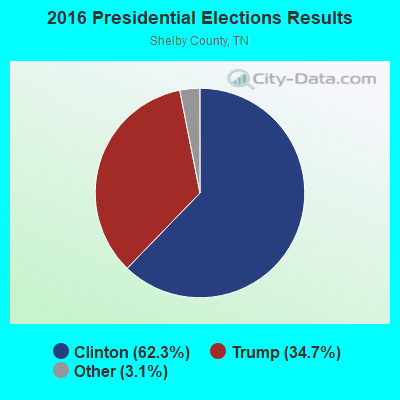
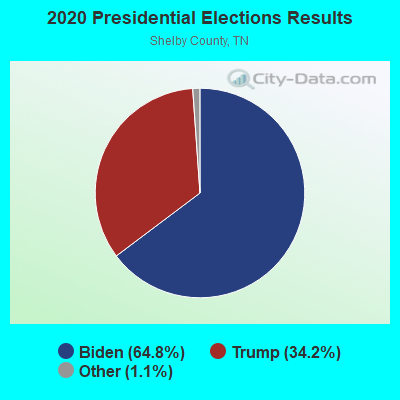
Graphs represent county-level data. Detailed 2008 Election Results
Religion statistics for Bartlett, TN (based on Shelby County data)
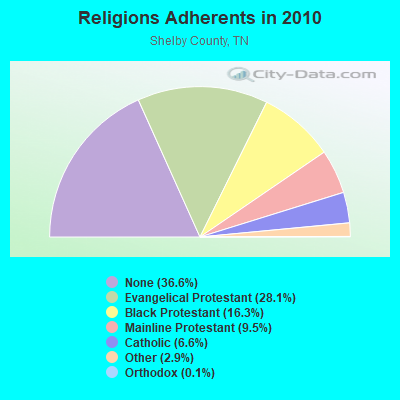
| Religion | Adherents | Congregations |
|---|---|---|
| Evangelical Protestant | 260,401 | 504 |
| Black Protestant | 150,894 | 292 |
| Mainline Protestant | 87,990 | 127 |
| Catholic | 61,202 | 29 |
| Other | 26,520 | 68 |
| Orthodox | 1,125 | 6 |
| None | 339,512 | - |
Food Environment Statistics:
| Shelby County: | 2.05 / 10,000 pop. |
| Tennessee: | 1.99 / 10,000 pop. |
| This county: | 0.14 / 10,000 pop. |
| State: | 0.17 / 10,000 pop. |
| Shelby County: | 0.54 / 10,000 pop. |
| Tennessee: | 0.65 / 10,000 pop. |
| Shelby County: | 4.25 / 10,000 pop. |
| State: | 5.16 / 10,000 pop. |
| Here: | 6.12 / 10,000 pop. |
| State: | 6.56 / 10,000 pop. |
| This county: | 11.3% |
| Tennessee: | 11.4% |
| Shelby County: | 32.8% |
| Tennessee: | 30.2% |
| This county: | 9.2% |
| State: | 13.5% |
Health and Nutrition:
| Bartlett: | 51.9% |
| Tennessee: | 49.3% |
| Bartlett: | 50.6% |
| State: | 46.1% |
| Here: | 28.7 |
| Tennessee: | 28.8 |
| This city: | 21.6% |
| Tennessee: | 21.0% |
| This city: | 9.1% |
| State: | 10.5% |
| This city: | 6.8 |
| Tennessee: | 6.8 |
| Bartlett: | 35.1% |
| State: | 33.9% |
| Bartlett: | 59.1% |
| Tennessee: | 55.9% |
| Here: | 80.1% |
| Tennessee: | 79.1% |
More about Health and Nutrition of Bartlett, TN Residents
| Local government employment and payroll (March 2022) | |||||
| Function | Full-time employees | Monthly full-time payroll | Average yearly full-time wage | Part-time employees | Monthly part-time payroll |
|---|---|---|---|---|---|
| Elementary and Secondary - Instruction | 818 | $3,347,632 | $49,110 | 49 | $61,578 |
| Elementary and Secondary - Other Total | 160 | $668,105 | $50,108 | 30 | $25,580 |
| Police Protection - Officers | 127 | $706,643 | $66,769 | 2 | $3,800 |
| Firefighters | 71 | $408,243 | $68,999 | 0 | $0 |
| Parks and Recreation | 46 | $201,652 | $52,605 | 132 | $12,138 |
| Streets and Highways | 43 | $184,703 | $51,545 | 0 | $0 |
| Solid Waste Management | 37 | $175,403 | $56,887 | 2 | $5,204 |
| Other and Unallocable | 33 | $141,085 | $51,304 | 10 | $9,994 |
| Health | 28 | $153,971 | $65,988 | 0 | $0 |
| Police - Other | 23 | $132,802 | $69,288 | 21 | $29,558 |
| Sewerage | 22 | $93,060 | $50,760 | 0 | $0 |
| Other Government Administration | 21 | $105,699 | $60,399 | 6 | $6,000 |
| Financial Administration | 20 | $104,412 | $62,647 | 1 | $709 |
| Judicial and Legal | 12 | $70,337 | $70,337 | 0 | $0 |
| Correction | 12 | $46,295 | $46,295 | 0 | $0 |
| Water Supply | 7 | $46,159 | $79,130 | 1 | $676 |
| Fire - Other | 1 | $5,438 | $65,256 | 0 | $0 |
| Totals for Government | 1,481 | $6,591,638 | $53,410 | 254 | $155,239 |
Bartlett government finances - Expenditure in 2021 (per resident):
- Construction - Regular Highways: $9,992,000 ($175.92)
Solid Waste Management: $2,719,000 ($47.87)
Parks and Recreation: $1,215,000 ($21.39)
Water Utilities: $615,000 ($10.83)
Police Protection: $252,000 ($4.44)
Natural Resources - Other: $167,000 ($2.94)
Sewerage: $55,000 ($0.97)
Central Staff Services: $2,000 ($0.04)
- Current Operations - Police Protection: $15,619,000 ($274.99)
Local Fire Protection: $11,685,000 ($205.73)
Parks and Recreation: $5,895,000 ($103.79)
Solid Waste Management: $5,605,000 ($98.68)
Regular Highways: $5,364,000 ($94.44)
Water Utilities: $3,760,000 ($66.20)
Central Staff Services: $2,620,000 ($46.13)
Sewerage: $2,495,000 ($43.93)
Financial Administration: $1,713,000 ($30.16)
General Public Buildings: $1,404,000 ($24.72)
Libraries: $1,205,000 ($21.22)
Judicial and Legal Services: $1,068,000 ($18.80)
Protective Inspection and Regulation - Other: $1,019,000 ($17.94)
Natural Resources - Other: $112,000 ($1.97)
General - Other: $57,000 ($1.00)
Housing and Community Development: $16,000 ($0.28)
- General - Interest on Debt: $3,147,000 ($55.41)
- Intergovernmental to Local - Other - Sewerage: $1,226,000 ($21.59)
Other - Water Utilities: $34,000 ($0.60)
- Other Capital Outlay - Police Protection: $361,000 ($6.36)
Solid Waste Management: $321,000 ($5.65)
Local Fire Protection: $268,000 ($4.72)
Parks and Recreation: $197,000 ($3.47)
General Public Building: $82,000 ($1.44)
Central Staff Services: $40,000 ($0.70)
Regular Highways: $40,000 ($0.70)
Sewerage: $20,000 ($0.35)
Water Utilities: $5,000 ($0.09)
Libraries: $2,000 ($0.04)
- Total Salaries and Wages: $30,079,000 ($529.58)
- Water Utilities - Interest on Debt: $154,000 ($2.71)
Bartlett government finances - Revenue in 2021 (per resident):
- Charges - Solid Waste Management: $7,332,000 ($129.09)
Sewerage: $4,122,000 ($72.57)
Parks and Recreation: $1,824,000 ($32.11)
Other: $1,415,000 ($24.91)
- Local Intergovernmental - General Local Government Support: $3,579,000 ($63.01)
Public Welfare: $1,000,000 ($17.61)
- Miscellaneous - Fines and Forfeits: $1,755,000 ($30.90)
General Revenue - Other: $801,000 ($14.10)
Special Assessments: $730,000 ($12.85)
Rents: $359,000 ($6.32)
Sale of Property: $152,000 ($2.68)
Donations From Private Sources: $44,000 ($0.77)
Interest Earnings: $37,000 ($0.65)
- Revenue - Water Utilities: $4,982,000 ($87.71)
- State Intergovernmental - General Local Government Support: $10,704,000 ($188.46)
Highways: $3,437,000 ($60.51)
Other: $40,000 ($0.70)
- Tax - Property: $25,035,000 ($440.77)
General Sales and Gross Receipts: $16,691,000 ($293.87)
Occupation and Business License - Other: $1,634,000 ($28.77)
Alcoholic Beverage Sales: $1,313,000 ($23.12)
Motor Vehicle License: $1,231,000 ($21.67)
Public Utilities Sales: $542,000 ($9.54)
Other Selective Sales: $124,000 ($2.18)
Alcoholic Beverage License: $32,000 ($0.56)
Bartlett government finances - Debt in 2021 (per resident):
- Long Term Debt - Outstanding Unspecified Public Purpose: $87,218,000 ($1535.58)
Beginning Outstanding - Unspecified Public Purpose: $82,394,000 ($1450.65)
Issue, Unspecified Public Purpose: $10,789,000 ($189.95)
Retired Unspecified Public Purpose: $5,965,000 ($105.02)
Bartlett government finances - Cash and Securities in 2021 (per resident):
- Bond Funds - Cash and Securities: $3,278,000 ($57.71)
- Other Funds - Cash and Securities: $90,922,000 ($1600.80)
4.35% of this county's 2021 resident taxpayers lived in other counties in 2020 ($59,303 average adjusted gross income)
| Here: | 4.35% |
| Tennessee average: | 8.49% |
0.02% of residents moved from foreign countries ($242 average AGI)
Shelby County: 0.02% Tennessee average: 0.02%
Top counties from which taxpayers relocated into this county between 2020 and 2021:
| from DeSoto County, MS | |
| from Fayette County, TN | |
| from Tipton County, TN |
5.27% of this county's 2020 resident taxpayers moved to other counties in 2021 ($68,956 average adjusted gross income)
| Here: | 5.27% |
| Tennessee average: | 7.40% |
0.02% of residents moved to foreign countries ($220 average AGI)
Shelby County: 0.02% Tennessee average: 0.01%
Top counties to which taxpayers relocated from this county between 2020 and 2021:
| to DeSoto County, MS | |
| to Fayette County, TN | |
| to Tipton County, TN |
| Businesses in Bartlett, TN | ||||
| Name | Count | Name | Count | |
|---|---|---|---|---|
| ALDI | 1 | Macy's | 1 | |
| AT&T | 1 | MasterBrand Cabinets | 2 | |
| Arby's | 1 | McDonald's | 2 | |
| AutoZone | 1 | Motherhood Maternity | 1 | |
| Baskin-Robbins | 2 | Nike | 4 | |
| Blockbuster | 1 | Nissan | 1 | |
| Burger King | 1 | Papa John's Pizza | 1 | |
| Chevrolet | 1 | Payless | 3 | |
| Circle K | 3 | Pizza Hut | 1 | |
| Cricket Wireless | 1 | Quiznos | 1 | |
| DHL | 1 | RadioShack | 1 | |
| Dairy Queen | 1 | Rite Aid | 1 | |
| Express | 1 | SONIC Drive-In | 1 | |
| FedEx | 6 | Sam's Club | 1 | |
| GNC | 1 | Shoe Carnival | 1 | |
| GameStop | 1 | Sprint Nextel | 1 | |
| H&R Block | 3 | Starbucks | 1 | |
| Haworth | 1 | Suburban | 1 | |
| Hilton | 1 | Subway | 2 | |
| Hobby Lobby | 1 | T-Mobile | 3 | |
| Honda | 1 | Taco Bell | 1 | |
| Jones New York | 1 | The Room Place | 1 | |
| KFC | 1 | UPS | 1 | |
| Kroger | 2 | Waffle House | 1 | |
| Lane Furniture | 2 | Walgreens | 4 | |
| Little Caesars Pizza | 1 | Walmart | 2 | |
| Lowe's | 1 | Wendy's | 2 | |
Strongest AM radio stations in Bartlett:
- WMQM (1600 AM; 50 kW; LAKELAND, TN; Owner: WMQM, INC.)
- WGSF (1030 AM; 50 kW; MEMPHIS, TN; Owner: FLINN BROADCASTING CORPORATION)
- WDIA (1070 AM; 50 kW; MEMPHIS, TN; Owner: CLEAR CHANNEL BROADCASTING LICENSES, INC.)
- WMC (790 AM; 5 kW; MEMPHIS, TN; Owner: INFINITY RADIO OPERATIONS INC.)
- WCRV (640 AM; 50 kW; COLLIERVILLE, TN; Owner: BOTT BROADCASTING COMPANY/TENNESSEE)
- WJCE (680 AM; 10 kW; MEMPHIS, TN; Owner: ENTERCOM MEMPHIS LICENSE, LLC)
- KWAM (990 AM; 10 kW; MEMPHIS, TN; Owner: CONCORD MEDIA GROUP, INC.)
- WREC (600 AM; 5 kW; MEMPHIS, TN; Owner: CLEAR CHANNEL BROADCASTING LICENSES, INC.)
- WHBQ (560 AM; 5 kW; MEMPHIS, TN; Owner: FLINN BROADCASTING CORPORATION)
- WLRM (1380 AM; 2 kW; MILLINGTON, TN; Owner: WORLD OVERCOMERS OUTREACH MINISTRIES)
- WPLX (1170 AM; 10 kW; GERMANTOWN, TN; Owner: EDUCATIONAL MEDIA FOUNDATION)
- WOWW (1430 AM; 2 kW; GERMANTOWN, TN; Owner: FLINN BROADCASTING CORPORATION)
- WBBP (1480 AM; 5 kW; MEMPHIS, TN)
Strongest FM radio stations in Bartlett:
- WMFS (92.9 FM; BARTLETT, TN; Owner: INFINITY BROADCASTING CORP. OF ILLINOIS)
- WSRR-FM (98.1 FM; MILLINGTON, TN; Owner: KOOL BROADCASTING, INC.)
- WMC-FM (99.7 FM; MEMPHIS, TN; Owner: INFINITY RADIO OPERATIONS INC.)
- WGKX (105.9 FM; MEMPHIS, TN; Owner: KIX BROADCASTING, INC.)
- WRVR-FM (104.5 FM; MEMPHIS, TN; Owner: ENTERCOM MEMPHIS LICENSE, LLC)
- WEGR (102.7 FM; MEMPHIS, TN; Owner: CLEAR CHANNEL BROADCASTING LICENSES, INC.)
- WKNO-FM (91.1 FM; MEMPHIS, TN; Owner: MID-SOUTH PUBLIC COMMUNICATIONS FOUNDATION)
- WQOX (88.5 FM; MEMPHIS, TN; Owner: MEMPHIS CITY SCHOOLS)
- WUMR (91.7 FM; MEMPHIS, TN; Owner: THE UNIVERSITY OF MEMPHIS)
- WEVL (89.9 FM; MEMPHIS, TN; Owner: SOUTHERN COMMUNICATION VOLUNTEERS, INC.)
- WMPS (107.5 FM; GERMANTOWN, TN; Owner: FLINN BROADCASTING CORPORATION)
- WHRK (97.1 FM; MEMPHIS, TN; Owner: CLEAR CHANNEL BROADCASTING LICENSES, INC.)
- WYPL (89.3 FM; MEMPHIS, TN; Owner: MEMPHIS/SHELBY COUNTY PUBLIC LIBRARY & INFO CNTR.)
- WHAL-FM (95.7 FM; OLIVE BRANCH, MS; Owner: CLEAR CHANNEL BROADCASTING LICENSES, INC.)
- KJMS (101.1 FM; MEMPHIS, TN; Owner: CLEAR CHANNEL BROADCASTING LICENSES, INC.)
- KXHT (107.1 FM; MARION, AR; Owner: FLINN BROADCASTING CORPORATION)
- WMBZ (94.1 FM; GERMANTOWN, TN; Owner: ENTERCOM MEMPHIS LICENSE, LLC)
- WKVF (94.9 FM; BYHALIA, MS; Owner: EDUCATIONAL MEDIA FOUNDATION)
TV broadcast stations around Bartlett:
- WPXX-TV (Channel 50; MEMPHIS, TN; Owner: FLINN BROADCASTING CORPORATION)
- WREG-TV (Channel 3; MEMPHIS, TN; Owner: NEW YORK TIMES MANAGEMENT SERVICES)
- W57CG (Channel 57; MEMPHIS, TN; Owner: GEORGE S. FLINN, JR.)
- WHBQ-TV (Channel 13; MEMPHIS, TN; Owner: FOX TELEVISION STATIONS, INC.)
- WMC-TV (Channel 5; MEMPHIS, TN; Owner: RAYCOM AMERICA, INC.)
- WLMT (Channel 30; MEMPHIS, TN; Owner: CLEAR CHANNEL BROADCASTING LICENSES, INC.)
- WPTY-TV (Channel 24; MEMPHIS, TN; Owner: CLEAR CHANNEL BROADCASTING LICENSES, INC.)
- WKNO (Channel 10; MEMPHIS, TN; Owner: MID-SOUTH PUBLIC COMMUNICATIONS FOUNDATION)
- W67CV (Channel 67; MEMPHIS, TN; Owner: GEORGE S. FLINN, JR.)
- WJRJ-LP (Channel 59; MEMPHIS, TN; Owner: WORD OF GOD FELLOWSHIP, INC.)
- WBXP-CA (Channel 44; MEMPHIS, TN; Owner: THE BOX WORLDWIDE LLC)
- W42BY (Channel 42; MEMPHIS, TN; Owner: THREE ANGELS BROADCASTING NETWORK, INC,)
- WBUY (Channel 40; HOLLY SPRINGS, MS; Owner: TRINITY BROADCASTING NETWORK)
- W61BP (Channel 61; MEMPHIS, TN; Owner: JIMMY BOYD)
- National Bridge Inventory (NBI) Statistics
- 40Number of bridges
- 443ft / 135mTotal length
- $2,949,000Total costs
- 257,339Total average daily traffic
- 12,005Total average daily truck traffic
- New bridges - historical statistics
- 11920-1929
- 41950-1959
- 31960-1969
- 61970-1979
- 11980-1989
- 101990-1999
- 92000-2009
- 12010-2019
- 52020-2022
FCC Registered Antenna Towers:
52 (See the full list of FCC Registered Antenna Towers in Bartlett)FCC Registered Private Land Mobile Towers:
2 (See the full list of FCC Registered Private Land Mobile Towers in Bartlett, TN)FCC Registered Broadcast Land Mobile Towers:
19 (See the full list of FCC Registered Broadcast Land Mobile Towers)FCC Registered Microwave Towers:
5- BARTLETT, 6348 Summer Ave (Lat: 35.189417 Lon: -89.851944), Type: Mast, Structure height: 91.4 m, Overall height: 96 m, Call Sign: WQIJ459,
Assigned Frequencies: 6063.80 MHz, 5974.85 MHz, 6123.10 MHz, 6152.75 MHz, Grant Date: 11/30/2017, Expiration Date: 02/26/2028, Certifier: Michael A Carroll Sr, Registrant: Tdot Wireless Systems Licensing, 6600 Centennial Blvd., Nashville, TN 37243-0365, Phone: (615) 350-3430, Email:
- MEMPHIS, 6348 Summer Ave (Lat: 35.189444 Lon: -89.851917), Type: Mast, Structure height: 91.4 m, Overall height: 96 m, Call Sign: WQUC971,
Assigned Frequencies: 6625.00 MHz, 6685.00 MHz, Grant Date: 06/06/2014, Expiration Date: 06/06/2024, Certifier: Stephen D Philyaw, Registrant: Tennessee Dept Of Safety, 225 Ezell Pike, Nashville, TN 37217, Phone: (731) 225-0930, Fax: (615) 360-8033, Email:
- MDSP, 3730 Appling Rd (Lat: 35.228083 Lon: -89.807333), Type: Mtower, Structure height: 30 m, Overall height: 30.5 m, Call Sign: WQXV827, Licensee ID: L00106127,
Assigned Frequencies: 11075.0 MHz, 10795.0 MHz, Grant Date: 06/23/2016, Expiration Date: 06/23/2026, Certifier: A K Mcdonald, Registrant: City Of Bartlett, 6400 Stage Road, Bartlett, TN 38134, Phone: (901) 385-6400, Email:
- ELLIS RD, Ellis Road Cemetery Site - Near 8340 Ellis Road (Lat: 35.221500 Lon: -89.783944), Type: Ltower, Structure height: 103.6 m, Overall height: 106.4 m, Call Sign: WRJN758, Licensee ID: L00053495,
Assigned Frequencies: 6315.84 MHz, 5945.20 MHz, Grant Date: 09/30/2020, Expiration Date: 09/30/2030, Certifier: John Oconnor, Registrant: Memphis, City - Communications Maintenan, 79 S. Flicker St, Memphis, TN 38104, Phone: (901) 323-5330, Email:
- BARTLETT, 3155 Bartlett Corporate Dr (Lat: 35.211111 Lon: -89.812583), Type: Mast, Structure height: 87.8 m, Overall height: 89 m, Call Sign: WLM904,
Assigned Frequencies: 5945.20 MHz, 5974.85 MHz, 6004.50 MHz, 6123.10 MHz, 6093.45 MHz, 6152.75 MHz, Grant Date: 01/25/2011, Expiration Date: 02/01/2021, Cancellation Date: 09/04/2019, Certifier: Gregory M Romano, Registrant: Verizon Wireless, 5055 North Point Pkwy, Np2ne Network Engineering, Alpharetta, GA 30022, Phone: (770) 797-1070, Email:
FCC Registered Amateur Radio Licenses:
378 (See the full list of FCC Registered Amateur Radio Licenses in Bartlett)FAA Registered Aircraft:
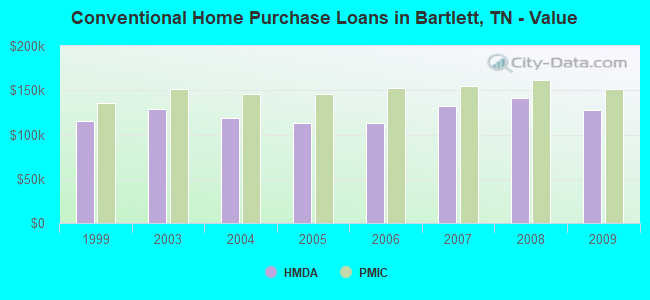
37 (See the full list of FAA Registered Aircraft in Bartlett)| Home Mortgage Disclosure Act Aggregated Statistics For Year 2009 (Based on 2 full and 7 partial tracts) | ||||||||||||
| A) FHA, FSA/RHS & VA Home Purchase Loans | B) Conventional Home Purchase Loans | C) Refinancings | D) Home Improvement Loans | F) Non-occupant Loans on < 5 Family Dwellings (A B C & D) | G) Loans On Manufactured Home Dwelling (A B C & D) | |||||||
|---|---|---|---|---|---|---|---|---|---|---|---|---|
| Number | Average Value | Number | Average Value | Number | Average Value | Number | Average Value | Number | Average Value | Number | Average Value | |
| LOANS ORIGINATED | 337 | $143,398 | 121 | $127,384 | 749 | $137,169 | 33 | $40,402 | 71 | $107,940 | 0 | $0 |
| APPLICATIONS APPROVED, NOT ACCEPTED | 10 | $127,261 | 6 | $170,042 | 74 | $137,447 | 2 | $7,985 | 2 | $106,135 | 0 | $0 |
| APPLICATIONS DENIED | 28 | $125,499 | 20 | $98,350 | 282 | $140,825 | 33 | $26,473 | 25 | $81,321 | 2 | $194,075 |
| APPLICATIONS WITHDRAWN | 28 | $143,446 | 15 | $113,841 | 217 | $147,505 | 3 | $43,437 | 13 | $88,700 | 1 | $4,090 |
| FILES CLOSED FOR INCOMPLETENESS | 4 | $153,972 | 4 | $151,840 | 60 | $149,830 | 3 | $35,107 | 3 | $75,990 | 0 | $0 |
Detailed mortgage data for all 9 tracts in Bartlett, TN
| Private Mortgage Insurance Companies Aggregated Statistics For Year 2009 (Based on 2 full and 7 partial tracts) | ||||||
| A) Conventional Home Purchase Loans | B) Refinancings | C) Non-occupant Loans on < 5 Family Dwellings (A & B) | ||||
|---|---|---|---|---|---|---|
| Number | Average Value | Number | Average Value | Number | Average Value | |
| LOANS ORIGINATED | 26 | $151,922 | 28 | $164,464 | 0 | $0 |
| APPLICATIONS APPROVED, NOT ACCEPTED | 7 | $147,644 | 17 | $171,914 | 2 | $151,460 |
| APPLICATIONS DENIED | 4 | $155,128 | 4 | $173,212 | 0 | $0 |
| APPLICATIONS WITHDRAWN | 0 | $0 | 3 | $97,770 | 0 | $0 |
| FILES CLOSED FOR INCOMPLETENESS | 2 | $112,380 | 1 | $234,500 | 0 | $0 |
2005 - 2018 National Fire Incident Reporting System (NFIRS) incidents
- Fire incident types reported to NFIRS in Bartlett, TN
- 92750.5%Outside Fires
- 55630.3%Structure Fires
- 25814.1%Mobile Property/Vehicle Fires
- 935.1%Other
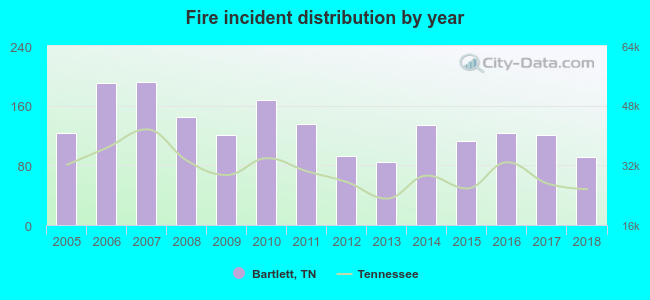 According to the data from the years 2005 - 2018 the average number of fire incidents per year is 131. The highest number of fire incidents - 192 took place in 2007, and the least - 85 in 2013. The data has a decreasing trend.
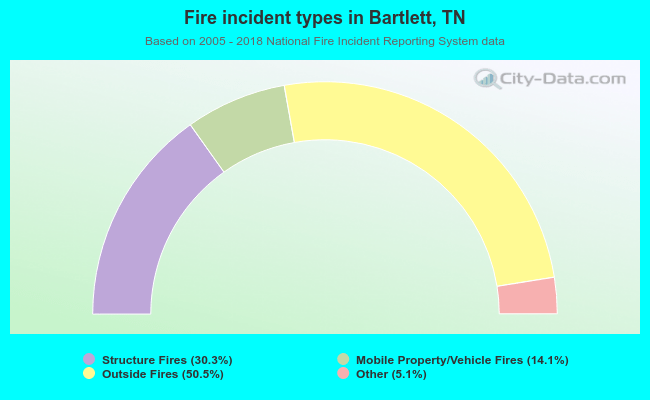 When looking into fire subcategories, the most incidents belonged to: Outside Fires (50.5%), and Structure Fires (30.3%).
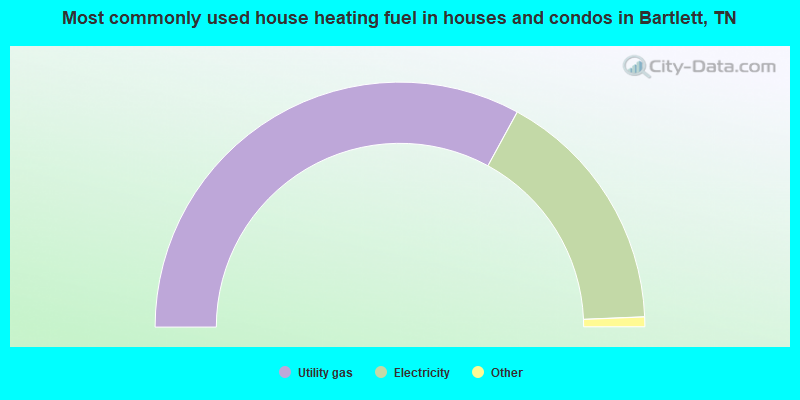
- 65.9%Utility gas
- 32.8%Electricity
- 1.1%Bottled, tank, or LP gas
- 0.2%Wood
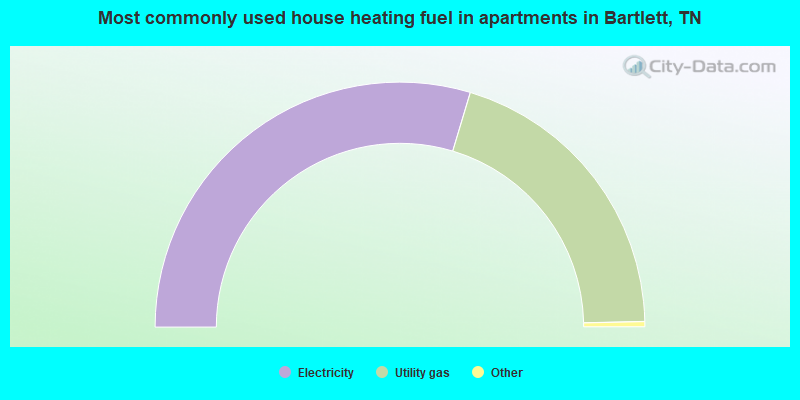
- 59.3%Electricity
- 40.0%Utility gas
- 0.4%No fuel used
- 0.3%Bottled, tank, or LP gas
Bartlett compared to Tennessee state average:
- Unemployed percentage significantly below state average.
- Black race population percentage above state average.
- Foreign-born population percentage above state average.
- Renting percentage significantly below state average.
- Length of stay since moving in above state average.
- Number of rooms per house above state average.
- Percentage of population with a bachelor's degree or higher above state average.
Bartlett on our top lists:
- #3 on the list of "Top 101 cities with the smallest household incomes disparities (population 50,000+)"
- #13 on the list of "Top 101 cities with the smallest racial income disparities between White and Black householders (with at least 2,000 householders)"
- #14 on the list of "Top 101 cities with the smallest percentage of unmarried partner households (population 50,000+)"
- #16 on the list of "Top 101 cities with largest percentage of males in industries: transportation and warehousing (population 50,000+)"
- #18 on the list of "Top 101 cities with the least people below 50% of the poverty level (population 50,000+)"
- #21 on the list of "Top 101 cities with the least people below the poverty level (population 50,000+)"
- #21 on the list of "Top 101 cities with the smallest city-data.com crime index per police officer (population 50,000+)"
- #24 on the list of "Top 100 cities with biggest houses (pop. 50,000+)"
- #31 on the list of "Top 101 cities with largest percentage of females in occupations: health diagnosing and treating practitioners and other technical occupations (population 50,000+)"
- #36 on the list of "Top 101 cities with the lowest number of burglaries per 100,000 residents (population 50,000+)"
- #36 on the list of "Top 101 cities with the lowest number of auto thefts per 100,000 residents (population 50,000+)"
- #40 on the list of "Top 100 cities with lowest ratio of median house value to median household income (pop. 50,000+)"
- #41 on the list of "Top 101 cities with largest percentage of males in occupations: law enforcement workers including supervisors (population 50,000+)"
- #48 on the list of "Top 101 cities with the smallest house values disparities (population 50,000+)"
- #51 on the list of "Top 101 cities with the lowest number of thefts per 100,000 residents (population 50,000+)"
- #54 on the list of "Top 101 cities with the highest percentage of English-only speaking households, population 50,000+"
- #57 on the list of "Top 101 cities with the lowest number of murders per 100,000 residents (population 50,000+)"
- #58 on the list of "Top 101 cities with the lowest city-data.com crime index (population 50,000+)"
- #60 on the list of "Top 101 cities with largest percentage of females in industries: construction (population 50,000+)"
- #64 on the list of "Top 101 cities with largest percentage of females in occupations: education, training, and library occupations (population 50,000+)"
- #1 on the list of "Top 101 counties with the most Black Protestant adherents"
- #2 on the list of "Top 101 counties with the most Black Protestant congregations"
- #3 on the list of "Top 101 counties with the highest number of infant deaths per 1000 residents 2007-2013 (pop. 50,000+)"
- #9 on the list of "Top 101 counties with the lowest percentage of residents that drank alcohol in the past 30 days"
- #10 on the list of "Top 101 counties with the highest average weight of females"

|
|
Total of 325 patent applications in 2008-2024.