Willing, New York (NY) income map, earnings map, and wages data
The median household income in Willing, NY in 2022 was $65,280, which was 21.9% less than the median annual income of $79,557 across the entire state of New York. Compared to the median income of $35,859 in 2000 this represents an increase of 45.1%. The per capita income in 2022 was $32,826, which means an increase of 50.9% compared to 2000 when it was $16,109.
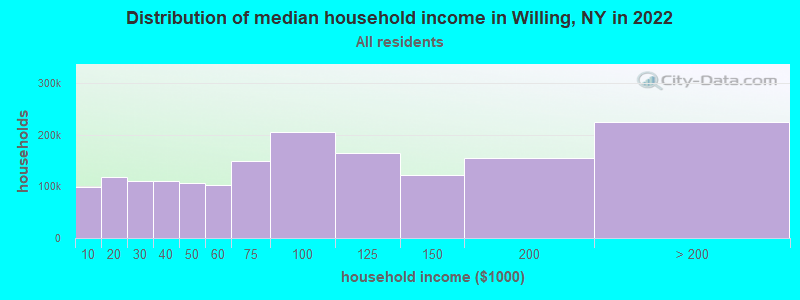
Income statistics for all residents
Median household income in Willing, NY in 2022:| Willing: | $65,280 |
| New York: | $79,557 |
Change in median household income between 2000 and 2022:| Willing, New York: | +82.0% |
| State: | +83.3% |
Number of households with income < $10k:| Willing: | 6.8% (218,108) |
| State: | 6.8% (527,598) |
Number of households with income $10k - 20k:| Willing: | 7.4% (237,638) |
| State: | 7.4% (574,940) |
Number of households with income $20k - 30k:| Willing: | 6.7% (213,969) |
| State: | 6.7% (517,718) |
Number of households with income $30k - 40k:| Willing: | 6.5% (209,388) |
| State: | 6.5% (506,674) |
Number of households with income $40k - 50k:| Willing: | 6.1% (194,401) |
| New York: | 6.1% (470,439) |
Number of households with income $50k - 60k:| Willing: | 5.8% (187,622) |
| State: | 5.8% (454,042) |
Number of households with income $60k - 75k:| Willing: | 8.5% (271,695) |
| State: | 8.5% (657,508) |
Number of households with income $75k - 100k:| Willing: | 11.6% (371,821) |
| State: | 11.6% (899,824) |
Number of households with income $100k - 125k:| Willing: | 9.3% (299,101) |
| State: | 9.3% (723,825) |
Number of households with income $125k - 150k:| Willing: | 7.1% (228,284) |
| State: | 7.1% (552,420) |
Number of households with income $150k - 200k:| Willing: | 9.4% (300,483) |
| New York: | 9.4% (727,051) |
Number of households with income > $200k:| Willing: | 15.0% (480,452) |
| State: | 15.0% (1,162,269) |
Aggregate household income in Willing in 2022: $4,815,890,798
Median family income in Willing in 2022:| Willing: | $75,859 |
| State: | $99,066 |
Median non-family income in Willing in 2022:| Willing: | $39,574 |
| New York: | $50,181 |
Change in median non-family income between 2000 and 2022:| Willing, New York: | +81.3% |
| New York: | +85.4% |
Median per capita income in Willing in 2022:| Willing: | $32,826 |
| State: | $47,421 |
Change in median per capita income between 2000 and 2022:| Willing, New York: | +103.8% |
| New York: | +102.7% |
Income statistics for White residents
Median household income in Willing, NY in 2022:| Willing: | $65,739 |
| New York: | $89,408 |
Change in median household income between 2000 and 2022:| Willing, New York: | +83.3% |
| State: | +85.5% |
Number of households with income < $10k:| Willing: | 4.8% (83,538) |
| State: | 4.8% (225,550) |
Number of households with income $10k - 20k:| Willing: | 6.1% (107,632) |
| State: | 6.1% (289,425) |
Number of households with income $20k - 30k:| Willing: | 6.0% (104,400) |
| New York: | 5.9% (280,254) |
Number of households with income $30k - 40k:| Willing: | 6.1% (107,503) |
| State: | 6.1% (288,263) |
Number of households with income $40k - 50k:| Willing: | 5.9% (103,811) |
| New York: | 5.9% (278,079) |
Number of households with income $50k - 60k:| Willing: | 5.7% (99,939) |
| New York: | 5.7% (267,554) |
Number of households with income $60k - 75k:| Willing: | 8.5% (148,828) |
| New York: | 8.4% (398,344) |
Number of households with income $75k - 100k:| Willing: | 11.8% (207,257) |
| State: | 11.8% (554,841) |
Number of households with income $100k - 125k:| Willing: | 10.0% (174,989) |
| State: | 10.0% (469,794) |
Number of households with income $125k - 150k:| Willing: | 7.7% (134,196) |
| State: | 7.6% (360,467) |
Number of households with income $150k - 200k:| Willing: | 10.1% (176,768) |
| State: | 10.1% (477,078) |
Number of households with income > $200k:| Willing: | 17.4% (304,913) |
| State: | 17.6% (829,233) |
Aggregate household income in Willing in 2022: $3,259,262,445
Median family income in Willing in 2022:| Willing: | $77,525 |
| State: | $115,170 |
Number of families with income < $10k:| Willing: | 3.0% (7) |
| State: | 2.5% (68,851) |
Number of families with income $10k - 20k:| Willing: | 10.6% (23) |
| State: | 3.0% (83,127) |
Number of families with income $20k - 30k:| Willing: | 10.1% (22) |
| State: | 3.5% (97,578) |
Number of families with income $30k - 40k:| Willing: | 9.8% (21) |
| New York: | 4.1% (114,108) |
Number of families with income $40k - 50k:| Willing: | 14.6% (32) |
| State: | 4.7% (130,902) |
Number of families with income $50k - 60k:| Willing: | 7.6% (17) |
| New York: | 4.9% (135,118) |
Number of families with income $60k - 75k:| Willing: | 9.6% (21) |
| New York: | 7.8% (216,254) |
Number of families with income $75k - 100k:| Willing: | 14.7% (32) |
| New York: | 12.4% (342,382) |
Number of families with income $100k - 125k:| Willing: | 11.0% (24) |
| State: | 11.4% (314,917) |
Number of families with income $125k - 150k:| Willing: | 2.5% (5) |
| State: | 9.4% (260,489) |
Number of families with income $150k - 200k:| Willing: | 1.8% (4) |
| New York: | 13.2% (365,586) |
Number of families with income > $200k:| Willing: | 4.6% (10) |
| State: | 23.2% (642,319) |
Median non-family income in Willing in 2022:| Willing: | $40,142 |
| New York: | $54,783 |
Change in median non-family income between 2000 and 2022:| Willing, New York: | +83.9% |
| New York: | +87.9% |
Median per capita income in Willing in 2022:| Willing: | $34,083 |
| State: | $57,640 |
Change in median per capita income between 2000 and 2022:| Willing, New York: | +111.0% |
| State: | +111.6% |
Income statistics for Hispanic or Latino residents
Median household income in Willing, NY in 2022:| Willing: | $17,199 |
| State: | $60,468 |
Change in median household income between 2000 and 2022:| Willing, New York: | +96.6% |
| State: | +98.3% |
Number of households with income < $10k:| Willing: | 10.0% (18,232) |
| New York: | 9.9% (127,185) |
Number of households with income $10k - 20k:| Willing: | 10.7% (19,626) |
| State: | 10.7% (136,699) |
Number of households with income $20k - 30k:| Willing: | 8.1% (14,778) |
| State: | 8.1% (102,991) |
Number of households with income $30k - 40k:| Willing: | 7.8% (14,315) |
| State: | 7.8% (100,149) |
Number of households with income $40k - 50k:| Willing: | 6.8% (12,524) |
| State: | 6.9% (87,760) |
Number of households with income $50k - 60k:| Willing: | 6.3% (11,598) |
| New York: | 6.3% (80,968) |
Number of households with income $60k - 75k:| Willing: | 8.6% (15,808) |
| State: | 8.7% (110,631) |
Number of households with income $75k - 100k:| Willing: | 11.2% (20,405) |
| State: | 11.2% (142,787) |
Number of households with income $100k - 125k:| Willing: | 8.2% (14,952) |
| State: | 8.2% (104,850) |
Number of households with income $125k - 150k:| Willing: | 6.3% (11,472) |
| State: | 6.3% (80,274) |
Number of households with income $150k - 200k:| Willing: | 7.4% (13,562) |
| New York: | 7.4% (95,117) |
Number of households with income > $200k:| Willing: | 8.6% (15,641) |
| New York: | 8.6% (109,514) |
Aggregate household income in Willing in 2022: $224,705
Median family income in Willing in 2022:| Willing: | $18,555 |
| State: | $68,770 |
Number of families with income < $10k:| Willing: | 5.0% (3) |
| State: | 6.9% (58,565) |
Number of families with income $10k - 20k:| Willing: | 18.4% (13) |
| State: | 7.0% (59,058) |
Number of families with income $20k - 30k:| Willing: | 17.1% (12) |
| State: | 8.0% (68,048) |
Number of families with income $30k - 40k:| Willing: | 14.3% (10) |
| State: | 8.4% (70,668) |
Number of families with income $40k - 50k:| Willing: | 16.5% (11) |
| State: | 7.4% (62,941) |
Number of families with income $50k - 60k:| Willing: | 6.7% (5) |
| State: | 6.6% (55,592) |
Number of families with income $60k - 75k:| Willing: | 7.0% (5) |
| State: | 9.3% (78,564) |
Number of families with income $75k - 100k:| Willing: | 8.0% (5) |
| State: | 12.6% (106,685) |
Number of families with income $100k - 125k:| Willing: | 4.4% (3) |
| New York: | 9.4% (79,139) |
Number of families with income $125k - 150k:| Willing: | 0.8% (1) |
| State: | 6.9% (58,255) |
Number of families with income $150k - 200k:| Willing: | 0.6% (0) |
| State: | 8.3% (69,877) |
Number of families with income > $200k:| Willing: | 1.1% (1) |
| State: | 9.3% (78,555) |
Median per capita income in Willing in 2022:| Willing: | $4,393 |
| State: | $29,761 |
Change in median per capita income between 2000 and 2022:| Willing, New York: | +127.3% |
| State: | +132.7% |
Income statistics for Multirace residents
Number of households with income < $10k:| Willing: | 8.9% (1,573) |
| State: | 8.9% (57,924) |
Number of households with income $10k - 20k:| Willing: | 8.7% (1,537) |
| State: | 8.7% (56,590) |
Number of households with income $20k - 30k:| Willing: | 7.1% (1,258) |
| State: | 7.1% (46,287) |
Number of households with income $30k - 40k:| Willing: | 6.9% (1,227) |
| New York: | 6.9% (45,132) |
Number of households with income $40k - 50k:| Willing: | 5.8% (1,031) |
| State: | 5.8% (37,946) |
Number of households with income $50k - 60k:| Willing: | 5.6% (989) |
| State: | 5.6% (36,410) |
Number of households with income $60k - 75k:| Willing: | 7.8% (1,381) |
| State: | 7.8% (50,819) |
Number of households with income $75k - 100k:| Willing: | 11.7% (2,065) |
| New York: | 11.7% (76,024) |
Number of households with income $100k - 125k:| Willing: | 9.3% (1,648) |
| State: | 9.3% (60,635) |
Number of households with income $125k - 150k:| Willing: | 6.2% (1,101) |
| State: | 6.2% (40,533) |
Number of households with income $150k - 200k:| Willing: | 8.7% (1,533) |
| State: | 8.6% (56,409) |
Number of households with income > $200k:| Willing: | 13.4% (2,375) |
| New York: | 13.4% (87,442) |
Median per capita income in Willing in 2022:| Willing: | $1,994 |
| New York: | $36,931 |