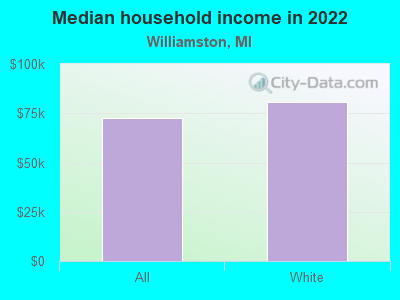
The median household income in Williamston, MI in 2022 was $72,771, which was 7.9% greater than the median annual income of $66,986 across the entire state of Michigan. Compared to the median income of $39,727 in 2000 this represents an increase of 45.4%. The per capita income in 2022 was $49,791, which means an increase of 54.2% compared to 2000 when it was $22,798.
Whole page based on the data from 2000 / 2022 when the population of Williamston, Michigan was 3,441 / 3,831
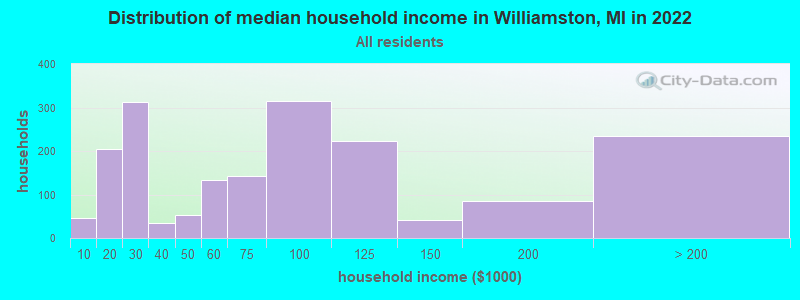
Income statistics for all residents
Median household income in Williamston, MI in 2022:
Williamston:
$72,771
State:
$66,986
Change in median household income between 2000 and 2022:
Williamston, Michigan:
+83.2%
State:
+50.0%
Number of households with income < $10k:
Williamston:
2.5% (46)
State:
5.7% (231,223)
Number of households with income $10k - 20k:
Williamston:
11.2% (204)
Michigan:
7.5% (306,955)
Number of households with income $20k - 30k:
Williamston:
17.2% (313)
State:
7.9% (324,153)
Number of households with income $30k - 40k:
Williamston:
1.9% (35)
Michigan:
8.3% (341,408)
Number of households with income $40k - 50k:
Williamston:
2.9% (52)
Michigan:
7.9% (322,255)
Number of households with income $50k - 60k:
Williamston:
7.3% (133)
Michigan:
7.5% (305,914)
Number of households with income $60k - 75k:
Williamston:
7.8% (143)
State:
10.1% (414,440)
Number of households with income $75k - 100k:
Williamston:
17.2% (314)
State:
13.2% (538,299)
Number of households with income $100k - 125k:
Williamston:
12.3% (224)
State:
9.7% (396,282)
Number of households with income $125k - 150k:
Williamston:
2.2% (41)
State:
6.7% (273,144)
Number of households with income $150k - 200k:
Williamston:
4.6% (84)
State:
7.5% (305,077)
Number of households with income > $200k:
Williamston:
12.9% (235)
State:
8.1% (330,644)
Aggregate household income in Williamston in 2022: $189,975,147
Median family income in Williamston in 2022:
Williamston:
$116,153
State:
$85,865
Number of families with income $10k - 20k:
Williamston:
2.1% (21)
State:
3.9% (100,567)
Number of families with income $20k - 30k:
Williamston:
7.9% (79)
Michigan:
5.0% (127,320)
Number of families with income $30k - 40k:
Williamston:
3.8% (38)
Michigan:
6.4% (163,565)
Number of families with income $40k - 50k:
Williamston:
0.4% (4)
Michigan:
6.8% (172,384)
Number of families with income $50k - 60k:
Williamston:
9.9% (99)
State:
7.1% (179,870)
Number of families with income $60k - 75k:
Williamston:
7.7% (77)
State:
10.3% (263,723)
Number of families with income $75k - 100k:
Williamston:
18.4% (184)
State:
15.0% (383,364)
Number of families with income $100k - 125k:
Williamston:
14.9% (149)
State:
11.8% (301,751)
Number of families with income $125k - 150k:
Williamston:
3.7% (37)
Michigan:
8.6% (220,338)
Number of families with income $150k - 200k:
Williamston:
8.3% (83)
State:
10.2% (259,462)
Number of families with income > $200k:
Williamston:
22.9% (229)
State:
11.3% (287,206)
Median non-family income in Williamston in 2022:
Williamston:
$28,959
State:
$40,459
Change in median non-family income between 2000 and 2022:
Williamston, Michigan:
+15.3%
Michigan:
+54.5%
Median per capita income in Williamston in 2022:
Williamston:
$49,792
Michigan:
$38,151
Change in median per capita income between 2000 and 2022:
Williamston, Michigan:
+118.4%
Michigan:
+72.1%
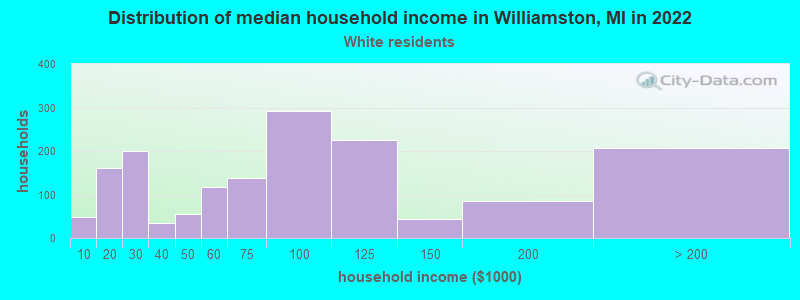
Income statistics for White residents
Median household income in Williamston, MI in 2022:
Williamston:
$80,558
State:
$71,609
Change in median household income between 2000 and 2022:
Williamston, Michigan:
+103.6%
State:
+52.9%
Number of households with income < $10k:
Williamston:
3.0% (48)
State:
4.4% (140,440)
Number of households with income $10k - 20k:
Williamston:
10.0% (160)
Michigan:
6.5% (205,547)
Number of households with income $20k - 30k:
Williamston:
12.5% (200)
State:
7.6% (242,254)
Number of households with income $30k - 40k:
Williamston:
2.1% (34)
Michigan:
8.1% (257,175)
Number of households with income $40k - 50k:
Williamston:
3.4% (55)
State:
7.8% (246,839)
Number of households with income $50k - 60k:
Williamston:
7.3% (117)
Michigan:
7.4% (233,723)
Number of households with income $60k - 75k:
Williamston:
8.6% (138)
Michigan:
10.4% (328,664)
Number of households with income $75k - 100k:
Williamston:
18.2% (292)
State:
13.6% (431,867)
Number of households with income $100k - 125k:
Williamston:
14.1% (226)
State:
10.3% (325,164)
Number of households with income $125k - 150k:
Williamston:
2.7% (43)
Michigan:
7.1% (226,232)
Number of households with income $150k - 200k:
Williamston:
5.3% (85)
Michigan:
8.1% (255,445)
Number of households with income > $200k:
Williamston:
12.8% (206)
Michigan:
8.7% (276,727)
Aggregate household income in Williamston in 2022: $177,627,039
Median family income in Williamston in 2022:
Williamston:
$113,852
State:
$90,317
Number of families with income $10k - 20k:
Williamston:
1.4% (13)
State:
3.2% (64,106)
Number of families with income $20k - 30k:
Williamston:
7.9% (74)
State:
4.6% (91,551)
Number of families with income $30k - 40k:
Williamston:
4.3% (40)
State:
5.9% (117,356)
Number of families with income $40k - 50k:
Williamston:
0.4% (4)
Michigan:
6.4% (127,491)
Number of families with income $50k - 60k:
Williamston:
10.2% (96)
Michigan:
6.8% (135,883)
Number of families with income $60k - 75k:
Williamston:
7.6% (72)
State:
10.5% (209,130)
Number of families with income $75k - 100k:
Williamston:
18.5% (175)
State:
15.5% (309,815)
Number of families with income $100k - 125k:
Williamston:
16.1% (152)
Michigan:
12.4% (248,235)
Number of families with income $125k - 150k:
Williamston:
4.0% (38)
State:
9.2% (182,895)
Number of families with income $150k - 200k:
Williamston:
8.6% (81)
State:
11.0% (218,573)
Number of families with income > $200k:
Williamston:
21.2% (200)
State:
12.0% (239,713)
Median per capita income in Williamston in 2022:
Williamston:
$49,513
Michigan:
$41,514
Change in median per capita income between 2000 and 2022:
Williamston, Michigan:
+113.9%
State:
+75.2%
Income statistics for Hispanic or Latino residents
Median per capita income in Williamston in 2022:
Williamston:
$32,020
State:
$25,462
Income statistics for Multirace residents
Number of households with income < $10k:
Williamston:
0.0% (0)
State:
6.1% (12,463)
Number of households with income $10k - 20k:
Williamston:
0.0% (0)
State:
8.7% (17,830)
Number of households with income $20k - 30k:
Williamston:
100.0% (39)
State:
7.6% (15,686)
Number of households with income $30k - 40k:
Williamston:
0.0% (0)
State:
9.5% (19,444)
Number of households with income $40k - 50k:
Williamston:
0.0% (0)
State:
7.5% (15,476)
Number of households with income $50k - 60k:
Williamston:
0.0% (0)
State:
8.1% (16,622)
Number of households with income $60k - 75k:
Williamston:
0.0% (0)
State:
10.6% (21,725)
Number of households with income $75k - 100k:
Williamston:
0.0% (0)
State:
14.4% (29,501)
Number of households with income $100k - 125k:
Williamston:
0.0% (0)
State:
8.9% (18,231)
Number of households with income $125k - 150k:
Williamston:
0.0% (0)
State:
5.8% (11,923)
Number of households with income $150k - 200k:
Williamston:
0.0% (0)
Michigan:
6.8% (13,956)
Number of households with income > $200k:
Williamston:
0.0% (0)
State:
6.2% (12,672)
Aggregate household income in Williamston in 2022: $6,958,450
Median per capita income in Williamston in 2022:
Williamston:
$19,500
State:
$26,098
Change in median per capita income between 2000 and 2022:
Williamston, Michigan:
+32.9%
Michigan:
+106.5%
Discuss Williamston, Michigan (MI) on our hugely popular Michigan forum.