Willapa Valley, Washington (WA) income map, earnings map, and wages data
The median household income in Willapa Valley, WA in 2022 was $81,223, which was 12.4% less than the median annual income of $91,306 across the entire state of Washington. Compared to the median income of $41,471 in 2000 this represents an increase of 48.9%. The per capita income in 2022 was $40,592, which means an increase of 53.6% compared to 2000 when it was $18,815.
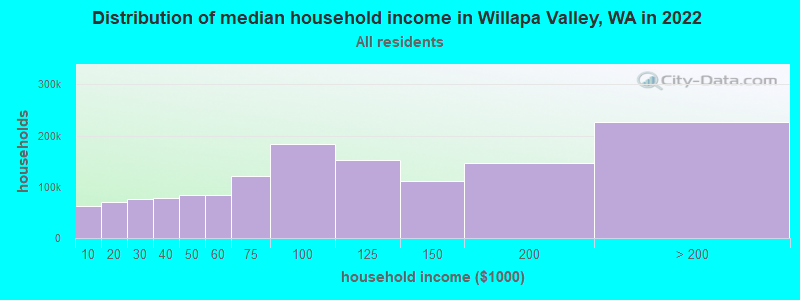
Income statistics for all residents
Median household income in Willapa Valley, WA in 2022:| Willapa Valley: | $81,223 |
| State: | $91,306 |
Change in median household income between 2000 and 2022:| Willapa Valley, Washington: | +95.9% |
| State: | +99.5% |
Number of households with income < $10k:| Willapa Valley: | 4.5% (63,105) |
| State: | 4.5% (139,331) |
Number of households with income $10k - 20k:| Willapa Valley: | 5.0% (69,989) |
| Washington: | 5.0% (154,508) |
Number of households with income $20k - 30k:| Willapa Valley: | 5.4% (75,447) |
| Washington: | 5.4% (166,555) |
Number of households with income $30k - 40k:| Willapa Valley: | 5.5% (77,151) |
| State: | 5.5% (170,324) |
Number of households with income $40k - 50k:| Willapa Valley: | 6.0% (83,324) |
| State: | 6.0% (183,941) |
Number of households with income $50k - 60k:| Willapa Valley: | 6.1% (84,879) |
| State: | 6.1% (187,395) |
Number of households with income $60k - 75k:| Willapa Valley: | 8.7% (120,833) |
| State: | 8.7% (266,771) |
Number of households with income $75k - 100k:| Willapa Valley: | 13.1% (183,297) |
| State: | 13.1% (404,672) |
Number of households with income $100k - 125k:| Willapa Valley: | 11.0% (153,059) |
| Washington: | 11.0% (337,911) |
Number of households with income $125k - 150k:| Willapa Valley: | 8.0% (110,945) |
| Washington: | 8.0% (244,934) |
Number of households with income $150k - 200k:| Willapa Valley: | 10.5% (146,672) |
| State: | 10.5% (323,812) |
Number of households with income > $200k:| Willapa Valley: | 16.2% (226,356) |
| Washington: | 16.2% (499,799) |
Aggregate household income in Willapa Valley in 2022: $2,722,308,324
Median family income in Willapa Valley in 2022:| Willapa Valley: | $92,260 |
| State: | $109,192 |
Median non-family income in Willapa Valley in 2022:| Willapa Valley: | $31,258 |
| Washington: | $57,299 |
Change in median non-family income between 2000 and 2022:| Willapa Valley, Washington: | +84.3% |
| State: | +94.9% |
Median per capita income in Willapa Valley in 2022:| Willapa Valley: | $40,592 |
| State: | $50,764 |
Change in median per capita income between 2000 and 2022:| Willapa Valley, Washington: | +115.7% |
| State: | +121.0% |
Income statistics for White residents
Median household income in Willapa Valley, WA in 2022:| Willapa Valley: | $79,239 |
| State: | $91,916 |
Change in median household income between 2000 and 2022:| Willapa Valley, Washington: | +94.3% |
| State: | +95.4% |
Number of households with income < $10k:| Willapa Valley: | 4.3% (41,526) |
| Washington: | 4.3% (95,850) |
Number of households with income $10k - 20k:| Willapa Valley: | 4.8% (46,121) |
| State: | 4.8% (106,421) |
Number of households with income $20k - 30k:| Willapa Valley: | 5.5% (53,246) |
| Washington: | 5.5% (122,860) |
Number of households with income $30k - 40k:| Willapa Valley: | 5.4% (51,839) |
| State: | 5.4% (119,627) |
Number of households with income $40k - 50k:| Willapa Valley: | 5.9% (57,330) |
| State: | 5.9% (132,276) |
Number of households with income $50k - 60k:| Willapa Valley: | 6.1% (59,018) |
| Washington: | 6.1% (136,212) |
Number of households with income $60k - 75k:| Willapa Valley: | 8.8% (84,964) |
| State: | 8.8% (196,086) |
Number of households with income $75k - 100k:| Willapa Valley: | 13.4% (129,652) |
| Washington: | 13.4% (299,192) |
Number of households with income $100k - 125k:| Willapa Valley: | 11.3% (109,291) |
| State: | 11.3% (252,209) |
Number of households with income $125k - 150k:| Willapa Valley: | 7.9% (76,257) |
| Washington: | 7.9% (175,962) |
Number of households with income $150k - 200k:| Willapa Valley: | 10.7% (103,641) |
| State: | 10.7% (239,156) |
Number of households with income > $200k:| Willapa Valley: | 16.1% (155,918) |
| State: | 16.1% (359,917) |
Aggregate household income in Willapa Valley in 2022: $1,858,319,050
Median family income in Willapa Valley in 2022:| Willapa Valley: | $89,135 |
| State: | $112,511 |
Number of families with income < $10k:| Willapa Valley: | 3.8% (12) |
| Washington: | 2.4% (33,676) |
Number of families with income $10k - 20k:| Willapa Valley: | 2.1% (7) |
| State: | 2.0% (28,228) |
Number of families with income $20k - 30k:| Willapa Valley: | 7.1% (22) |
| Washington: | 2.9% (39,288) |
Number of families with income $30k - 40k:| Willapa Valley: | 8.4% (26) |
| State: | 3.6% (50,190) |
Number of families with income $40k - 50k:| Willapa Valley: | 11.8% (37) |
| Washington: | 4.6% (63,009) |
Number of families with income $50k - 60k:| Willapa Valley: | 7.7% (24) |
| Washington: | 5.0% (69,270) |
Number of families with income $60k - 75k:| Willapa Valley: | 9.9% (31) |
| State: | 8.2% (112,369) |
Number of families with income $75k - 100k:| Willapa Valley: | 24.4% (77) |
| State: | 14.1% (194,214) |
Number of families with income $100k - 125k:| Willapa Valley: | 17.5% (55) |
| State: | 13.2% (182,184) |
Number of families with income $150k - 200k:| Willapa Valley: | 7.4% (23) |
| State: | 13.7% (188,621) |
Median non-family income in Willapa Valley in 2022:| Willapa Valley: | $30,869 |
| Washington: | $56,103 |
Change in median non-family income between 2000 and 2022:| Willapa Valley, Washington: | +82.0% |
| State: | +87.7% |
Median per capita income in Willapa Valley in 2022:| Willapa Valley: | $41,915 |
| Washington: | $55,212 |
Change in median per capita income between 2000 and 2022:| Willapa Valley, Washington: | +121.9% |
| State: | +123.8% |
Income statistics for Asian residents
Median household income in Willapa Valley, WA in 2022:| Willapa Valley: | $120,118 |
| State: | $125,692 |
Change in median household income between 2000 and 2022:| Willapa Valley, Washington: | +123.5% |
| State: | +164.5% |
Number of households with income < $10k:| Willapa Valley: | 4.9% (7,964) |
| State: | 4.9% (14,099) |
Number of households with income $10k - 20k:| Willapa Valley: | 3.5% (5,589) |
| Washington: | 3.5% (9,873) |
Number of households with income $20k - 30k:| Willapa Valley: | 2.9% (4,714) |
| State: | 2.9% (8,352) |
Number of households with income $30k - 40k:| Willapa Valley: | 4.0% (6,458) |
| Washington: | 4.0% (11,415) |
Number of households with income $40k - 50k:| Willapa Valley: | 4.0% (6,464) |
| State: | 4.0% (11,421) |
Number of households with income $50k - 60k:| Willapa Valley: | 4.2% (6,847) |
| Washington: | 4.2% (12,100) |
Number of households with income $60k - 75k:| Willapa Valley: | 6.3% (10,126) |
| State: | 6.3% (17,903) |
Number of households with income $75k - 100k:| Willapa Valley: | 10.4% (16,777) |
| State: | 10.4% (29,663) |
Number of households with income $100k - 125k:| Willapa Valley: | 9.4% (15,181) |
| State: | 9.4% (26,839) |
Number of households with income $125k - 150k:| Willapa Valley: | 8.5% (13,688) |
| State: | 8.5% (24,200) |
Number of households with income $150k - 200k:| Willapa Valley: | 12.6% (20,389) |
| State: | 12.6% (35,976) |
Number of households with income > $200k:| Willapa Valley: | 29.2% (47,048) |
| State: | 29.2% (83,109) |
Aggregate household income in Willapa Valley in 2022: $3,003,639
Median family income in Willapa Valley in 2022:| Willapa Valley: | $114,333 |
| State: | $143,595 |
Median per capita income in Willapa Valley in 2022:| Willapa Valley: | $108,520 |
| State: | $67,666 |
Income statistics for Hispanic or Latino residents
Median household income in Willapa Valley, WA in 2022:| Willapa Valley: | $126,934 |
| Washington: | $74,770 |
Change in median household income between 2000 and 2022:| Willapa Valley, Washington: | +124.9% |
| Washington: | +128.3% |
Number of households with income < $10k:| Willapa Valley: | 4.9% (12,365) |
| State: | 4.9% (14,456) |
Number of households with income $10k - 20k:| Willapa Valley: | 5.3% (13,312) |
| Washington: | 5.3% (15,449) |
Number of households with income $20k - 30k:| Willapa Valley: | 6.8% (17,223) |
| State: | 6.8% (20,016) |
Number of households with income $30k - 40k:| Willapa Valley: | 7.7% (19,416) |
| State: | 7.7% (22,548) |
Number of households with income $40k - 50k:| Willapa Valley: | 7.3% (18,514) |
| State: | 7.3% (21,450) |
Number of households with income $50k - 60k:| Willapa Valley: | 7.7% (19,553) |
| State: | 7.7% (22,744) |
Number of households with income $60k - 75k:| Willapa Valley: | 10.4% (26,363) |
| Washington: | 10.5% (30,737) |
Number of households with income $75k - 100k:| Willapa Valley: | 14.9% (37,581) |
| State: | 14.9% (43,843) |
Number of households with income $100k - 125k:| Willapa Valley: | 11.1% (28,032) |
| State: | 11.1% (32,554) |
Number of households with income $125k - 150k:| Willapa Valley: | 7.4% (18,568) |
| State: | 7.4% (21,624) |
Number of households with income $150k - 200k:| Willapa Valley: | 7.3% (18,364) |
| State: | 7.3% (21,360) |
Number of households with income > $200k:| Willapa Valley: | 9.2% (23,249) |
| Washington: | 9.2% (27,055) |
Aggregate household income in Willapa Valley in 2022: $13,314,198
Median family income in Willapa Valley in 2022:| Willapa Valley: | $133,504 |
| Washington: | $76,866 |
Number of families with income < $10k:| Willapa Valley: | 5.5% (3) |
| Washington: | 4.4% (9,443) |
Number of families with income $10k - 20k:| Willapa Valley: | 3.7% (2) |
| State: | 3.5% (7,524) |
Number of families with income $20k - 30k:| Willapa Valley: | 9.6% (6) |
| State: | 5.6% (12,052) |
Number of families with income $30k - 40k:| Willapa Valley: | 14.6% (9) |
| Washington: | 8.3% (17,803) |
Number of families with income $40k - 50k:| Willapa Valley: | 15.6% (9) |
| State: | 7.7% (16,361) |
Number of families with income $50k - 60k:| Willapa Valley: | 9.3% (5) |
| Washington: | 7.9% (16,852) |
Number of families with income $60k - 75k:| Willapa Valley: | 9.8% (6) |
| Washington: | 11.4% (24,342) |
Number of families with income $75k - 100k:| Willapa Valley: | 16.3% (10) |
| Washington: | 14.4% (30,698) |
Number of families with income $100k - 125k:| Willapa Valley: | 12.5% (7) |
| State: | 11.4% (24,331) |
Number of families with income $150k - 200k:| Willapa Valley: | 3.2% (2) |
| State: | 8.2% (17,551) |
Median per capita income in Willapa Valley in 2022:| Willapa Valley: | $37,879 |
| State: | $28,252 |
Income statistics for American Indian and Alaska Native residents
Median household income in Willapa Valley, WA in 2022:| Willapa Valley: | $262,433 |
| Washington: | $71,255 |
Change in median household income between 2000 and 2022:| Willapa Valley, Washington: | +108.5% |
| State: | +118.1% |
Number of households with income < $10k:| Willapa Valley: | 5.9% (3,420) |
| State: | 5.9% (1,768) |
Number of households with income $10k - 20k:| Willapa Valley: | 9.0% (5,220) |
| State: | 8.9% (2,694) |
Number of households with income $20k - 30k:| Willapa Valley: | 8.0% (4,618) |
| State: | 8.0% (2,412) |
Number of households with income $30k - 40k:| Willapa Valley: | 7.7% (4,475) |
| Washington: | 7.7% (2,327) |
Number of households with income $40k - 50k:| Willapa Valley: | 5.9% (3,420) |
| State: | 5.8% (1,755) |
Number of households with income $50k - 60k:| Willapa Valley: | 7.5% (4,350) |
| Washington: | 7.5% (2,259) |
Number of households with income $60k - 75k:| Willapa Valley: | 8.8% (5,130) |
| Washington: | 8.8% (2,669) |
Number of households with income $75k - 100k:| Willapa Valley: | 12.7% (7,395) |
| Washington: | 12.8% (3,861) |
Number of households with income $100k - 125k:| Willapa Valley: | 12.0% (6,979) |
| State: | 12.0% (3,618) |
Number of households with income $125k - 150k:| Willapa Valley: | 8.6% (4,985) |
| State: | 8.6% (2,580) |
Number of households with income $150k - 200k:| Willapa Valley: | 5.9% (3,408) |
| Washington: | 5.9% (1,774) |
Number of households with income > $200k:| Willapa Valley: | 8.0% (4,667) |
| Washington: | 8.1% (2,447) |
Aggregate household income in Willapa Valley in 2022: $2,731,988
Median family income in Willapa Valley in 2022:| Willapa Valley: | $286,977 |
| State: | $79,010 |
Number of families with income $50k - 60k:| Willapa Valley: | 4.8% (5) |
| State: | 9.7% (1,973) |
Number of families with income $125k - 150k:| Willapa Valley: | 95.2% (92) |
| Washington: | 9.8% (2,000) |
Median per capita income in Willapa Valley in 2022:| Willapa Valley: | $42,036 |
| State: | $27,053 |
Change in median per capita income between 2000 and 2022:| Willapa Valley, Washington: | +97.1% |
| Washington: | +98.6% |
Income statistics for Multirace residents
Number of households with income < $10k:| Willapa Valley: | 4.3% (5,415) |
| Washington: | 4.3% (12,040) |
Number of households with income $10k - 20k:| Willapa Valley: | 6.6% (8,293) |
| State: | 6.6% (18,437) |
Number of households with income $20k - 30k:| Willapa Valley: | 5.2% (6,548) |
| State: | 5.2% (14,559) |
Number of households with income $30k - 40k:| Willapa Valley: | 6.7% (8,316) |
| State: | 6.7% (18,491) |
Number of households with income $40k - 50k:| Willapa Valley: | 6.3% (7,852) |
| State: | 6.3% (17,459) |
Number of households with income $50k - 60k:| Willapa Valley: | 6.9% (8,584) |
| State: | 6.9% (19,086) |
Number of households with income $60k - 75k:| Willapa Valley: | 9.1% (11,383) |
| Washington: | 9.1% (25,310) |
Number of households with income $75k - 100k:| Willapa Valley: | 13.5% (16,863) |
| Washington: | 13.5% (37,493) |
Number of households with income $100k - 125k:| Willapa Valley: | 10.7% (13,325) |
| State: | 10.7% (29,626) |
Number of households with income $125k - 150k:| Willapa Valley: | 8.6% (10,749) |
| Washington: | 8.6% (23,899) |
Number of households with income $150k - 200k:| Willapa Valley: | 10.2% (12,690) |
| Washington: | 10.2% (28,214) |
Number of households with income > $200k:| Willapa Valley: | 11.9% (14,818) |
| State: | 11.9% (32,947) |
Median per capita income in Willapa Valley in 2022:| Willapa Valley: | $27,792 |
| State: | $32,496 |
Change in median per capita income between 2000 and 2022:| Willapa Valley, Washington: | +144.1% |
| State: | +156.8% |
Income statistics for other residents
Number of households with income < $10k:| Willapa Valley: | 4.3% (1) |
| State: | 5.3% (6,540) |
Number of households with income $10k - 20k:| Willapa Valley: | 8.7% (2) |
| State: | 6.0% (7,385) |
Number of households with income $20k - 30k:| Willapa Valley: | 8.7% (2) |
| Washington: | 7.5% (9,289) |
Number of households with income $30k - 40k:| Willapa Valley: | 8.7% (2) |
| State: | 8.9% (11,015) |
Number of households with income $40k - 50k:| Willapa Valley: | 8.7% (2) |
| State: | 7.6% (9,399) |
Number of households with income $50k - 60k:| Willapa Valley: | 8.7% (2) |
| State: | 7.2% (8,867) |
Number of households with income $60k - 75k:| Willapa Valley: | 8.7% (2) |
| State: | 10.5% (13,032) |
Number of households with income $75k - 100k:| Willapa Valley: | 13.0% (3) |
| Washington: | 14.6% (18,007) |
Number of households with income $100k - 125k:| Willapa Valley: | 13.0% (3) |
| State: | 12.2% (15,128) |
Number of households with income $125k - 150k:| Willapa Valley: | 4.3% (1) |
| State: | 5.6% (6,950) |
Number of households with income $150k - 200k:| Willapa Valley: | 4.3% (1) |
| State: | 7.1% (8,749) |
Number of households with income > $200k:| Willapa Valley: | 8.7% (2) |
| Washington: | 7.5% (9,208) |
Aggregate household income in Willapa Valley in 2022: $2,017,666
Median family income in Willapa Valley in 2022:| Willapa Valley: | $124,140 |
| Washington: | $72,588 |
Number of families with income $10k - 20k:| Willapa Valley: | 11.1% (2) |
| State: | 4.0% (3,814) |
Number of families with income $50k - 60k:| Willapa Valley: | 88.9% (15) |
| State: | 7.7% (7,357) |
Median per capita income in Willapa Valley in 2022:| Willapa Valley: | $33,977 |
| Washington: | $27,542 |