Whiting, Vermont (VT) income map, earnings map, and wages data
The median household income in Whiting, VT in 2022 was $58,319, which was 26.9% less than the median annual income of $73,991 across the entire state of Vermont. Compared to the median income of $31,985 in 2000 this represents an increase of 45.2%. The per capita income in 2022 was $41,168, which means an increase of 51.2% compared to 2000 when it was $20,101.
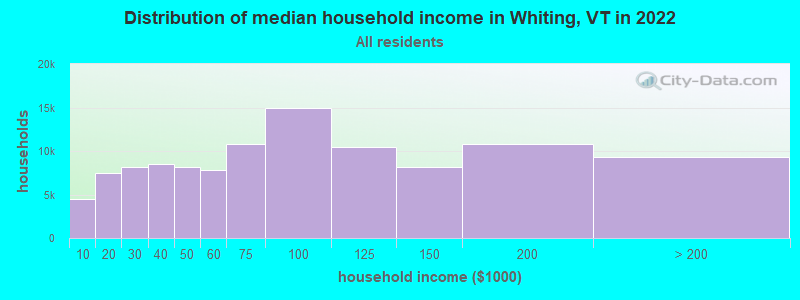
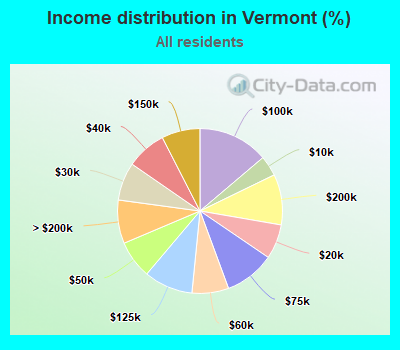
Income statistics for all residents
Median household income in Whiting, VT in 2022:| Whiting: | $58,320 |
| Vermont: | $73,991 |
Change in median household income between 2000 and 2022:| Whiting, Vermont: | +82.3% |
| State: | +81.1% |
Number of households with income < $10k:| Whiting: | 4.1% (4,454) |
| State: | 4.0% (11,050) |
Number of households with income $10k - 20k:| Whiting: | 6.9% (7,501) |
| State: | 6.8% (18,853) |
Number of households with income $20k - 30k:| Whiting: | 7.5% (8,194) |
| State: | 7.5% (20,673) |
Number of households with income $30k - 40k:| Whiting: | 7.8% (8,543) |
| State: | 7.8% (21,750) |
Number of households with income $40k - 50k:| Whiting: | 7.4% (8,125) |
| State: | 7.4% (20,642) |
Number of households with income $50k - 60k:| Whiting: | 7.2% (7,826) |
| State: | 7.2% (19,901) |
Number of households with income $60k - 75k:| Whiting: | 9.9% (10,787) |
| State: | 9.9% (27,351) |
Number of households with income $75k - 100k:| Whiting: | 13.7% (14,985) |
| Vermont: | 13.8% (38,275) |
Number of households with income $100k - 125k:| Whiting: | 9.6% (10,476) |
| State: | 9.6% (26,632) |
Number of households with income $125k - 150k:| Whiting: | 7.5% (8,189) |
| State: | 7.5% (20,857) |
Number of households with income $150k - 200k:| Whiting: | 9.9% (10,822) |
| State: | 9.9% (27,469) |
Number of households with income > $200k:| Whiting: | 8.5% (9,270) |
| State: | 8.5% (23,637) |
Aggregate household income in Whiting in 2022: $46,149,350
Median family income in Whiting in 2022:| Whiting: | $83,610 |
| State: | $96,345 |
Median non-family income in Whiting in 2022:| Whiting: | $41,111 |
| State: | $46,022 |
Change in median non-family income between 2000 and 2022:| Whiting, Vermont: | +87.9% |
| Vermont: | +87.4% |
Median per capita income in Whiting in 2022:| Whiting: | $41,168 |
| Vermont: | $42,251 |
Change in median per capita income between 2000 and 2022:| Whiting, Vermont: | +104.8% |
| State: | +104.9% |
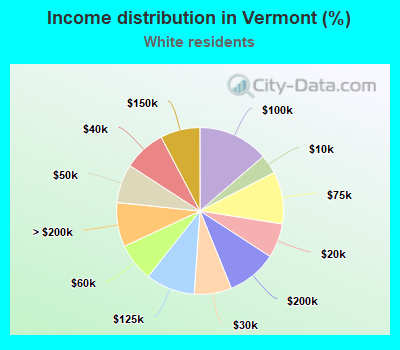
Income statistics for White residents
Median household income in Whiting, VT in 2022:| Whiting: | $58,102 |
| State: | $73,591 |
Change in median household income between 2000 and 2022:| Whiting, Vermont: | +80.8% |
| State: | +79.2% |
Number of households with income < $10k:| Whiting: | 3.8% (3,809) |
| Vermont: | 3.7% (9,508) |
Number of households with income $10k - 20k:| Whiting: | 6.7% (6,774) |
| State: | 6.7% (17,064) |
Number of households with income $20k - 30k:| Whiting: | 7.3% (7,336) |
| Vermont: | 7.2% (18,552) |
Number of households with income $30k - 40k:| Whiting: | 8.1% (8,196) |
| Vermont: | 8.2% (20,886) |
Number of households with income $40k - 50k:| Whiting: | 7.5% (7,542) |
| State: | 7.5% (19,216) |
Number of households with income $50k - 60k:| Whiting: | 7.4% (7,419) |
| State: | 7.4% (18,898) |
Number of households with income $60k - 75k:| Whiting: | 10.2% (10,227) |
| State: | 10.1% (25,944) |
Number of households with income $75k - 100k:| Whiting: | 13.6% (13,668) |
| State: | 13.7% (34,991) |
Number of households with income $100k - 125k:| Whiting: | 9.5% (9,571) |
| Vermont: | 9.5% (24,409) |
Number of households with income $125k - 150k:| Whiting: | 7.7% (7,734) |
| Vermont: | 7.7% (19,710) |
Number of households with income $150k - 200k:| Whiting: | 9.7% (9,728) |
| Vermont: | 9.7% (24,802) |
Number of households with income > $200k:| Whiting: | 8.5% (8,596) |
| State: | 8.6% (21,983) |
Aggregate household income in Whiting in 2022: $42,501,303
Median family income in Whiting in 2022:| Whiting: | $84,164 |
| State: | $96,147 |
Number of families with income < $10k:| Whiting: | 0.9% (1) |
| State: | 1.8% (2,669) |
Number of families with income $10k - 20k:| Whiting: | 3.1% (3) |
| State: | 3.1% (4,686) |
Number of families with income $20k - 30k:| Whiting: | 5.9% (6) |
| State: | 4.1% (6,266) |
Number of families with income $30k - 40k:| Whiting: | 7.7% (8) |
| Vermont: | 6.1% (9,273) |
Number of families with income $40k - 50k:| Whiting: | 6.4% (6) |
| State: | 6.4% (9,714) |
Number of families with income $50k - 60k:| Whiting: | 6.5% (6) |
| Vermont: | 6.1% (9,310) |
Number of families with income $60k - 75k:| Whiting: | 6.0% (6) |
| Vermont: | 9.3% (14,175) |
Number of families with income $100k - 125k:| Whiting: | 21.1% (21) |
| Vermont: | 12.7% (19,323) |
Number of families with income $125k - 150k:| Whiting: | 16.9% (17) |
| Vermont: | 9.7% (14,805) |
Number of families with income $150k - 200k:| Whiting: | 13.4% (13) |
| State: | 13.1% (20,018) |
Number of families with income > $200k:| Whiting: | 12.3% (12) |
| State: | 12.1% (18,463) |
Median non-family income in Whiting in 2022:| Whiting: | $40,852 |
| Vermont: | $45,952 |
Change in median non-family income between 2000 and 2022:| Whiting, Vermont: | +86.8% |
| Vermont: | +86.1% |
Median per capita income in Whiting in 2022:| Whiting: | $42,412 |
| State: | $43,031 |
Change in median per capita income between 2000 and 2022:| Whiting, Vermont: | +106.2% |
| State: | +106.0% |
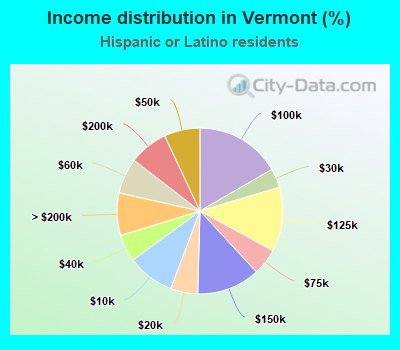
Income statistics for Hispanic or Latino residents
Median household income in Whiting, VT in 2022:| Whiting: | $43,974 |
| State: | $90,490 |
Change in median household income between 2000 and 2022:| Whiting, Vermont: | +134.5% |
| State: | +133.7% |
Number of households with income < $10k:| Whiting: | 9.2% (242) |
| State: | 9.2% (500) |
Number of households with income $10k - 20k:| Whiting: | 5.3% (139) |
| State: | 5.3% (288) |
Number of households with income $20k - 30k:| Whiting: | 3.7% (98) |
| Vermont: | 3.7% (203) |
Number of households with income $30k - 40k:| Whiting: | 5.3% (139) |
| State: | 5.3% (288) |
Number of households with income $40k - 50k:| Whiting: | 7.0% (183) |
| State: | 7.0% (379) |
Number of households with income $50k - 60k:| Whiting: | 6.9% (182) |
| State: | 6.9% (376) |
Number of households with income $60k - 75k:| Whiting: | 5.2% (137) |
| Vermont: | 5.2% (282) |
Number of households with income $75k - 100k:| Whiting: | 16.7% (438) |
| State: | 16.7% (905) |
Number of households with income $100k - 125k:| Whiting: | 12.6% (330) |
| Vermont: | 12.6% (682) |
Number of households with income $125k - 150k:| Whiting: | 12.3% (324) |
| State: | 12.3% (669) |
Number of households with income $150k - 200k:| Whiting: | 7.6% (199) |
| Vermont: | 7.6% (412) |
Number of households with income > $200k:| Whiting: | 8.3% (218) |
| State: | 8.3% (450) |
Aggregate household income in Whiting in 2022: $256,279
Median family income in Whiting in 2022:| Whiting: | $21,726 |
| State: | $116,955 |
Median per capita income in Whiting in 2022:| Whiting: | $14,408 |
| Vermont: | $36,311 |
Change in median per capita income between 2000 and 2022:| Whiting, Vermont: | +132.4% |
| State: | +131.1% |
Income statistics for other residents
Number of households with income < $10k:| Whiting: | 6.5% (8) |
| State: | 4.4% (48) |
Number of households with income $10k - 20k:| Whiting: | 7.3% (9) |
| Vermont: | 6.4% (69) |
Number of households with income $20k - 30k:| Whiting: | 8.1% (10) |
| State: | 2.7% (29) |
Number of households with income $30k - 40k:| Whiting: | 9.7% (12) |
| Vermont: | 13.6% (147) |
Number of households with income $40k - 50k:| Whiting: | 8.9% (11) |
| State: | 13.4% (145) |
Number of households with income $50k - 60k:| Whiting: | 8.1% (10) |
| Vermont: | 7.8% (84) |
Number of households with income $60k - 75k:| Whiting: | 10.5% (13) |
| State: | 13.7% (148) |
Number of households with income $75k - 100k:| Whiting: | 13.7% (17) |
| State: | 8.1% (87) |
Number of households with income $100k - 125k:| Whiting: | 9.7% (12) |
| Vermont: | 8.4% (91) |
Number of households with income $125k - 150k:| Whiting: | 5.6% (7) |
| State: | 6.1% (66) |
Number of households with income $150k - 200k:| Whiting: | 6.5% (8) |
| State: | 10.7% (116) |
Number of households with income > $200k:| Whiting: | 5.6% (7) |
| State: | 4.6% (50) |
Aggregate household income in Whiting in 2022: $508,432
Median family income in Whiting in 2022:| Whiting: | $19,192 |
| Vermont: | $105,231 |
Median per capita income in Whiting in 2022:| Whiting: | $19,290 |
| Vermont: | $36,770 |