Westwood, Massachusetts (MA) income map, earnings map, and wages data
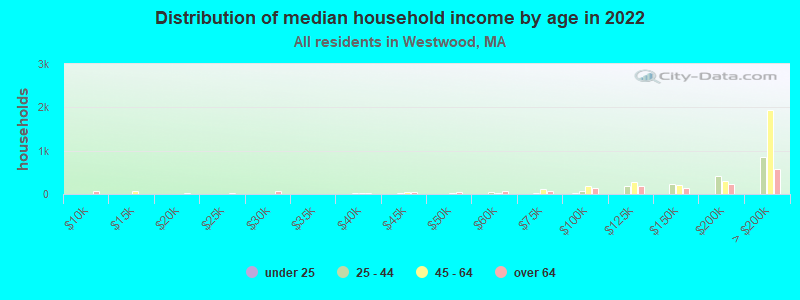
The median household income in Westwood, MA in 2022 was $159,777, which was 40.9% greater than the median annual income of $94,488 across the entire state of Massachusetts. Compared to the median income of $87,394 in 2000 this represents an increase of 45.3%. The per capita income in 2022 was $84,638, which means an increase of 50.9% compared to 2000 when it was $41,553.
Income statistics for all residents
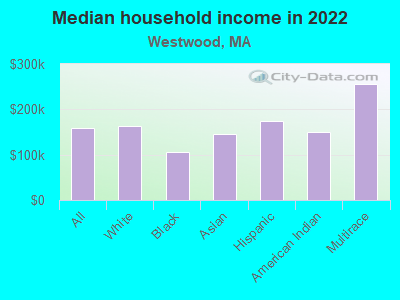
Median household income in Westwood, MA in 2022:| Westwood: | $159,777 |
| State: | $94,488 |
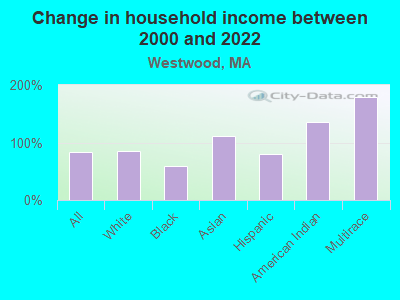
Change in median household income between 2000 and 2022:| Westwood, Massachusetts: | +82.8% |
| State: | +87.1% |
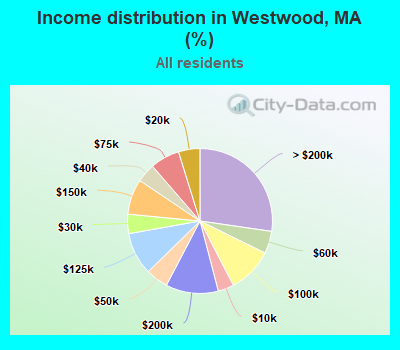
Number of households with income < $10k:| Westwood: | 3.6% (13,809) |
| Massachusetts: | 5.2% (146,170) |
Number of households with income $10k - 20k:| Westwood: | 4.8% (18,552) |
| State: | 6.4% (180,001) |
Number of households with income $20k - 30k:| Westwood: | 4.3% (16,734) |
| State: | 5.6% (156,667) |
Number of households with income $30k - 40k:| Westwood: | 4.2% (16,382) |
| State: | 5.6% (157,168) |
Number of households with income $40k - 50k:| Westwood: | 5.0% (19,473) |
| Massachusetts: | 5.4% (151,455) |
Number of households with income $50k - 60k:| Westwood: | 5.0% (19,334) |
| Massachusetts: | 5.1% (142,726) |
Number of households with income $60k - 75k:| Westwood: | 6.6% (25,524) |
| State: | 7.6% (212,203) |
Number of households with income $75k - 100k:| Westwood: | 10.1% (39,211) |
| Massachusetts: | 11.3% (317,064) |
Number of households with income $100k - 125k:| Westwood: | 9.5% (36,953) |
| State: | 9.7% (270,603) |
Number of households with income $125k - 150k:| Westwood: | 7.9% (30,734) |
| State: | 8.0% (223,140) |
Number of households with income $150k - 200k:| Westwood: | 11.7% (45,547) |
| Massachusetts: | 11.0% (308,695) |
Number of households with income > $200k:| Westwood: | 27.3% (106,053) |
| Massachusetts: | 19.0% (531,884) |
Aggregate household income in Westwood in 2022: $12,929,613,324
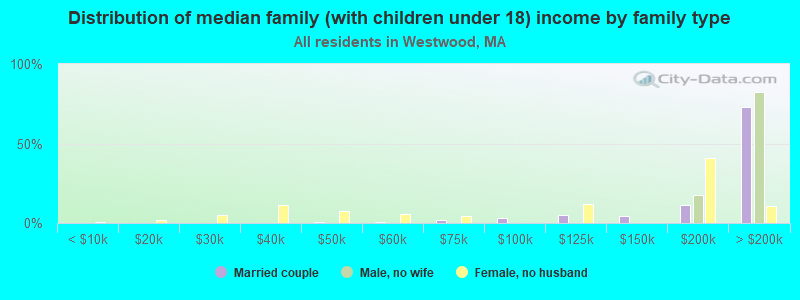
Median family income in Westwood in 2022:| Westwood: | $204,115 |
| Massachusetts: | $120,263 |
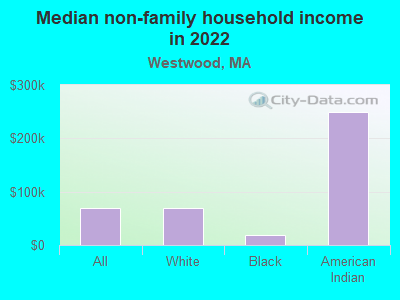
Median non-family income in Westwood in 2022:| Westwood: | $70,164 |
| State: | $55,979 |
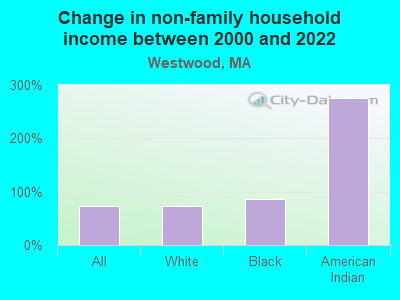
Change in median non-family income between 2000 and 2022:| Westwood, Massachusetts: | +73.0% |
| State: | +88.0% |
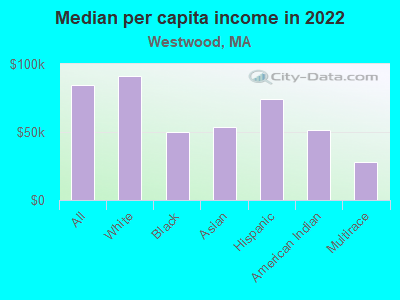
Median per capita income in Westwood in 2022:| Westwood: | $84,638 |
| State: | $54,025 |
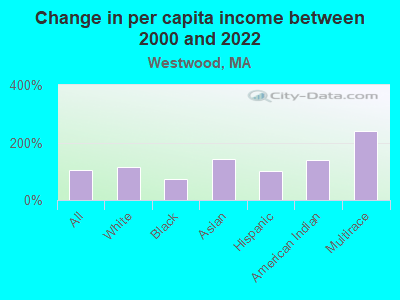
Change in median per capita income between 2000 and 2022:| Westwood, Massachusetts: | +103.7% |
| State: | +108.2% |
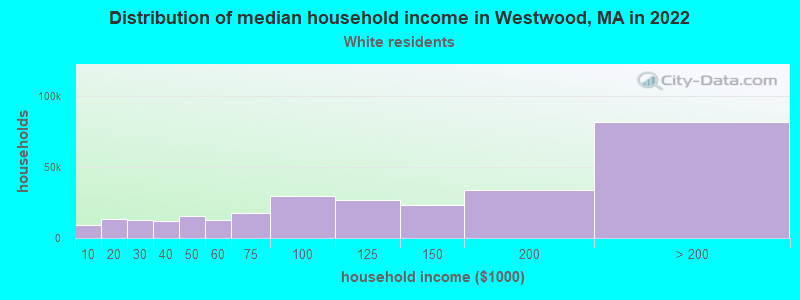
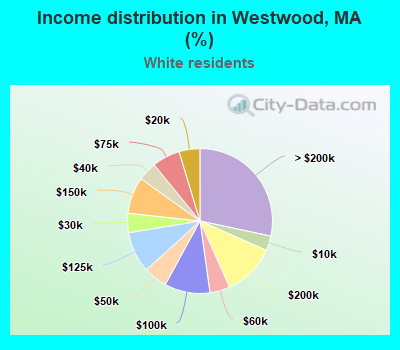
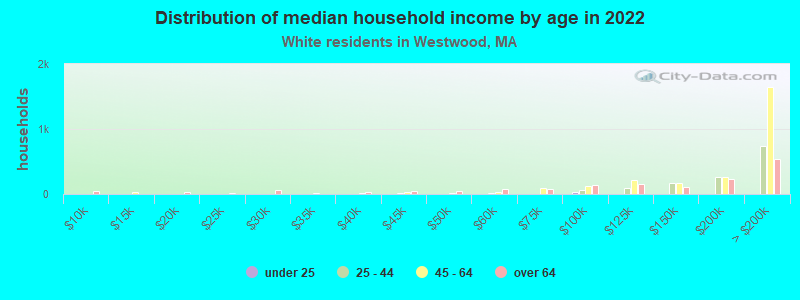
Income statistics for White residents
Median household income in Westwood, MA in 2022:| Westwood: | $162,834 |
| Massachusetts: | $101,391 |
Change in median household income between 2000 and 2022:| Westwood, Massachusetts: | +85.3% |
| State: | +93.3% |
Number of households with income < $10k:| Westwood: | 3.3% (9,418) |
| State: | 4.4% (91,120) |
Number of households with income $10k - 20k:| Westwood: | 4.7% (13,428) |
| Massachusetts: | 5.9% (122,055) |
Number of households with income $20k - 30k:| Westwood: | 4.3% (12,414) |
| Massachusetts: | 5.1% (105,311) |
Number of households with income $30k - 40k:| Westwood: | 4.2% (12,155) |
| State: | 5.3% (110,239) |
Number of households with income $40k - 50k:| Westwood: | 5.3% (15,203) |
| State: | 5.0% (104,636) |
Number of households with income $50k - 60k:| Westwood: | 4.5% (12,920) |
| Massachusetts: | 4.8% (99,486) |
Number of households with income $60k - 75k:| Westwood: | 6.2% (17,888) |
| State: | 7.5% (155,124) |
Number of households with income $75k - 100k:| Westwood: | 10.2% (29,264) |
| State: | 11.4% (236,252) |
Number of households with income $100k - 125k:| Westwood: | 9.2% (26,427) |
| State: | 9.9% (204,731) |
Number of households with income $125k - 150k:| Westwood: | 8.2% (23,592) |
| State: | 8.5% (175,324) |
Number of households with income $150k - 200k:| Westwood: | 11.7% (33,703) |
| State: | 11.7% (242,980) |
Number of households with income > $200k:| Westwood: | 28.4% (81,708) |
| Massachusetts: | 20.5% (425,966) |
Aggregate household income in Westwood in 2022: $9,715,158,400
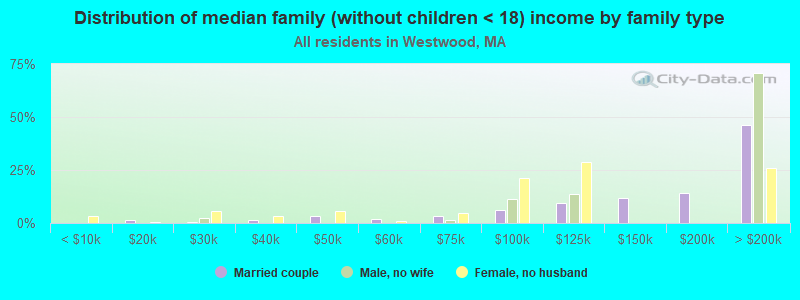
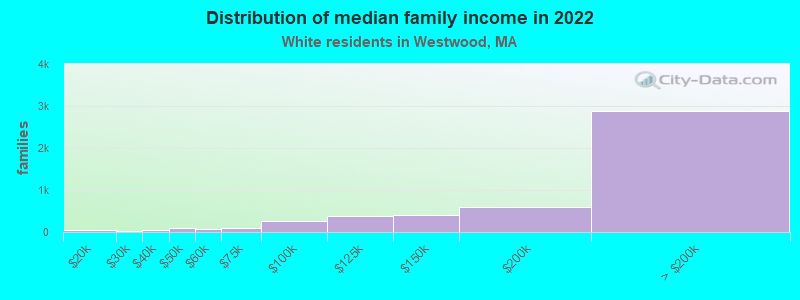
Median family income in Westwood in 2022:| Westwood: | $213,813 |
| State: | $133,153 |
Number of families with income < $10k:| Westwood: | 0.1% (7) |
| Massachusetts: | 2.0% (25,038) |
Number of families with income $10k - 20k:| Westwood: | 0.7% (36) |
| State: | 2.1% (26,403) |
Number of families with income $20k - 30k:| Westwood: | 0.5% (25) |
| Massachusetts: | 2.6% (32,525) |
Number of families with income $30k - 40k:| Westwood: | 1.1% (55) |
| State: | 3.9% (48,079) |
Number of families with income $40k - 50k:| Westwood: | 1.7% (84) |
| State: | 3.8% (46,908) |
Number of families with income $50k - 60k:| Westwood: | 1.3% (65) |
| State: | 3.8% (46,476) |
Number of families with income $60k - 75k:| Westwood: | 2.1% (102) |
| State: | 6.4% (79,040) |
Number of families with income $75k - 100k:| Westwood: | 5.1% (251) |
| State: | 11.1% (137,395) |
Number of families with income $100k - 125k:| Westwood: | 8.0% (392) |
| Massachusetts: | 11.1% (136,771) |
Number of families with income $125k - 150k:| Westwood: | 8.2% (404) |
| State: | 10.0% (123,709) |
Number of families with income $150k - 200k:| Westwood: | 12.2% (599) |
| State: | 14.7% (181,602) |
Number of families with income > $200k:| Westwood: | 58.8% (2,883) |
| Massachusetts: | 28.5% (351,887) |
Median non-family income in Westwood in 2022:| Westwood: | $69,988 |
| State: | $59,323 |
Change in median non-family income between 2000 and 2022:| Westwood, Massachusetts: | +73.0% |
| Massachusetts: | +94.3% |
Median per capita income in Westwood in 2022:| Westwood: | $90,982 |
| State: | $60,804 |
Change in median per capita income between 2000 and 2022:| Westwood, Massachusetts: | +114.1% |
| State: | +118.7% |
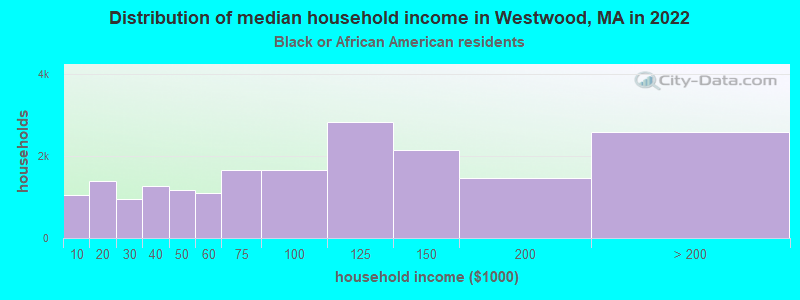
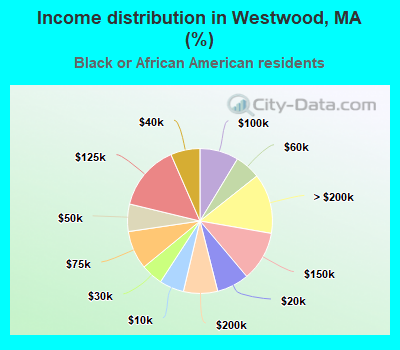
Income statistics for Black or African American residents
Median household income in Westwood, MA in 2022:| Westwood: | $105,696 |
| State: | $63,189 |
Change in median household income between 2000 and 2022:| Westwood, Massachusetts: | +58.5% |
| State: | +87.4% |
Number of households with income < $10k:| Westwood: | 5.5% (1,056) |
| Massachusetts: | 9.1% (15,797) |
Number of households with income $10k - 20k:| Westwood: | 7.2% (1,392) |
| State: | 9.4% (16,267) |
Number of households with income $20k - 30k:| Westwood: | 4.9% (947) |
| State: | 7.8% (13,520) |
Number of households with income $30k - 40k:| Westwood: | 6.6% (1,265) |
| State: | 8.3% (14,412) |
Number of households with income $40k - 50k:| Westwood: | 6.1% (1,181) |
| State: | 7.9% (13,790) |
Number of households with income $50k - 60k:| Westwood: | 5.7% (1,100) |
| Massachusetts: | 5.8% (10,041) |
Number of households with income $60k - 75k:| Westwood: | 8.6% (1,659) |
| Massachusetts: | 8.5% (14,822) |
Number of households with income $75k - 100k:| Westwood: | 8.7% (1,671) |
| Massachusetts: | 11.0% (19,122) |
Number of households with income $100k - 125k:| Westwood: | 14.7% (2,830) |
| Massachusetts: | 8.4% (14,575) |
Number of households with income $125k - 150k:| Westwood: | 11.1% (2,143) |
| Massachusetts: | 6.0% (10,429) |
Number of households with income $150k - 200k:| Westwood: | 7.6% (1,471) |
| Massachusetts: | 7.2% (12,539) |
Number of households with income > $200k:| Westwood: | 13.4% (2,586) |
| State: | 10.5% (18,185) |
Aggregate household income in Westwood in 2022: $3,144,660
Median family income in Westwood in 2022:| Westwood: | $139,168 |
| State: | $79,815 |
Median non-family income in Westwood in 2022:| Westwood: | $18,068 |
| State: | $38,934 |
Change in median non-family income between 2000 and 2022:| Westwood, Massachusetts: | +86.5% |
| State: | +69.2% |
Median per capita income in Westwood in 2022:| Westwood: | $50,170 |
| State: | $33,524 |
Change in median per capita income between 2000 and 2022:| Westwood, Massachusetts: | +73.4% |
| Massachusetts: | +109.4% |
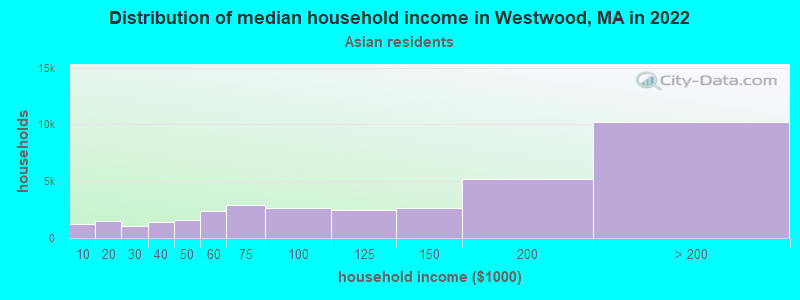
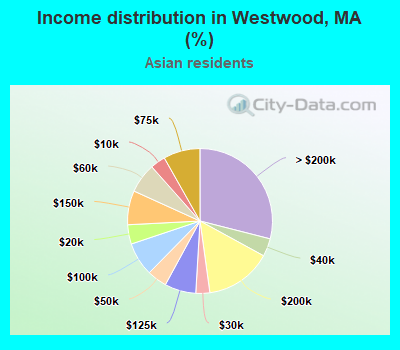
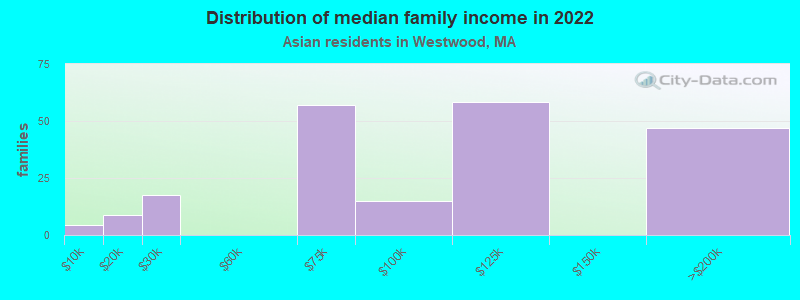
Income statistics for Asian residents
Median household income in Westwood, MA in 2022:| Westwood: | $146,679 |
| State: | $117,855 |
Change in median household income between 2000 and 2022:| Westwood, Massachusetts: | +110.7% |
| State: | +129.9% |
Number of households with income < $10k:| Westwood: | 3.4% (1,194) |
| State: | 6.8% (11,982) |
Number of households with income $10k - 20k:| Westwood: | 4.3% (1,525) |
| State: | 4.8% (8,376) |
Number of households with income $20k - 30k:| Westwood: | 3.1% (1,099) |
| State: | 3.7% (6,558) |
Number of households with income $30k - 40k:| Westwood: | 4.0% (1,409) |
| State: | 3.3% (5,748) |
Number of households with income $40k - 50k:| Westwood: | 4.4% (1,557) |
| State: | 4.1% (7,192) |
Number of households with income $50k - 60k:| Westwood: | 6.7% (2,347) |
| State: | 5.0% (8,734) |
Number of households with income $60k - 75k:| Westwood: | 8.2% (2,884) |
| Massachusetts: | 5.8% (10,203) |
Number of households with income $75k - 100k:| Westwood: | 7.5% (2,649) |
| State: | 8.6% (15,154) |
Number of households with income $100k - 125k:| Westwood: | 7.0% (2,467) |
| State: | 10.8% (18,942) |
Number of households with income $125k - 150k:| Westwood: | 7.6% (2,678) |
| Massachusetts: | 8.0% (14,037) |
Number of households with income $150k - 200k:| Westwood: | 14.8% (5,232) |
| State: | 12.5% (21,856) |
Number of households with income > $200k:| Westwood: | 29.0% (10,220) |
| State: | 26.6% (46,694) |
Aggregate household income in Westwood in 2022: $49,257,377
Median family income in Westwood in 2022:| Westwood: | $156,001 |
| State: | $140,113 |
Number of families with income < $10k:| Westwood: | 2.1% (4) |
| Massachusetts: | 3.2% (3,752) |
Number of families with income $10k - 20k:| Westwood: | 4.2% (9) |
| State: | 3.5% (4,118) |
Number of families with income $20k - 30k:| Westwood: | 8.5% (18) |
| State: | 2.3% (2,708) |
Number of families with income $60k - 75k:| Westwood: | 27.4% (57) |
| State: | 6.1% (7,105) |
Number of families with income $75k - 100k:| Westwood: | 7.3% (15) |
| Massachusetts: | 8.5% (10,022) |
Number of families with income $100k - 125k:| Westwood: | 28.0% (58) |
| State: | 10.0% (11,697) |
Number of families with income $150k - 200k:| Westwood: | 22.5% (47) |
| Massachusetts: | 13.2% (15,478) |
Median per capita income in Westwood in 2022:| Westwood: | $53,895 |
| State: | $58,900 |
Change in median per capita income between 2000 and 2022:| Westwood, Massachusetts: | +141.2% |
| Massachusetts: | +174.6% |
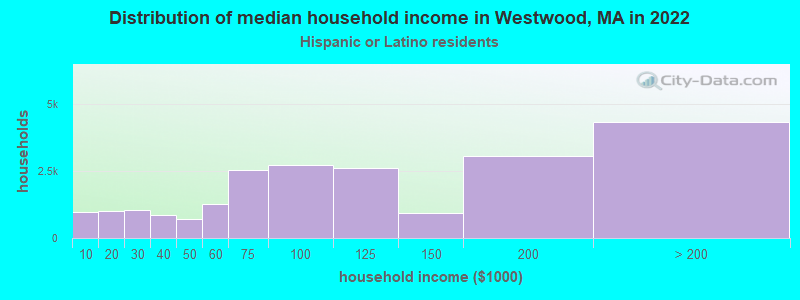
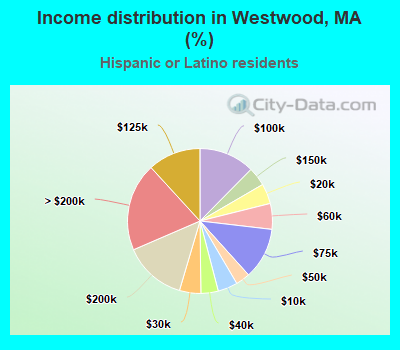
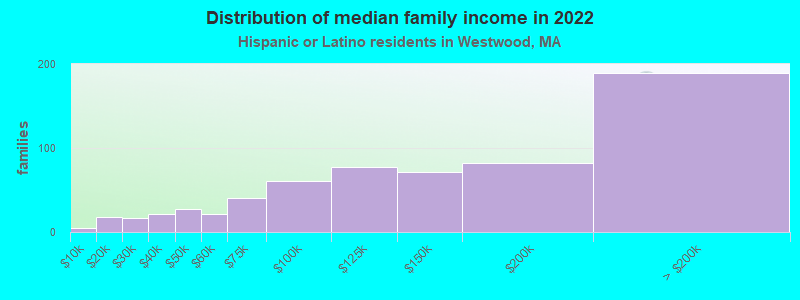
Income statistics for Hispanic or Latino residents
Median household income in Westwood, MA in 2022:| Westwood: | $174,690 |
| Massachusetts: | $61,523 |
Change in median household income between 2000 and 2022:| Westwood, Massachusetts: | +79.8% |
| State: | +125.4% |
Number of households with income < $10k:| Westwood: | 4.4% (968) |
| State: | 8.8% (25,307) |
Number of households with income $10k - 20k:| Westwood: | 4.5% (988) |
| State: | 10.0% (28,653) |
Number of households with income $20k - 30k:| Westwood: | 4.8% (1,049) |
| State: | 8.8% (25,189) |
Number of households with income $30k - 40k:| Westwood: | 3.9% (848) |
| State: | 7.2% (20,822) |
Number of households with income $40k - 50k:| Westwood: | 3.2% (705) |
| State: | 7.2% (20,817) |
Number of households with income $50k - 60k:| Westwood: | 5.7% (1,262) |
| State: | 6.5% (18,748) |
Number of households with income $60k - 75k:| Westwood: | 11.5% (2,520) |
| Massachusetts: | 8.8% (25,390) |
Number of households with income $75k - 100k:| Westwood: | 12.4% (2,729) |
| State: | 12.0% (34,488) |
Number of households with income $100k - 125k:| Westwood: | 11.8% (2,592) |
| Massachusetts: | 8.6% (24,599) |
Number of households with income $125k - 150k:| Westwood: | 4.2% (921) |
| Massachusetts: | 6.2% (17,743) |
Number of households with income $150k - 200k:| Westwood: | 13.9% (3,061) |
| State: | 7.3% (21,017) |
Number of households with income > $200k:| Westwood: | 19.7% (4,323) |
| State: | 8.6% (24,606) |
Aggregate household income in Westwood in 2022: $54,162,284
Median family income in Westwood in 2022:| Westwood: | $213,122 |
| State: | $66,072 |
Number of families with income < $10k:| Westwood: | 0.8% (5) |
| Massachusetts: | 6.2% (12,456) |
Number of families with income $10k - 20k:| Westwood: | 2.8% (18) |
| Massachusetts: | 6.0% (12,071) |
Number of families with income $20k - 30k:| Westwood: | 2.7% (17) |
| State: | 10.1% (20,376) |
Number of families with income $30k - 40k:| Westwood: | 3.5% (22) |
| State: | 8.2% (16,470) |
Number of families with income $40k - 50k:| Westwood: | 4.3% (27) |
| Massachusetts: | 7.4% (14,829) |
Number of families with income $50k - 60k:| Westwood: | 3.3% (21) |
| State: | 7.3% (14,643) |
Number of families with income $60k - 75k:| Westwood: | 6.4% (40) |
| Massachusetts: | 10.6% (21,252) |
Number of families with income $75k - 100k:| Westwood: | 9.7% (61) |
| Massachusetts: | 12.0% (24,088) |
Number of families with income $100k - 125k:| Westwood: | 12.2% (77) |
| State: | 8.9% (17,954) |
Number of families with income $125k - 150k:| Westwood: | 11.4% (72) |
| Massachusetts: | 6.9% (13,837) |
Number of families with income $150k - 200k:| Westwood: | 12.9% (82) |
| State: | 7.3% (14,683) |
Number of families with income > $200k:| Westwood: | 29.9% (189) |
| Massachusetts: | 9.3% (18,741) |
Median per capita income in Westwood in 2022:| Westwood: | $73,921 |
| State: | $28,993 |
Change in median per capita income between 2000 and 2022:| Westwood, Massachusetts: | +100.6% |
| State: | +142.4% |
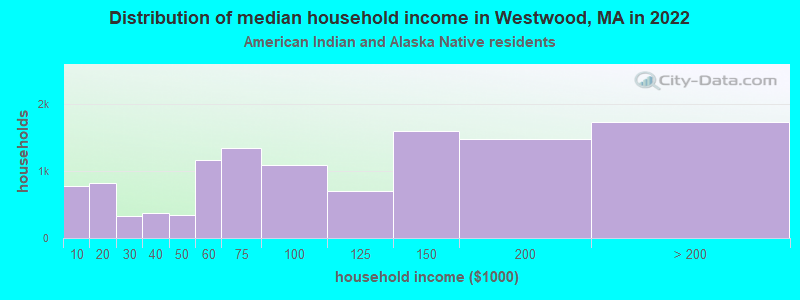
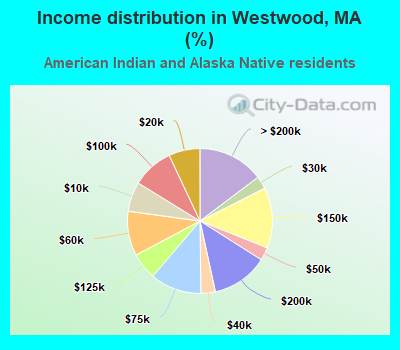
Income statistics for American Indian and Alaska Native residents
Median household income in Westwood, MA in 2022:| Westwood: | $149,580 |
| State: | $87,730 |
Change in median household income between 2000 and 2022:| Westwood, Massachusetts: | +134.6% |
| Massachusetts: | +138.3% |
Number of households with income < $10k:| Westwood: | 6.6% (781) |
| State: | 6.6% (451) |
Number of households with income $10k - 20k:| Westwood: | 7.0% (824) |
| State: | 7.0% (476) |
Number of households with income $20k - 30k:| Westwood: | 2.8% (333) |
| Massachusetts: | 2.8% (192) |
Number of households with income $30k - 40k:| Westwood: | 3.2% (378) |
| State: | 3.2% (218) |
Number of households with income $40k - 50k:| Westwood: | 2.9% (345) |
| State: | 2.9% (199) |
Number of households with income $50k - 60k:| Westwood: | 9.9% (1,172) |
| State: | 9.9% (677) |
Number of households with income $60k - 75k:| Westwood: | 11.5% (1,353) |
| State: | 11.5% (781) |
Number of households with income $75k - 100k:| Westwood: | 9.2% (1,089) |
| State: | 9.2% (629) |
Number of households with income $100k - 125k:| Westwood: | 6.0% (703) |
| State: | 6.0% (406) |
Number of households with income $125k - 150k:| Westwood: | 13.5% (1,595) |
| Massachusetts: | 13.5% (921) |
Number of households with income $150k - 200k:| Westwood: | 12.6% (1,488) |
| State: | 12.6% (859) |
Number of households with income > $200k:| Westwood: | 14.7% (1,737) |
| Massachusetts: | 14.7% (1,003) |
Aggregate household income in Westwood in 2022: $1,605,288
Median non-family income in Westwood in 2022:| Westwood: | $248,463 |
| Massachusetts: | $75,379 |
Median per capita income in Westwood in 2022:| Westwood: | $51,740 |
| Massachusetts: | $39,434 |
Change in median per capita income between 2000 and 2022:| Westwood, Massachusetts: | +140.2% |
| State: | +148.2% |
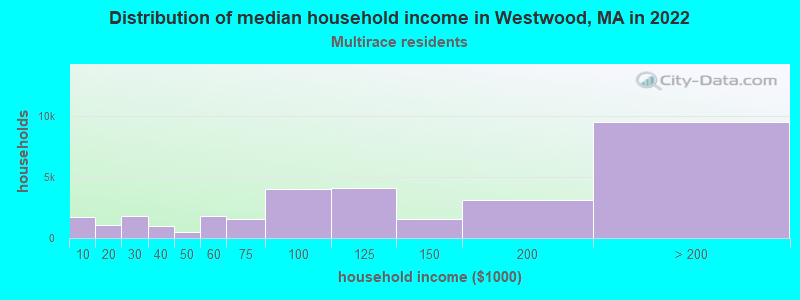
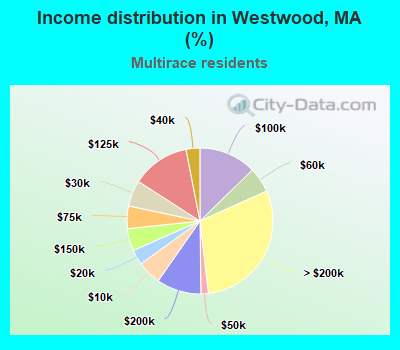
Income statistics for Multirace residents
Median household income in Westwood, MA in 2022:| Westwood: | $256,382 |
| Massachusetts: | $71,552 |
Number of households with income < $10k:| Westwood: | 5.3% (1,693) |
| Massachusetts: | 6.6% (15,127) |
Number of households with income $10k - 20k:| Westwood: | 3.4% (1,069) |
| Massachusetts: | 9.2% (21,158) |
Number of households with income $20k - 30k:| Westwood: | 5.8% (1,842) |
| Massachusetts: | 7.8% (18,016) |
Number of households with income $30k - 40k:| Westwood: | 3.1% (980) |
| State: | 7.9% (18,260) |
Number of households with income $40k - 50k:| Westwood: | 1.6% (520) |
| State: | 5.6% (13,027) |
Number of households with income $50k - 60k:| Westwood: | 5.6% (1,780) |
| Massachusetts: | 5.6% (12,909) |
Number of households with income $60k - 75k:| Westwood: | 5.0% (1,591) |
| State: | 9.0% (20,800) |
Number of households with income $75k - 100k:| Westwood: | 12.7% (4,055) |
| State: | 12.1% (27,875) |
Number of households with income $100k - 125k:| Westwood: | 12.8% (4,092) |
| State: | 8.1% (18,754) |
Number of households with income $125k - 150k:| Westwood: | 5.0% (1,580) |
| Massachusetts: | 6.8% (15,621) |
Number of households with income $150k - 200k:| Westwood: | 9.9% (3,154) |
| State: | 9.4% (21,618) |
Number of households with income > $200k:| Westwood: | 29.9% (9,526) |
| Massachusetts: | 12.0% (27,592) |
Aggregate household income in Westwood in 2022: $63,367,081
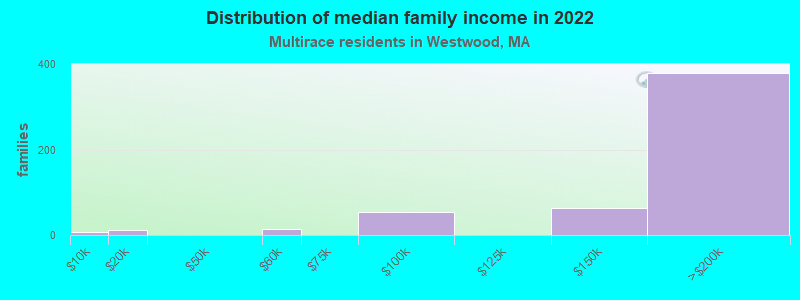
Median family income in Westwood in 2022:| Westwood: | $275,338 |
| State: | $78,380 |
Number of families with income < $10k:| Westwood: | 1.5% (8) |
| State: | 4.5% (7,017) |
Number of families with income $10k - 20k:| Westwood: | 2.2% (12) |
| Massachusetts: | 4.9% (7,678) |
Number of families with income $50k - 60k:| Westwood: | 2.5% (13) |
| State: | 6.7% (10,445) |
Number of families with income $75k - 100k:| Westwood: | 10.1% (53) |
| State: | 12.1% (18,758) |
Number of families with income $125k - 150k:| Westwood: | 11.7% (62) |
| State: | 7.2% (11,128) |
Number of families with income $150k - 200k:| Westwood: | 72.0% (380) |
| Massachusetts: | 10.3% (15,978) |
Median per capita income in Westwood in 2022:| Westwood: | $27,826 |
| State: | $34,029 |