West Valley, California (CA) income map, earnings map, and wages data
The median household income in West Valley, CA in 2022 was $104,072, which was 12.0% greater than the median annual income of $91,551 across the entire state of California. Compared to the median income of $56,786 in 2000 this represents an increase of 45.4%. The per capita income in 2022 was $46,373, which means an increase of 50.0% compared to 2000 when it was $23,195.
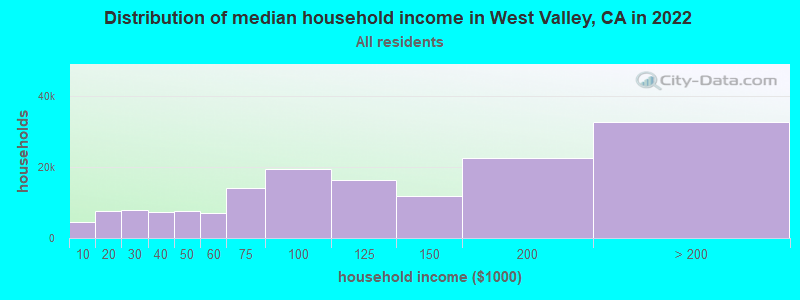
Income statistics for all residents
Median household income in West Valley, CA in 2022:| West Valley: | $104,072 |
| California: | $91,551 |
Change in median household income between 2000 and 2022:| West Valley, California: | +83.3% |
| State: | +92.8% |
Number of households with income < $10k:| West Valley: | 2.9% (4,589) |
| State: | 4.8% (654,370) |
Number of households with income $10k - 20k:| West Valley: | 4.8% (7,560) |
| California: | 5.8% (789,493) |
Number of households with income $20k - 30k:| West Valley: | 4.9% (7,797) |
| California: | 5.7% (778,318) |
Number of households with income $30k - 40k:| West Valley: | 4.6% (7,259) |
| State: | 5.8% (783,170) |
Number of households with income $40k - 50k:| West Valley: | 4.8% (7,530) |
| California: | 5.8% (781,352) |
Number of households with income $50k - 60k:| West Valley: | 4.4% (6,919) |
| California: | 5.6% (760,175) |
Number of households with income $60k - 75k:| West Valley: | 8.8% (13,908) |
| State: | 8.2% (1,104,699) |
Number of households with income $75k - 100k:| West Valley: | 12.3% (19,516) |
| State: | 12.0% (1,627,633) |
Number of households with income $100k - 125k:| West Valley: | 10.2% (16,160) |
| State: | 10.0% (1,358,619) |
Number of households with income $125k - 150k:| West Valley: | 7.5% (11,819) |
| State: | 7.6% (1,027,455) |
Number of households with income $150k - 200k:| West Valley: | 14.2% (22,483) |
| California: | 10.6% (1,439,811) |
Number of households with income > $200k:| West Valley: | 20.6% (32,580) |
| California: | 18.0% (2,445,491) |
Aggregate household income in West Valley in 2022: $5,550,797,183
Median family income in West Valley in 2022:| West Valley: | $118,684 |
| State: | $104,823 |
Median non-family income in West Valley in 2022:| West Valley: | $54,466 |
| State: | $59,348 |
Change in median non-family income between 2000 and 2022:| West Valley, California: | +75.1% |
| State: | +85.3% |
Median per capita income in West Valley in 2022:| West Valley: | $46,373 |
| California: | $46,661 |
Change in median per capita income between 2000 and 2022:| West Valley, California: | +99.9% |
| California: | +105.5% |
Income statistics for White residents
Median household income in West Valley, CA in 2022:| West Valley: | $107,011 |
| California: | $100,917 |
Change in median household income between 2000 and 2022:| West Valley, California: | +83.1% |
| California: | +96.8% |
Number of households with income < $10k:| West Valley: | 2.7% (3,294) |
| California: | 4.4% (284,109) |
Number of households with income $10k - 20k:| West Valley: | 5.5% (6,687) |
| State: | 5.3% (340,330) |
Number of households with income $20k - 30k:| West Valley: | 5.1% (6,125) |
| California: | 5.3% (343,145) |
Number of households with income $30k - 40k:| West Valley: | 4.8% (5,838) |
| State: | 5.1% (330,146) |
Number of households with income $40k - 50k:| West Valley: | 5.3% (6,419) |
| State: | 5.2% (335,310) |
Number of households with income $50k - 60k:| West Valley: | 4.5% (5,398) |
| State: | 5.1% (326,299) |
Number of households with income $60k - 75k:| West Valley: | 7.7% (9,280) |
| State: | 7.6% (487,640) |
Number of households with income $75k - 100k:| West Valley: | 11.5% (13,883) |
| California: | 11.5% (736,578) |
Number of households with income $100k - 125k:| West Valley: | 11.0% (13,312) |
| State: | 10.1% (648,782) |
Number of households with income $125k - 150k:| West Valley: | 7.3% (8,882) |
| State: | 7.8% (499,671) |
Number of households with income $150k - 200k:| West Valley: | 14.8% (17,932) |
| State: | 11.4% (729,603) |
Number of households with income > $200k:| West Valley: | 19.8% (24,000) |
| State: | 21.2% (1,364,246) |
Aggregate household income in West Valley in 2022: $3,631,381,699
Median family income in West Valley in 2022:| West Valley: | $119,989 |
| State: | $125,379 |
Number of families with income < $10k:| West Valley: | 1.9% (117) |
| State: | 2.2% (87,079) |
Number of families with income $10k - 20k:| West Valley: | 3.7% (229) |
| State: | 2.5% (97,716) |
Number of families with income $20k - 30k:| West Valley: | 4.2% (264) |
| California: | 3.5% (137,295) |
Number of families with income $30k - 40k:| West Valley: | 2.7% (169) |
| California: | 3.9% (152,947) |
Number of families with income $40k - 50k:| West Valley: | 4.3% (268) |
| State: | 4.3% (169,197) |
Number of families with income $50k - 60k:| West Valley: | 5.1% (316) |
| State: | 4.5% (176,192) |
Number of families with income $60k - 75k:| West Valley: | 9.1% (571) |
| State: | 7.0% (274,752) |
Number of families with income $75k - 100k:| West Valley: | 12.5% (783) |
| California: | 11.3% (445,632) |
Number of families with income $100k - 125k:| West Valley: | 15.1% (943) |
| State: | 10.7% (423,630) |
Number of families with income $125k - 150k:| West Valley: | 7.1% (444) |
| State: | 9.1% (357,408) |
Number of families with income $150k - 200k:| West Valley: | 13.5% (843) |
| State: | 13.5% (532,693) |
Number of families with income > $200k:| West Valley: | 20.7% (1,292) |
| State: | 27.6% (1,086,948) |
Median non-family income in West Valley in 2022:| West Valley: | $52,167 |
| California: | $62,819 |
Change in median non-family income between 2000 and 2022:| West Valley, California: | +70.6% |
| State: | +84.4% |
Median per capita income in West Valley in 2022:| West Valley: | $50,609 |
| State: | $61,706 |
Change in median per capita income between 2000 and 2022:| West Valley, California: | +105.7% |
| State: | +122.7% |
Income statistics for Black or African American residents
Median household income in West Valley, CA in 2022:| West Valley: | $111,892 |
| State: | $63,268 |
Change in median household income between 2000 and 2022:| West Valley, California: | +43.6% |
| State: | +81.0% |
Number of households with income < $10k:| West Valley: | 9.0% (81,572) |
| California: | 9.0% (73,219) |
Number of households with income $10k - 20k:| West Valley: | 10.6% (96,549) |
| State: | 10.6% (86,666) |
Number of households with income $20k - 30k:| West Valley: | 7.1% (64,292) |
| California: | 7.1% (57,719) |
Number of households with income $30k - 40k:| West Valley: | 7.2% (65,460) |
| State: | 7.2% (58,714) |
Number of households with income $40k - 50k:| West Valley: | 7.1% (64,665) |
| California: | 7.1% (58,075) |
Number of households with income $50k - 60k:| West Valley: | 6.8% (61,586) |
| California: | 6.8% (55,229) |
Number of households with income $60k - 75k:| West Valley: | 8.8% (80,032) |
| State: | 8.8% (71,895) |
Number of households with income $75k - 100k:| West Valley: | 11.9% (107,930) |
| State: | 11.9% (96,893) |
Number of households with income $100k - 125k:| West Valley: | 8.7% (78,720) |
| State: | 8.7% (70,729) |
Number of households with income $125k - 150k:| West Valley: | 6.3% (57,077) |
| State: | 6.3% (51,211) |
Number of households with income $150k - 200k:| West Valley: | 7.2% (65,382) |
| California: | 7.2% (58,687) |
Number of households with income > $200k:| West Valley: | 9.3% (84,032) |
| State: | 9.3% (75,487) |
Aggregate household income in West Valley in 2022: $52,477,251
Median family income in West Valley in 2022:| West Valley: | $102,283 |
| State: | $77,263 |
Number of families with income $30k - 40k:| West Valley: | 3.1% (4) |
| State: | 6.8% (30,948) |
Number of families with income $60k - 75k:| West Valley: | 11.6% (15) |
| State: | 8.7% (40,021) |
Number of families with income $75k - 100k:| West Valley: | 44.2% (58) |
| California: | 12.4% (56,846) |
Number of families with income $100k - 125k:| West Valley: | 21.5% (28) |
| State: | 9.8% (44,911) |
Number of families with income $125k - 150k:| West Valley: | 19.6% (26) |
| California: | 7.5% (34,434) |
Median non-family income in West Valley in 2022:| West Valley: | $170,758 |
| State: | $41,942 |
Median per capita income in West Valley in 2022:| West Valley: | $47,263 |
| California: | $36,708 |
Change in median per capita income between 2000 and 2022:| West Valley, California: | +45.9% |
| State: | +110.4% |
Income statistics for Asian residents
Median household income in West Valley, CA in 2022:| West Valley: | $193,498 |
| California: | $119,861 |
Change in median household income between 2000 and 2022:| West Valley, California: | +139.6% |
| California: | +116.5% |
Number of households with income < $10k:| West Valley: | 1.4% (211) |
| State: | 5.1% (106,273) |
Number of households with income $10k - 20k:| West Valley: | 1.4% (211) |
| State: | 4.9% (101,815) |
Number of households with income $20k - 30k:| West Valley: | 2.1% (306) |
| State: | 4.6% (94,414) |
Number of households with income $30k - 40k:| West Valley: | 1.3% (183) |
| California: | 4.1% (84,491) |
Number of households with income $40k - 50k:| West Valley: | 2.5% (361) |
| State: | 4.0% (81,758) |
Number of households with income $50k - 60k:| West Valley: | 3.7% (541) |
| State: | 3.9% (80,971) |
Number of households with income $60k - 75k:| West Valley: | 6.3% (924) |
| State: | 6.0% (124,194) |
Number of households with income $75k - 100k:| West Valley: | 9.6% (1,399) |
| California: | 9.7% (200,337) |
Number of households with income $100k - 125k:| West Valley: | 11.7% (1,708) |
| State: | 9.4% (193,488) |
Number of households with income $125k - 150k:| West Valley: | 9.4% (1,375) |
| State: | 7.7% (158,253) |
Number of households with income $150k - 200k:| West Valley: | 16.5% (2,398) |
| California: | 12.2% (252,139) |
Number of households with income > $200k:| West Valley: | 34.0% (4,958) |
| State: | 28.4% (586,641) |
Aggregate household income in West Valley in 2022: $108,323,074
Median family income in West Valley in 2022:| West Valley: | $162,455 |
| California: | $136,040 |
Number of families with income $30k - 40k:| West Valley: | 4.6% (8) |
| State: | 3.7% (55,234) |
Number of families with income $40k - 50k:| West Valley: | 5.8% (10) |
| State: | 3.9% (58,471) |
Number of families with income $50k - 60k:| West Valley: | 4.8% (8) |
| State: | 3.9% (58,911) |
Number of families with income $60k - 75k:| West Valley: | 20.7% (36) |
| State: | 5.9% (88,675) |
Number of families with income $75k - 100k:| West Valley: | 5.0% (9) |
| California: | 9.5% (143,103) |
Number of families with income $100k - 125k:| West Valley: | 25.4% (44) |
| State: | 9.4% (142,085) |
Number of families with income $125k - 150k:| West Valley: | 11.6% (20) |
| State: | 8.0% (120,635) |
Number of families with income $150k - 200k:| West Valley: | 22.1% (38) |
| State: | 13.2% (198,099) |
Median non-family income in West Valley in 2022:| West Valley: | $21,879 |
| California: | $74,216 |
Change in median non-family income between 2000 and 2022:| West Valley, California: | +94.5% |
| California: | +136.3% |
Median per capita income in West Valley in 2022:| West Valley: | $58,517 |
| State: | $58,824 |
Change in median per capita income between 2000 and 2022:| West Valley, California: | +124.8% |
| California: | +166.8% |
Income statistics for Hispanic or Latino residents
Median household income in West Valley, CA in 2022:| West Valley: | $72,583 |
| State: | $75,698 |
Change in median household income between 2000 and 2022:| West Valley, California: | +72.3% |
| State: | +107.2% |
Number of households with income < $10k:| West Valley: | 3.1% (549) |
| State: | 4.3% (183,294) |
Number of households with income $10k - 20k:| West Valley: | 2.5% (433) |
| State: | 6.0% (253,903) |
Number of households with income $20k - 30k:| West Valley: | 5.5% (976) |
| State: | 6.8% (286,386) |
Number of households with income $30k - 40k:| West Valley: | 7.7% (1,350) |
| State: | 7.4% (313,728) |
Number of households with income $40k - 50k:| West Valley: | 6.2% (1,094) |
| California: | 7.4% (313,199) |
Number of households with income $50k - 60k:| West Valley: | 2.9% (511) |
| State: | 7.2% (305,366) |
Number of households with income $60k - 75k:| West Valley: | 18.3% (3,216) |
| State: | 10.3% (434,937) |
Number of households with income $75k - 100k:| West Valley: | 13.2% (2,317) |
| California: | 14.4% (607,302) |
Number of households with income $100k - 125k:| West Valley: | 5.4% (946) |
| State: | 10.6% (447,424) |
Number of households with income $125k - 150k:| West Valley: | 5.3% (938) |
| State: | 7.5% (316,022) |
Number of households with income $150k - 200k:| West Valley: | 10.9% (1,927) |
| State: | 9.2% (386,269) |
Number of households with income > $200k:| West Valley: | 19.0% (3,354) |
| State: | 8.8% (372,651) |
Aggregate household income in West Valley in 2022: $333,379,699
Median family income in West Valley in 2022:| West Valley: | $89,280 |
| California: | $77,589 |
Number of families with income < $10k:| West Valley: | 2.9% (83) |
| State: | 3.9% (129,468) |
Number of families with income $10k - 20k:| West Valley: | 4.8% (135) |
| State: | 4.6% (151,997) |
Number of families with income $20k - 30k:| West Valley: | 6.7% (189) |
| State: | 6.6% (216,764) |
Number of families with income $30k - 40k:| West Valley: | 6.0% (168) |
| California: | 7.6% (249,849) |
Number of families with income $40k - 50k:| West Valley: | 8.2% (230) |
| State: | 7.7% (254,822) |
Number of families with income $50k - 60k:| West Valley: | 9.3% (262) |
| State: | 7.4% (244,815) |
Number of families with income $60k - 75k:| West Valley: | 11.9% (334) |
| California: | 10.5% (345,838) |
Number of families with income $75k - 100k:| West Valley: | 17.2% (483) |
| State: | 14.9% (491,589) |
Number of families with income $100k - 125k:| West Valley: | 14.7% (411) |
| State: | 10.7% (355,400) |
Number of families with income $125k - 150k:| West Valley: | 5.0% (141) |
| State: | 7.8% (259,317) |
Number of families with income $150k - 200k:| West Valley: | 7.7% (215) |
| State: | 9.3% (306,566) |
Number of families with income > $200k:| West Valley: | 5.4% (152) |
| State: | 9.1% (299,984) |
Median non-family income in West Valley in 2022:| West Valley: | $39,966 |
| California: | $49,746 |
Change in median non-family income between 2000 and 2022:| West Valley, California: | +50.1% |
| State: | +100.7% |
Median per capita income in West Valley in 2022:| West Valley: | $32,608 |
| State: | $27,240 |
Change in median per capita income between 2000 and 2022:| West Valley, California: | +119.5% |
| California: | +133.3% |
Income statistics for American Indian and Alaska Native residents
Median household income in West Valley, CA in 2022:| West Valley: | $120,957 |
| State: | $76,752 |
Change in median household income between 2000 and 2022:| West Valley, California: | +113.8% |
| State: | +110.0% |
Number of households with income < $10k:| West Valley: | 5.4% (6,527) |
| California: | 5.4% (8,471) |
Number of households with income $10k - 20k:| West Valley: | 6.0% (7,201) |
| State: | 6.0% (9,381) |
Number of households with income $20k - 30k:| West Valley: | 5.6% (6,766) |
| State: | 5.5% (8,668) |
Number of households with income $30k - 40k:| West Valley: | 8.2% (9,925) |
| California: | 8.3% (13,030) |
Number of households with income $40k - 50k:| West Valley: | 7.0% (8,398) |
| State: | 6.9% (10,908) |
Number of households with income $50k - 60k:| West Valley: | 7.1% (8,584) |
| State: | 7.1% (11,198) |
Number of households with income $60k - 75k:| West Valley: | 9.6% (11,594) |
| State: | 9.6% (15,190) |
Number of households with income $75k - 100k:| West Valley: | 14.0% (16,936) |
| State: | 14.1% (22,274) |
Number of households with income $100k - 125k:| West Valley: | 11.3% (13,606) |
| State: | 11.2% (17,643) |
Number of households with income $125k - 150k:| West Valley: | 8.3% (9,969) |
| State: | 8.3% (13,117) |
Number of households with income $150k - 200k:| West Valley: | 8.8% (10,595) |
| State: | 8.8% (13,853) |
Number of households with income > $200k:| West Valley: | 8.8% (10,638) |
| State: | 8.8% (13,925) |
Aggregate household income in West Valley in 2022: $4,552,045
Median family income in West Valley in 2022:| West Valley: | $101,210 |
| State: | $81,108 |
Number of families with income $20k - 30k:| West Valley: | 8.8% (6) |
| State: | 4.3% (4,876) |
Number of families with income $30k - 40k:| West Valley: | 11.8% (8) |
| California: | 8.8% (9,994) |
Number of families with income $40k - 50k:| West Valley: | 19.2% (13) |
| State: | 7.8% (8,776) |
Number of families with income $60k - 75k:| West Valley: | 13.6% (9) |
| California: | 9.1% (10,247) |
Number of families with income $75k - 100k:| West Valley: | 46.6% (32) |
| State: | 14.8% (16,731) |
Median per capita income in West Valley in 2022:| West Valley: | $21,850 |
| State: | $30,289 |
Change in median per capita income between 2000 and 2022:| West Valley, California: | +3.3% |
| State: | +98.9% |
Income statistics for Multirace residents
Median household income in West Valley, CA in 2022:| West Valley: | $90,132 |
| California: | $83,153 |
Change in median household income between 2000 and 2022:| West Valley, California: | +84.2% |
| California: | +106.0% |
Number of households with income < $10k:| West Valley: | 5.5% (1,004) |
| State: | 4.2% (85,299) |
Number of households with income $10k - 20k:| West Valley: | 2.4% (444) |
| California: | 6.1% (122,966) |
Number of households with income $20k - 30k:| West Valley: | 4.7% (871) |
| State: | 6.4% (129,328) |
Number of households with income $30k - 40k:| West Valley: | 2.7% (496) |
| State: | 6.4% (130,070) |
Number of households with income $40k - 50k:| West Valley: | 4.6% (837) |
| State: | 6.5% (131,254) |
Number of households with income $50k - 60k:| West Valley: | 5.4% (988) |
| California: | 6.5% (132,382) |
Number of households with income $60k - 75k:| West Valley: | 15.8% (2,902) |
| State: | 9.4% (191,472) |
Number of households with income $75k - 100k:| West Valley: | 15.2% (2,796) |
| State: | 13.3% (269,691) |
Number of households with income $100k - 125k:| West Valley: | 4.6% (855) |
| State: | 10.2% (207,286) |
Number of households with income $125k - 150k:| West Valley: | 7.4% (1,367) |
| California: | 7.8% (158,259) |
Number of households with income $150k - 200k:| West Valley: | 10.5% (1,940) |
| State: | 10.3% (209,227) |
Number of households with income > $200k:| West Valley: | 21.2% (3,890) |
| State: | 13.0% (263,210) |
Aggregate household income in West Valley in 2022: $242,699,672
Median family income in West Valley in 2022:| West Valley: | $107,029 |
| State: | $87,642 |
Number of families with income < $10k:| West Valley: | 4.0% (32) |
| State: | 3.2% (48,017) |
Number of families with income $10k - 20k:| West Valley: | 3.9% (32) |
| State: | 4.1% (60,419) |
Number of families with income $20k - 30k:| West Valley: | 7.3% (59) |
| State: | 6.1% (89,742) |
Number of families with income $40k - 50k:| West Valley: | 6.0% (49) |
| California: | 6.8% (100,085) |
Number of families with income $50k - 60k:| West Valley: | 15.8% (129) |
| State: | 6.7% (98,298) |
Number of families with income $60k - 75k:| West Valley: | 25.0% (204) |
| California: | 9.5% (140,131) |
Number of families with income $75k - 100k:| West Valley: | 38.1% (311) |
| State: | 13.8% (203,439) |
Median non-family income in West Valley in 2022:| West Valley: | $48,258 |
| State: | $56,558 |
Change in median non-family income between 2000 and 2022:| West Valley, California: | +83.8% |
| State: | +100.2% |
Median per capita income in West Valley in 2022:| West Valley: | $34,780 |
| State: | $32,124 |
Income statistics for other residents
Number of households with income < $10k:| West Valley: | 4.6% (494) |
| State: | 4.6% (93,035) |
Number of households with income $10k - 20k:| West Valley: | 6.3% (670) |
| California: | 6.3% (126,222) |
Number of households with income $20k - 30k:| West Valley: | 7.1% (756) |
| State: | 7.1% (142,656) |
Number of households with income $30k - 40k:| West Valley: | 8.2% (875) |
| California: | 8.2% (165,018) |
Number of households with income $40k - 50k:| West Valley: | 8.1% (858) |
| State: | 8.0% (161,732) |
Number of households with income $50k - 60k:| West Valley: | 7.6% (807) |
| State: | 7.6% (152,152) |
Number of households with income $60k - 75k:| West Valley: | 10.4% (1,112) |
| State: | 10.4% (209,951) |
Number of households with income $75k - 100k:| West Valley: | 14.7% (1,567) |
| State: | 14.7% (296,102) |
Number of households with income $100k - 125k:| West Valley: | 10.7% (1,135) |
| State: | 10.7% (214,281) |
Number of households with income $125k - 150k:| West Valley: | 7.1% (757) |
| California: | 7.1% (143,092) |
Number of households with income $150k - 200k:| West Valley: | 8.6% (912) |
| State: | 8.6% (172,215) |
Number of households with income > $200k:| West Valley: | 6.7% (711) |
| State: | 6.7% (134,102) |
Aggregate household income in West Valley in 2022: $126,779,083
Median family income in West Valley in 2022:| West Valley: | $71,639 |
| State: | $72,756 |
Number of families with income < $10k:| West Valley: | 8.2% (52) |
| State: | 4.3% (69,090) |
Number of families with income $10k - 20k:| West Valley: | 2.6% (16) |
| State: | 5.1% (82,116) |
Number of families with income $20k - 30k:| West Valley: | 5.6% (36) |
| California: | 7.0% (112,854) |
Number of families with income $30k - 40k:| West Valley: | 9.2% (59) |
| California: | 8.4% (135,938) |
Number of families with income $40k - 50k:| West Valley: | 15.3% (98) |
| State: | 8.4% (135,353) |
Number of families with income $50k - 60k:| West Valley: | 10.8% (69) |
| State: | 7.7% (124,826) |
Number of families with income $60k - 75k:| West Valley: | 11.4% (73) |
| State: | 10.7% (173,628) |
Number of families with income $75k - 100k:| West Valley: | 13.2% (85) |
| State: | 15.2% (245,724) |
Number of families with income $100k - 125k:| West Valley: | 7.3% (47) |
| California: | 10.9% (176,716) |
Number of families with income $125k - 150k:| West Valley: | 6.6% (42) |
| State: | 7.4% (119,985) |
Number of families with income > $200k:| West Valley: | 9.9% (64) |
| State: | 6.6% (106,346) |
Median non-family income in West Valley in 2022:| West Valley: | $100,984 |
| California: | $43,881 |
Change in median non-family income between 2000 and 2022:| West Valley, California: | +99.5% |
| State: | +84.6% |
Median per capita income in West Valley in 2022:| West Valley: | $33,591 |
| California: | $25,164 |