The median household income in Washingtonville, PA in 2022 was $45,382, which was 58.2% less than the median annual income of $71,798 across the entire state of Pennsylvania. Compared to the median income of $35,278 in 2000 this represents an increase of 22.3%. The per capita income in 2022 was $24,088, which means an increase of 12.0% compared to 2000 when it was $21,206.
Whole page based on the data from 2000 / 2022 when the population of Washingtonville, Pennsylvania was 201 / 221
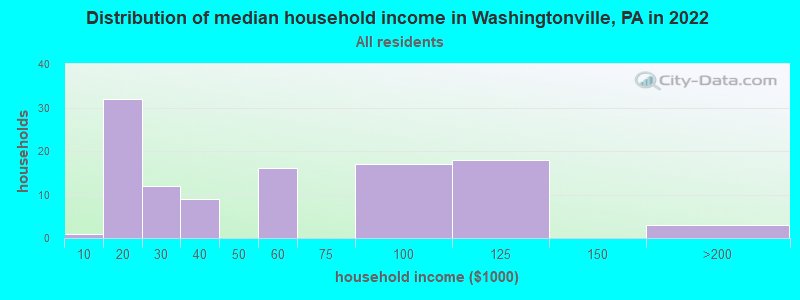
Income statistics for all residents
Median household income in Washingtonville, PA in 2022:
Washingtonville:
$45,383
State:
$71,798
Change in median household income between 2000 and 2022:
Washingtonville, Pennsylvania:
+28.6%
State:
+79.0%
Number of households with income < $10k:
Washingtonville:
0.9% (1)
Pennsylvania:
5.5% (291,562)
Number of households with income $10k - 20k:
Washingtonville:
29.6% (32)
State:
7.3% (384,726)
Number of households with income $20k - 30k:
Washingtonville:
11.1% (12)
State:
7.4% (389,464)
Number of households with income $30k - 40k:
Washingtonville:
8.3% (9)
State:
7.6% (402,138)
Number of households with income $40k - 50k:
Washingtonville:
0.0% (0)
Pennsylvania:
7.3% (387,945)
Number of households with income $50k - 60k:
Washingtonville:
14.8% (16)
State:
7.0% (372,468)
Number of households with income $60k - 75k:
Washingtonville:
0.0% (0)
Pennsylvania:
9.9% (524,786)
Number of households with income $75k - 100k:
Washingtonville:
15.7% (17)
State:
12.6% (666,253)
Number of households with income $100k - 125k:
Washingtonville:
16.7% (18)
State:
9.9% (526,402)
Number of households with income $125k - 150k:
Washingtonville:
0.0% (0)
State:
6.9% (362,702)
Number of households with income $150k - 200k:
Washingtonville:
2.8% (3)
Pennsylvania:
8.3% (440,827)
Number of households with income > $200k:
Washingtonville:
0.0% (0)
State:
10.3% (544,792)
Aggregate household income in Washingtonville in 2022: $5,933,729
Median non-family income in Washingtonville in 2022:
Washingtonville:
$17,229
State:
$42,203
Change in median non-family income between 2000 and 2022:: -22.7%
Washingtonville, Pennsylvania:
-22.7%
Pennsylvania:
+90.1%
Median per capita income in Washingtonville in 2022:
Washingtonville:
$24,088
Pennsylvania:
$41,489
Change in median per capita income between 2000 and 2022:
Washingtonville, Pennsylvania:
+13.6%
State:
+98.7%
Income statistics for White residents
Median household income in Washingtonville, PA in 2022:
Washingtonville:
$45,540
State:
$76,765
Change in median household income between 2000 and 2022:
Washingtonville, Pennsylvania:
+29.1%
State:
+84.3%
Number of households with income < $10k:
Washingtonville:
0.9% (1)
State:
4.3% (179,792)
Number of households with income $10k - 20k:
Washingtonville:
29.2% (31)
Pennsylvania:
6.5% (268,738)
Number of households with income $20k - 30k:
Washingtonville:
10.4% (11)
Pennsylvania:
7.0% (288,138)
Number of households with income $30k - 40k:
Washingtonville:
8.5% (9)
State:
7.2% (300,208)
Number of households with income $40k - 50k:
Washingtonville:
0.0% (0)
Pennsylvania:
7.2% (298,756)
Number of households with income $50k - 60k:
Washingtonville:
15.1% (16)
State:
6.8% (283,251)
Number of households with income $60k - 75k:
Washingtonville:
0.0% (0)
State:
9.9% (408,159)
Number of households with income $75k - 100k:
Washingtonville:
16.0% (17)
Pennsylvania:
13.2% (547,809)
Number of households with income $100k - 125k:
Washingtonville:
17.0% (18)
State:
10.5% (436,652)
Number of households with income $125k - 150k:
Washingtonville:
0.0% (0)
State:
7.3% (304,132)
Number of households with income $150k - 200k:
Washingtonville:
2.8% (3)
State:
9.0% (374,658)
Number of households with income > $200k:
Washingtonville:
0.0% (0)
State:
10.9% (452,618)
Aggregate household income in Washingtonville in 2022: $5,760,951
Median non-family income in Washingtonville in 2022:
Washingtonville:
$17,224
State:
$44,251
Change in median non-family income between 2000 and 2022:: -22.7%
Washingtonville, Pennsylvania:
-22.7%
State:
+94.2%
Median per capita income in Washingtonville in 2022:
Washingtonville:
$24,162
State:
$45,306
Change in median per capita income between 2000 and 2022:
Washingtonville, Pennsylvania:
+13.9%
State:
+105.4%
Discuss Washingtonville, Pennsylvania (PA) on our hugely popular Pennsylvania forum.