The median household income in Valley Park, MO in 2022 was $64,594, which was about the same as the median annual income of $64,811 across the entire state of Missouri. Compared to the median income of $43,548 in 2000 this represents an increase of 32.6%. The per capita income in 2022 was $40,203, which means an increase of 48.5% compared to 2000 when it was $20,720.
Whole page based on the data from 2000 / 2022 when the population of Valley Park, Missouri was 6,518 / 6,784
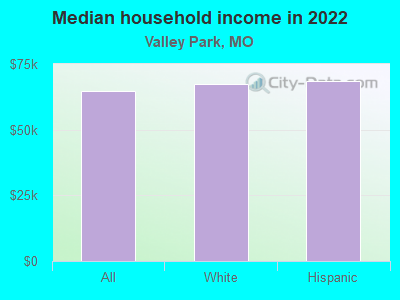
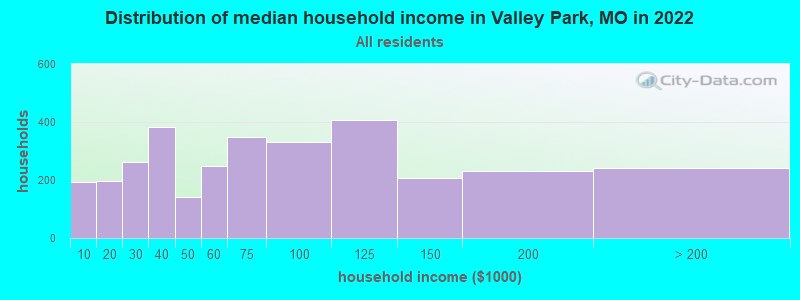
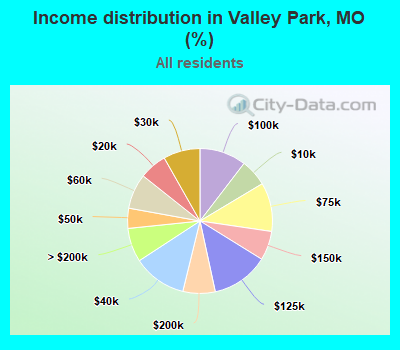
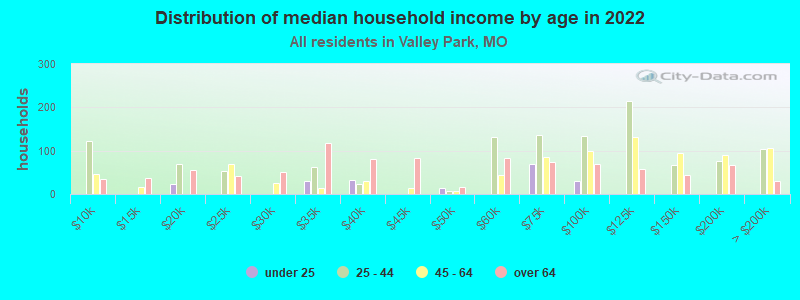
Income statistics for all residents
Median household income in Valley Park, MO in 2022:
Valley Park:
$64,594
State:
$64,811
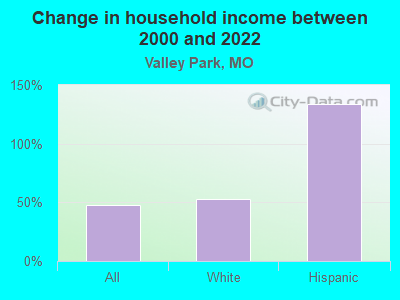
Change in median household income between 2000 and 2022:
Valley Park, Missouri:
+48.3%
State:
+70.9%
Number of households with income < $10k:
Valley Park:
6.0% (192)
State:
5.7% (144,208)
Number of households with income $10k - 20k:
Valley Park:
6.1% (195)
State:
8.2% (205,541)
Number of households with income $20k - 30k:
Valley Park:
8.2% (262)
State:
7.8% (197,162)
Number of households with income $30k - 40k:
Valley Park:
12.0% (382)
State:
8.7% (220,088)
Number of households with income $40k - 50k:
Valley Park:
4.5% (143)
Missouri:
8.2% (206,651)
Number of households with income $50k - 60k:
Valley Park:
7.8% (250)
State:
7.8% (196,521)
Number of households with income $60k - 75k:
Valley Park:
10.9% (348)
State:
10.1% (255,043)
Number of households with income $75k - 100k:
Valley Park:
10.4% (332)
Missouri:
13.4% (337,210)
Number of households with income $100k - 125k:
Valley Park:
12.8% (408)
State:
9.8% (247,187)
Number of households with income $125k - 150k:
Valley Park:
6.5% (208)
State:
6.4% (160,260)
Number of households with income $150k - 200k:
Valley Park:
7.2% (230)
State:
6.9% (174,947)
Number of households with income > $200k:
Valley Park:
7.6% (242)
Missouri:
7.0% (177,014)
Aggregate household income in Valley Park in 2022: $269,656,967
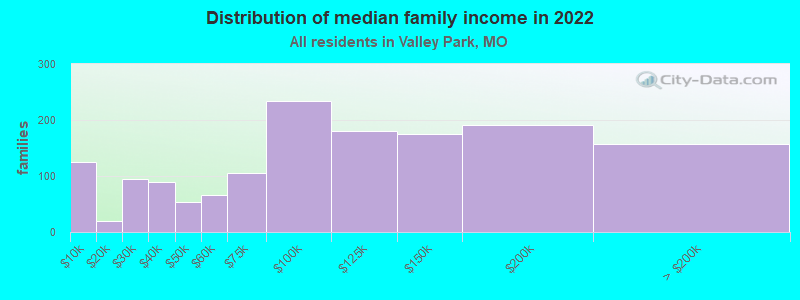
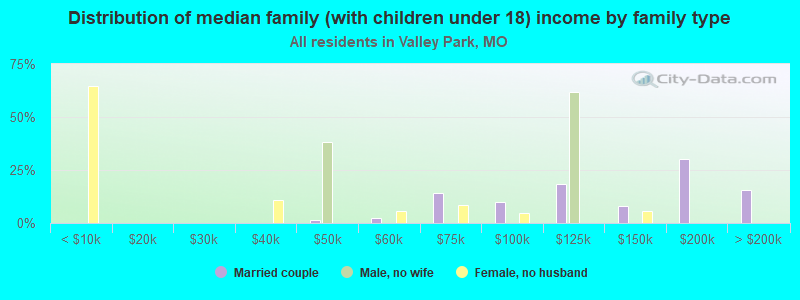
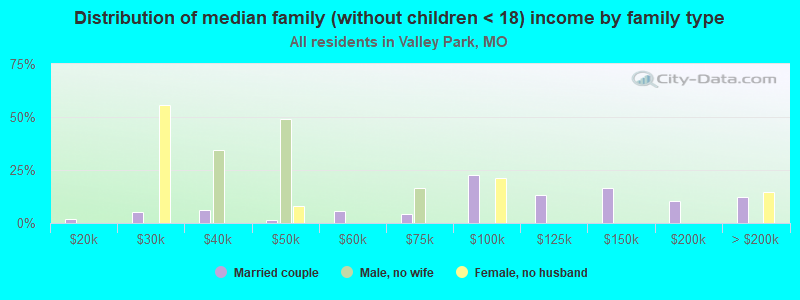
Median family income in Valley Park in 2022:
Valley Park:
$98,964
State:
$83,420
Number of families with income < $10k:
Valley Park:
8.4% (125)
State:
3.2% (49,878)
Number of families with income $10k - 20k:
Valley Park:
1.3% (19)
State:
3.9% (61,082)
Number of families with income $20k - 30k:
Valley Park:
6.3% (94)
Missouri:
5.4% (84,243)
Number of families with income $30k - 40k:
Valley Park:
6.1% (90)
State:
6.7% (104,645)
Number of families with income $40k - 50k:
Valley Park:
3.6% (54)
Missouri:
7.2% (113,014)
Number of families with income $50k - 60k:
Valley Park:
4.4% (66)
State:
7.4% (116,279)
Number of families with income $60k - 75k:
Valley Park:
7.1% (106)
Missouri:
10.5% (165,163)
Number of families with income $75k - 100k:
Valley Park:
15.7% (234)
Missouri:
15.5% (243,177)
Number of families with income $100k - 125k:
Valley Park:
12.1% (180)
State:
12.3% (192,410)
Number of families with income $125k - 150k:
Valley Park:
11.7% (175)
State:
8.5% (133,872)
Number of families with income $150k - 200k:
Valley Park:
12.8% (191)
State:
9.7% (152,662)
Number of families with income > $200k:
Valley Park:
10.6% (158)
State:
9.8% (153,310)
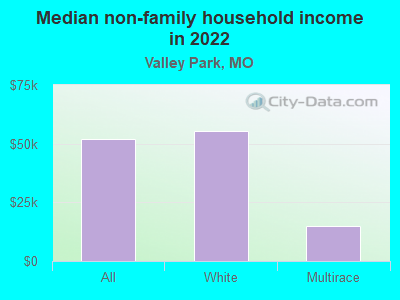
Median non-family income in Valley Park in 2022:
Valley Park:
$52,022
State:
$38,435
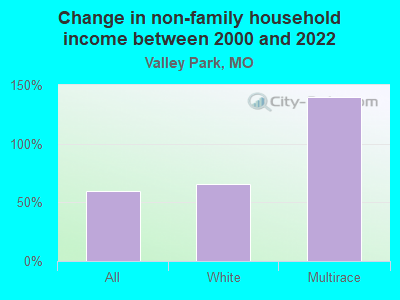
Change in median non-family income between 2000 and 2022:
Valley Park, Missouri:
+59.6%
State:
+72.4%
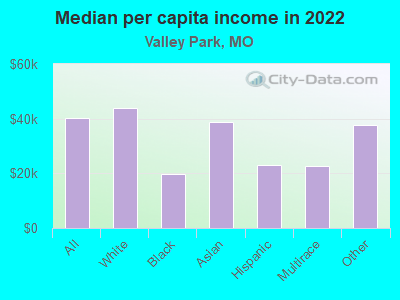
Median per capita income in Valley Park in 2022:
Valley Park:
$40,203
State:
$36,640
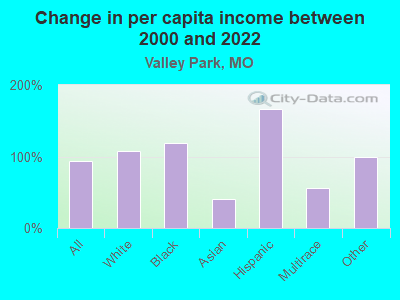
Change in median per capita income between 2000 and 2022:
Valley Park, Missouri:
+94.0%
Missouri:
+83.8%
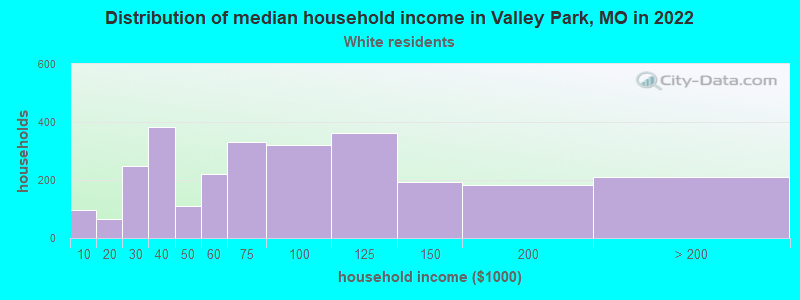
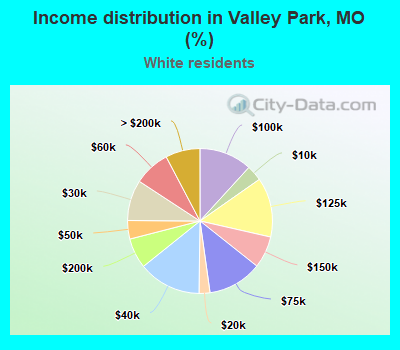
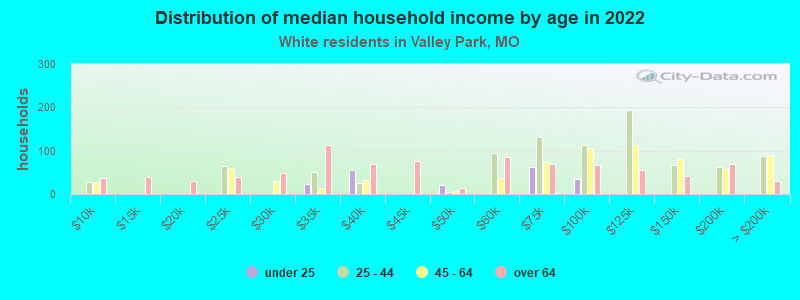
Income statistics for White residents
Median household income in Valley Park, MO in 2022:
Valley Park:
$67,420
Missouri:
$68,771
Change in median household income between 2000 and 2022:
Valley Park, Missouri:
+52.6%
State:
+73.5%
Number of households with income < $10k:
Valley Park:
3.5% (95)
State:
4.9% (98,067)
Number of households with income $10k - 20k:
Valley Park:
2.4% (66)
Missouri:
7.3% (146,436)
Number of households with income $20k - 30k:
Valley Park:
9.1% (248)
State:
7.6% (153,201)
Number of households with income $30k - 40k:
Valley Park:
14.0% (382)
Missouri:
8.4% (169,042)
Number of households with income $40k - 50k:
Valley Park:
4.1% (112)
Missouri:
8.0% (160,724)
Number of households with income $50k - 60k:
Valley Park:
8.1% (220)
State:
7.7% (155,924)
Number of households with income $60k - 75k:
Valley Park:
12.1% (330)
Missouri:
10.2% (205,080)
Number of households with income $75k - 100k:
Valley Park:
11.8% (321)
State:
14.1% (283,507)
Number of households with income $100k - 125k:
Valley Park:
13.3% (362)
Missouri:
10.2% (205,898)
Number of households with income $125k - 150k:
Valley Park:
7.1% (194)
State:
6.7% (135,287)
Number of households with income $150k - 200k:
Valley Park:
6.8% (184)
State:
7.4% (148,450)
Number of households with income > $200k:
Valley Park:
7.7% (210)
State:
7.6% (153,213)
Aggregate household income in Valley Park in 2022: $237,167,871
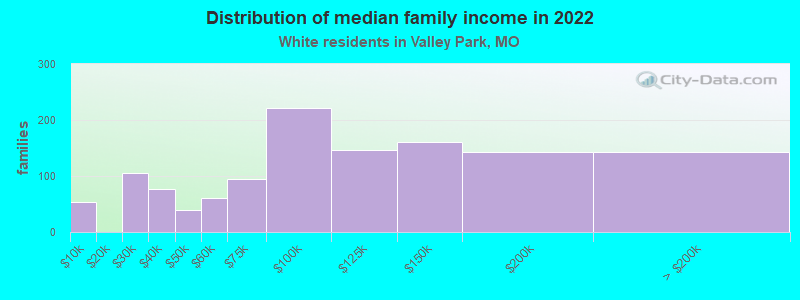
Median family income in Valley Park in 2022:
Valley Park:
$96,687
Missouri:
$87,438
Number of families with income < $10k:
Valley Park:
4.3% (54)
State:
2.5% (31,792)
Number of families with income $20k - 30k:
Valley Park:
8.5% (106)
State:
5.0% (63,337)
Number of families with income $30k - 40k:
Valley Park:
6.1% (76)
Missouri:
6.2% (78,970)
Number of families with income $40k - 50k:
Valley Park:
3.1% (39)
State:
6.8% (86,154)
Number of families with income $50k - 60k:
Valley Park:
4.8% (60)
State:
7.3% (92,637)
Number of families with income $60k - 75k:
Valley Park:
7.7% (95)
State:
10.4% (131,937)
Number of families with income $75k - 100k:
Valley Park:
17.8% (222)
State:
16.2% (206,529)
Number of families with income $100k - 125k:
Valley Park:
11.7% (146)
State:
12.9% (164,015)
Number of families with income $125k - 150k:
Valley Park:
13.0% (161)
State:
8.9% (113,643)
Number of families with income $150k - 200k:
Valley Park:
11.4% (142)
Missouri:
10.1% (129,106)
Number of families with income > $200k:
Valley Park:
11.4% (142)
State:
10.4% (132,544)
Median non-family income in Valley Park in 2022:
Valley Park:
$55,298
Missouri:
$40,207
Change in median non-family income between 2000 and 2022:
Valley Park, Missouri:
+66.5%
Missouri:
+75.5%
Median per capita income in Valley Park in 2022:
Valley Park:
$43,878
Missouri:
$39,160
Change in median per capita income between 2000 and 2022:
Valley Park, Missouri:
+107.5%
State:
+86.9%
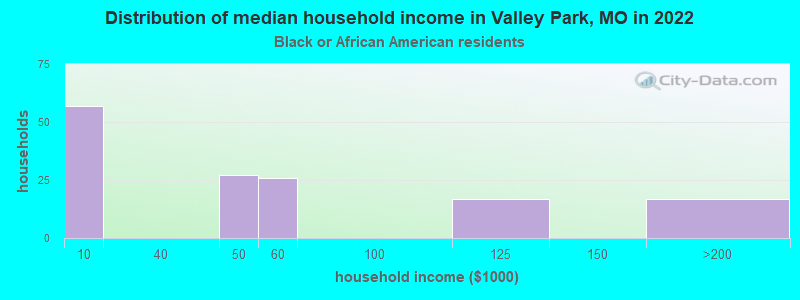
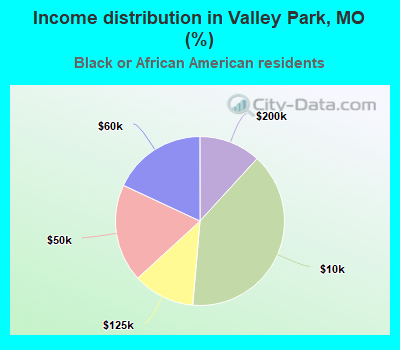
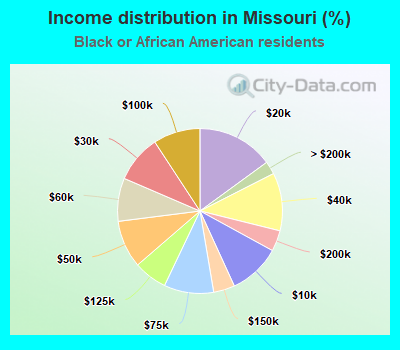
Income statistics for Black or African American residents
Number of households with income < $10k:
Valley Park:
39.6% (57)
Missouri:
10.2% (27,862)
Number of households with income $10k - 20k:
Valley Park:
0.0% (0)
Missouri:
15.0% (40,902)
Number of households with income $20k - 30k:
Valley Park:
0.0% (0)
Missouri:
9.3% (25,464)
Number of households with income $30k - 40k:
Valley Park:
0.0% (0)
Missouri:
11.4% (31,039)
Number of households with income $40k - 50k:
Valley Park:
18.8% (27)
State:
9.4% (25,559)
Number of households with income $50k - 60k:
Valley Park:
18.1% (26)
State:
8.5% (23,091)
Number of households with income $60k - 75k:
Valley Park:
0.0% (0)
Missouri:
9.7% (26,618)
Number of households with income $75k - 100k:
Valley Park:
0.0% (0)
State:
9.2% (25,189)
Number of households with income $100k - 125k:
Valley Park:
11.8% (17)
State:
6.6% (17,927)
Number of households with income $125k - 150k:
Valley Park:
0.0% (0)
State:
4.2% (11,418)
Number of households with income $150k - 200k:
Valley Park:
11.8% (17)
Missouri:
4.1% (11,192)
Number of households with income > $200k:
Valley Park:
0.0% (0)
State:
2.5% (6,954)
Aggregate household income in Valley Park in 2022: $7,970,891
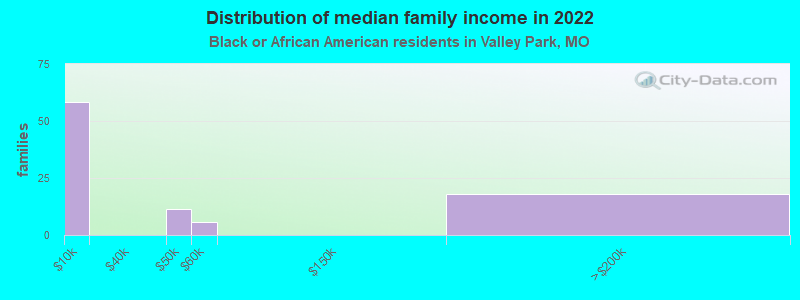
Median family income in Valley Park in 2022:
Valley Park:
$2,561
Missouri:
$56,934
Number of families with income < $10k:
Valley Park:
62.2% (58)
State:
7.6% (11,240)
Number of families with income $40k - 50k:
Valley Park:
12.4% (12)
State:
10.2% (15,092)
Number of families with income $50k - 60k:
Valley Park:
6.1% (6)
Missouri:
8.5% (12,605)
Number of families with income $150k - 200k:
Valley Park:
19.3% (18)
State:
7.0% (10,445)
Median per capita income in Valley Park in 2022:
Valley Park:
$19,775
State:
$26,193
Change in median per capita income between 2000 and 2022:
Valley Park, Missouri:
+119.0%
State:
+86.8%
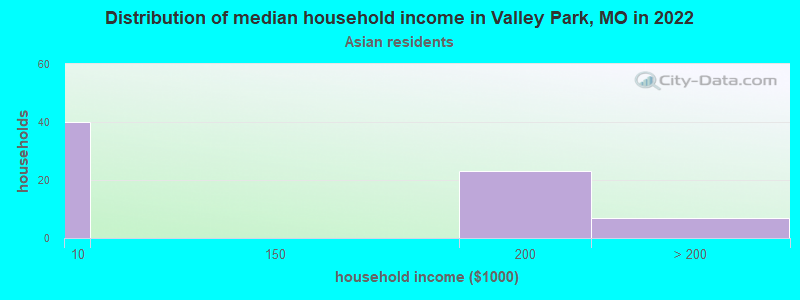
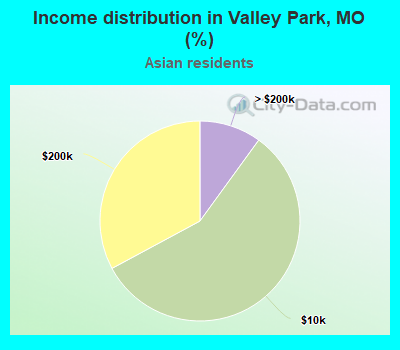
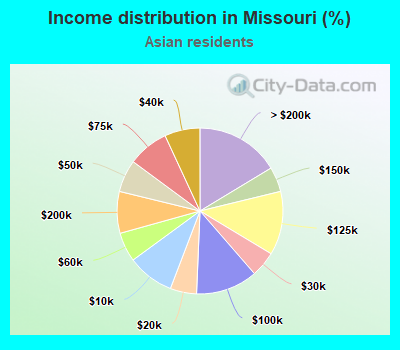
Income statistics for Asian residents
Number of households with income < $10k:
Valley Park:
57.1% (40)
Missouri:
9.1% (4,564)
Number of households with income $10k - 20k:
Valley Park:
0.0% (0)
State:
5.2% (2,574)
Number of households with income $20k - 30k:
Valley Park:
0.0% (0)
State:
5.0% (2,496)
Number of households with income $30k - 40k:
Valley Park:
0.0% (0)
Missouri:
6.9% (3,450)
Number of households with income $40k - 50k:
Valley Park:
0.0% (0)
State:
6.3% (3,160)
Number of households with income $50k - 60k:
Valley Park:
0.0% (0)
State:
5.7% (2,867)
Number of households with income $60k - 75k:
Valley Park:
0.0% (0)
State:
8.0% (3,980)
Number of households with income $75k - 100k:
Valley Park:
0.0% (0)
State:
12.0% (6,018)
Number of households with income $100k - 125k:
Valley Park:
0.0% (0)
State:
12.4% (6,211)
Number of households with income $125k - 150k:
Valley Park:
0.0% (0)
State:
4.8% (2,423)
Number of households with income $150k - 200k:
Valley Park:
32.9% (23)
State:
8.1% (4,062)
Number of households with income > $200k:
Valley Park:
10.0% (7)
Missouri:
16.4% (8,175)
Aggregate household income in Valley Park in 2022: $6,231,767
Median per capita income in Valley Park in 2022:
Valley Park:
$38,792
State:
$46,567
Change in median per capita income between 2000 and 2022:
Valley Park, Missouri:
+40.1%
State:
+118.7%
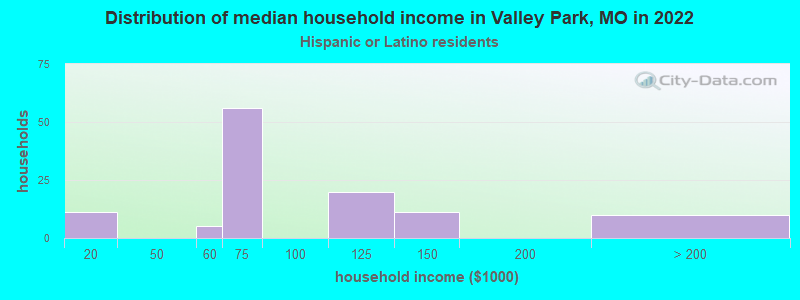
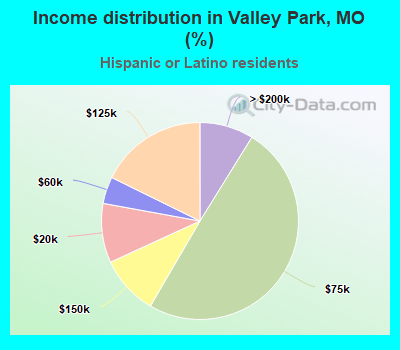
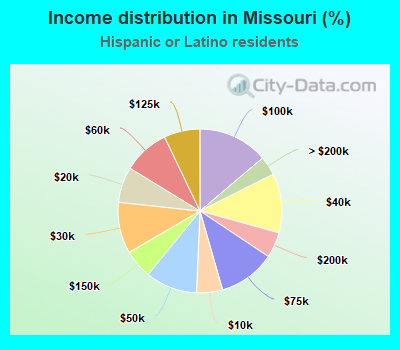
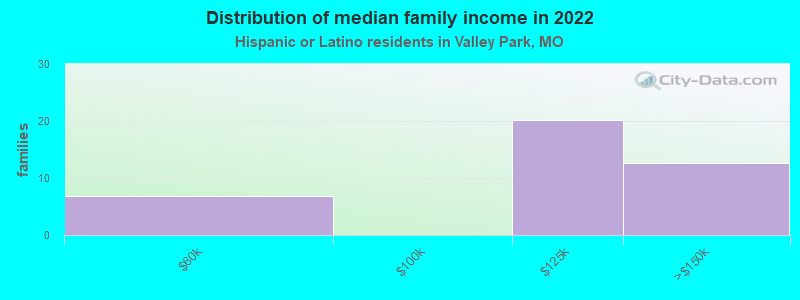
Income statistics for Hispanic or Latino residents
Median household income in Valley Park, MO in 2022:
Valley Park:
$68,368
State:
$56,460
Change in median household income between 2000 and 2022:
Valley Park, Missouri:
+133.7%
Missouri:
+70.1%
Number of households with income < $10k:
Valley Park:
0.0% (0)
State:
5.1% (4,373)
Number of households with income $10k - 20k:
Valley Park:
9.7% (11)
State:
7.0% (6,006)
Number of households with income $20k - 30k:
Valley Park:
0.0% (0)
Missouri:
10.1% (8,643)
Number of households with income $30k - 40k:
Valley Park:
0.0% (0)
State:
11.7% (9,989)
Number of households with income $40k - 50k:
Valley Park:
0.0% (0)
State:
10.2% (8,742)
Number of households with income $50k - 60k:
Valley Park:
4.4% (5)
Missouri:
9.2% (7,818)
Number of households with income $60k - 75k:
Valley Park:
49.6% (56)
State:
11.2% (9,570)
Number of households with income $75k - 100k:
Valley Park:
0.0% (0)
State:
13.8% (11,820)
Number of households with income $100k - 125k:
Valley Park:
17.7% (20)
Missouri:
7.1% (6,070)
Number of households with income $125k - 150k:
Valley Park:
9.7% (11)
State:
5.7% (4,859)
Number of households with income $150k - 200k:
Valley Park:
0.0% (0)
State:
5.1% (4,323)
Number of households with income > $200k:
Valley Park:
8.8% (10)
State:
3.8% (3,228)
Aggregate household income in Valley Park in 2022: $9,291,693
Median family income in Valley Park in 2022:
Valley Park:
$118,175
Missouri:
$63,314
Number of families with income $50k - 60k:
Valley Park:
17.3% (7)
State:
7.8% (4,364)
Number of families with income $100k - 125k:
Valley Park:
51.0% (20)
State:
7.7% (4,334)
Number of families with income $125k - 150k:
Valley Park:
31.6% (13)
State:
6.4% (3,573)
Median per capita income in Valley Park in 2022:
Valley Park:
$23,036
State:
$23,656
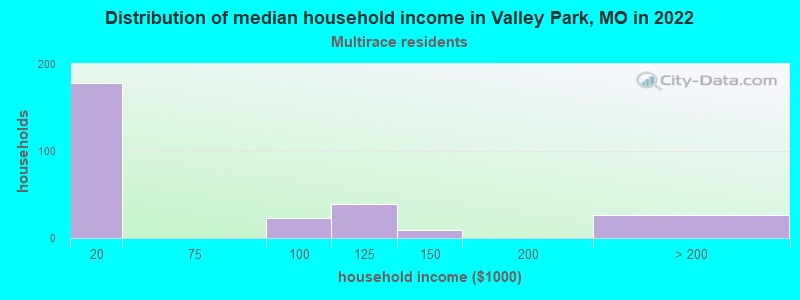
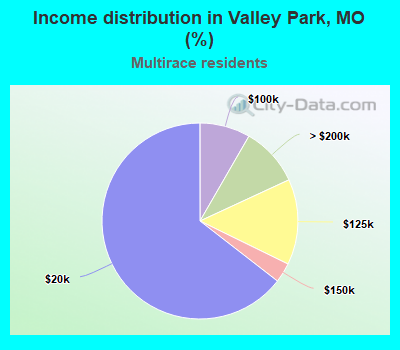
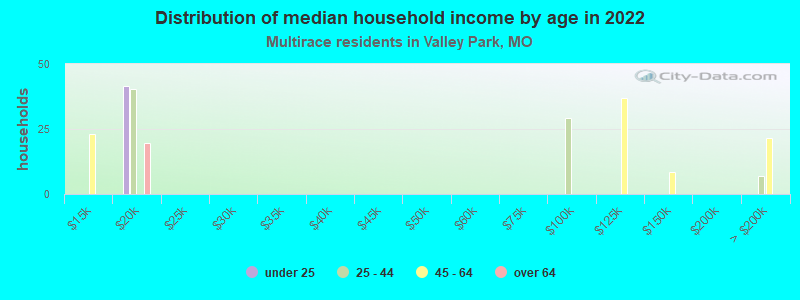
Income statistics for Multirace residents
Number of households with income < $10k:
Valley Park:
0.0% (0)
Missouri:
7.6% (10,901)
Number of households with income $10k - 20k:
Valley Park:
64.5% (178)
Missouri:
8.7% (12,480)
Number of households with income $20k - 30k:
Valley Park:
0.0% (0)
Missouri:
8.5% (12,233)
Number of households with income $30k - 40k:
Valley Park:
0.0% (0)
Missouri:
9.1% (13,060)
Number of households with income $40k - 50k:
Valley Park:
0.0% (0)
State:
9.4% (13,506)
Number of households with income $50k - 60k:
Valley Park:
0.0% (0)
State:
7.6% (11,002)
Number of households with income $60k - 75k:
Valley Park:
0.0% (0)
State:
9.7% (13,948)
Number of households with income $75k - 100k:
Valley Park:
8.3% (23)
Missouri:
12.3% (17,702)
Number of households with income $100k - 125k:
Valley Park:
14.1% (39)
State:
10.1% (14,590)
Number of households with income $125k - 150k:
Valley Park:
3.3% (9)
Missouri:
6.1% (8,758)
Number of households with income $150k - 200k:
Valley Park:
0.0% (0)
State:
5.9% (8,516)
Number of households with income > $200k:
Valley Park:
9.8% (27)
State:
5.2% (7,429)
Aggregate household income in Valley Park in 2022: $17,148,311
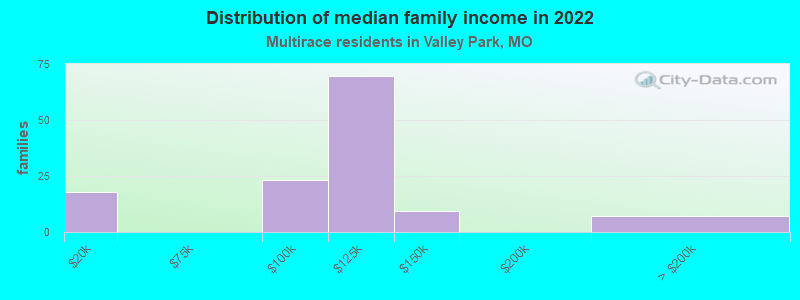
Median family income in Valley Park in 2022:
Valley Park:
$108,965
State:
$72,493
Number of families with income $10k - 20k:
Valley Park:
13.9% (18)
State:
3.6% (3,230)
Number of families with income $75k - 100k:
Valley Park:
18.1% (23)
State:
13.8% (12,321)
Number of families with income $100k - 125k:
Valley Park:
54.8% (70)
State:
11.8% (10,531)
Number of families with income $125k - 150k:
Valley Park:
7.4% (9)
Missouri:
7.4% (6,624)
Number of families with income > $200k:
Valley Park:
5.8% (7)
State:
7.5% (6,732)
Median non-family income in Valley Park in 2022:
Valley Park:
$14,992
State:
$34,026
Change in median non-family income between 2000 and 2022:
Valley Park, Missouri:
+139.9%
State:
+81.3%
Median per capita income in Valley Park in 2022:
Valley Park:
$22,518
Missouri:
$25,564
Change in median per capita income between 2000 and 2022:
Valley Park, Missouri:
+56.4%
State:
+108.9%
Income statistics for other residents
Median per capita income in Valley Park in 2022:
Valley Park:
$37,819
State:
$24,560
Change in median per capita income between 2000 and 2022:
Valley Park, Missouri:
+99.0%
State:
+115.4%
Discuss Valley Park, Missouri (MO) on our hugely popular Missouri forum.