Uxbridge, Massachusetts (MA) income map, earnings map, and wages data
The median household income in Uxbridge, MA in 2022 was $111,448, which was 15.2% greater than the median annual income of $94,488 across the entire state of Massachusetts. Compared to the median income of $61,855 in 2000 this represents an increase of 44.5%. The per capita income in 2022 was $47,847, which means an increase of 48.7% compared to 2000 when it was $24,540.
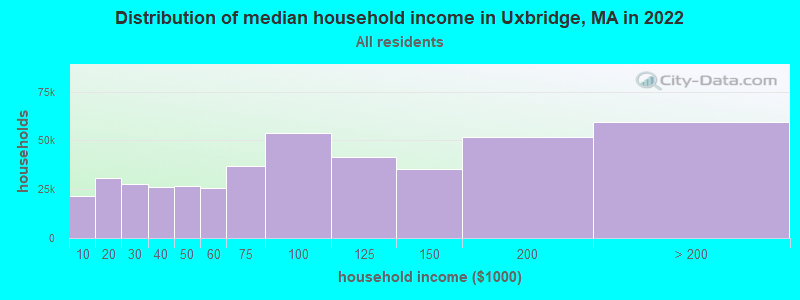
Income statistics for all residents
Median household income in Uxbridge, MA in 2022:| Uxbridge: | $111,449 |
| Massachusetts: | $94,488 |
Change in median household income between 2000 and 2022:| Uxbridge, Massachusetts: | +80.2% |
| Massachusetts: | +87.1% |
Number of households with income < $10k:| Uxbridge: | 4.9% (21,439) |
| State: | 5.2% (146,170) |
Number of households with income $10k - 20k:| Uxbridge: | 7.0% (30,587) |
| State: | 6.4% (180,001) |
Number of households with income $20k - 30k:| Uxbridge: | 6.4% (27,858) |
| State: | 5.6% (156,667) |
Number of households with income $30k - 40k:| Uxbridge: | 5.9% (25,928) |
| State: | 5.6% (157,168) |
Number of households with income $40k - 50k:| Uxbridge: | 6.1% (26,552) |
| State: | 5.4% (151,455) |
Number of households with income $50k - 60k:| Uxbridge: | 5.8% (25,422) |
| State: | 5.1% (142,726) |
Number of households with income $60k - 75k:| Uxbridge: | 8.4% (36,892) |
| Massachusetts: | 7.6% (212,203) |
Number of households with income $75k - 100k:| Uxbridge: | 12.3% (53,657) |
| State: | 11.3% (317,064) |
Number of households with income $100k - 125k:| Uxbridge: | 9.5% (41,649) |
| Massachusetts: | 9.7% (270,603) |
Number of households with income $125k - 150k:| Uxbridge: | 8.1% (35,589) |
| State: | 8.0% (223,140) |
Number of households with income $150k - 200k:| Uxbridge: | 11.9% (51,834) |
| State: | 11.0% (308,695) |
Number of households with income > $200k:| Uxbridge: | 13.6% (59,414) |
| Massachusetts: | 19.0% (531,884) |
Aggregate household income in Uxbridge in 2022: $4,835,582,989
Median family income in Uxbridge in 2022:| Uxbridge: | $128,926 |
| Massachusetts: | $120,263 |
Median non-family income in Uxbridge in 2022:| Uxbridge: | $51,187 |
| State: | $55,979 |
Change in median non-family income between 2000 and 2022:| Uxbridge, Massachusetts: | +85.7% |
| State: | +88.0% |
Median per capita income in Uxbridge in 2022:| Uxbridge: | $47,848 |
| Massachusetts: | $54,025 |
Change in median per capita income between 2000 and 2022:| Uxbridge, Massachusetts: | +95.0% |
| State: | +108.2% |
Income statistics for White residents
Median household income in Uxbridge, MA in 2022:| Uxbridge: | $114,989 |
| Massachusetts: | $101,391 |
Change in median household income between 2000 and 2022:| Uxbridge, Massachusetts: | +85.1% |
| State: | +93.3% |
Number of households with income < $10k:| Uxbridge: | 4.6% (15,359) |
| State: | 4.4% (91,120) |
Number of households with income $10k - 20k:| Uxbridge: | 6.5% (21,961) |
| State: | 5.9% (122,055) |
Number of households with income $20k - 30k:| Uxbridge: | 6.1% (20,365) |
| State: | 5.1% (105,311) |
Number of households with income $30k - 40k:| Uxbridge: | 5.5% (18,376) |
| Massachusetts: | 5.3% (110,239) |
Number of households with income $40k - 50k:| Uxbridge: | 5.6% (18,815) |
| Massachusetts: | 5.0% (104,636) |
Number of households with income $50k - 60k:| Uxbridge: | 5.4% (18,244) |
| State: | 4.8% (99,486) |
Number of households with income $60k - 75k:| Uxbridge: | 8.4% (28,253) |
| Massachusetts: | 7.5% (155,124) |
Number of households with income $75k - 100k:| Uxbridge: | 12.2% (41,059) |
| State: | 11.4% (236,252) |
Number of households with income $100k - 125k:| Uxbridge: | 10.1% (34,120) |
| State: | 9.9% (204,731) |
Number of households with income $125k - 150k:| Uxbridge: | 8.4% (28,139) |
| State: | 8.5% (175,324) |
Number of households with income $150k - 200k:| Uxbridge: | 12.5% (41,920) |
| Massachusetts: | 11.7% (242,980) |
Number of households with income > $200k:| Uxbridge: | 14.7% (49,583) |
| State: | 20.5% (425,966) |
Aggregate household income in Uxbridge in 2022: $3,952,373,782
Median family income in Uxbridge in 2022:| Uxbridge: | $135,456 |
| Massachusetts: | $133,153 |
Number of families with income < $10k:| Uxbridge: | 1.2% (31) |
| State: | 2.0% (25,038) |
Number of families with income $10k - 20k:| Uxbridge: | 1.8% (50) |
| Massachusetts: | 2.1% (26,403) |
Number of families with income $20k - 30k:| Uxbridge: | 2.3% (62) |
| Massachusetts: | 2.6% (32,525) |
Number of families with income $30k - 40k:| Uxbridge: | 4.5% (123) |
| State: | 3.9% (48,079) |
Number of families with income $40k - 50k:| Uxbridge: | 3.5% (95) |
| State: | 3.8% (46,908) |
Number of families with income $50k - 60k:| Uxbridge: | 4.7% (126) |
| State: | 3.8% (46,476) |
Number of families with income $60k - 75k:| Uxbridge: | 9.7% (263) |
| State: | 6.4% (79,040) |
Number of families with income $75k - 100k:| Uxbridge: | 17.5% (472) |
| State: | 11.1% (137,395) |
Number of families with income $100k - 125k:| Uxbridge: | 16.1% (436) |
| Massachusetts: | 11.1% (136,771) |
Number of families with income $125k - 150k:| Uxbridge: | 11.2% (303) |
| State: | 10.0% (123,709) |
Number of families with income $150k - 200k:| Uxbridge: | 11.7% (318) |
| Massachusetts: | 14.7% (181,602) |
Number of families with income > $200k:| Uxbridge: | 15.8% (426) |
| Massachusetts: | 28.5% (351,887) |
Median non-family income in Uxbridge in 2022:| Uxbridge: | $52,864 |
| State: | $59,323 |
Change in median non-family income between 2000 and 2022:| Uxbridge, Massachusetts: | +92.0% |
| State: | +94.3% |
Median per capita income in Uxbridge in 2022:| Uxbridge: | $50,538 |
| Massachusetts: | $60,804 |
Change in median per capita income between 2000 and 2022:| Uxbridge, Massachusetts: | +105.3% |
| State: | +118.7% |
Income statistics for Black or African American residents
Number of households with income < $10k:| Uxbridge: | 7.3% (794) |
| Massachusetts: | 9.1% (15,797) |
Number of households with income $10k - 20k:| Uxbridge: | 11.9% (1,297) |
| State: | 9.4% (16,267) |
Number of households with income $20k - 30k:| Uxbridge: | 9.8% (1,069) |
| Massachusetts: | 7.8% (13,520) |
Number of households with income $30k - 40k:| Uxbridge: | 3.3% (354) |
| State: | 8.3% (14,412) |
Number of households with income $40k - 50k:| Uxbridge: | 13.5% (1,469) |
| Massachusetts: | 7.9% (13,790) |
Number of households with income $50k - 60k:| Uxbridge: | 5.8% (628) |
| Massachusetts: | 5.8% (10,041) |
Number of households with income $60k - 75k:| Uxbridge: | 10.7% (1,169) |
| State: | 8.5% (14,822) |
Number of households with income $75k - 100k:| Uxbridge: | 13.0% (1,419) |
| State: | 11.0% (19,122) |
Number of households with income $100k - 125k:| Uxbridge: | 7.5% (819) |
| State: | 8.4% (14,575) |
Number of households with income $125k - 150k:| Uxbridge: | 5.0% (541) |
| State: | 6.0% (10,429) |
Number of households with income $150k - 200k:| Uxbridge: | 7.2% (789) |
| Massachusetts: | 7.2% (12,539) |
Number of households with income > $200k:| Uxbridge: | 4.9% (538) |
| State: | 10.5% (18,185) |
Median per capita income in Uxbridge in 2022:| Uxbridge: | $19,901 |
| State: | $33,524 |
Change in median per capita income between 2000 and 2022:| Uxbridge, Massachusetts: | +95.7% |
| Massachusetts: | +109.4% |
Income statistics for Asian residents
Median household income in Uxbridge, MA in 2022:| Uxbridge: | $184,697 |
| State: | $117,855 |
Change in median household income between 2000 and 2022:| Uxbridge, Massachusetts: | +149.6% |
| Massachusetts: | +129.9% |
Number of households with income < $10k:| Uxbridge: | 5.7% (1,171) |
| Massachusetts: | 6.8% (11,982) |
Number of households with income $10k - 20k:| Uxbridge: | 5.8% (1,177) |
| State: | 4.8% (8,376) |
Number of households with income $20k - 30k:| Uxbridge: | 1.9% (389) |
| State: | 3.7% (6,558) |
Number of households with income $30k - 40k:| Uxbridge: | 3.5% (724) |
| State: | 3.3% (5,748) |
Number of households with income $40k - 50k:| Uxbridge: | 4.9% (1,006) |
| State: | 4.1% (7,192) |
Number of households with income $50k - 60k:| Uxbridge: | 3.5% (716) |
| State: | 5.0% (8,734) |
Number of households with income $60k - 75k:| Uxbridge: | 4.3% (886) |
| State: | 5.8% (10,203) |
Number of households with income $75k - 100k:| Uxbridge: | 6.1% (1,245) |
| State: | 8.6% (15,154) |
Number of households with income $100k - 125k:| Uxbridge: | 9.7% (1,991) |
| Massachusetts: | 10.8% (18,942) |
Number of households with income $125k - 150k:| Uxbridge: | 8.1% (1,649) |
| Massachusetts: | 8.0% (14,037) |
Number of households with income $150k - 200k:| Uxbridge: | 21.1% (4,309) |
| State: | 12.5% (21,856) |
Number of households with income > $200k:| Uxbridge: | 25.4% (5,185) |
| State: | 26.6% (46,694) |
Aggregate household income in Uxbridge in 2022: $7,668,730
Median family income in Uxbridge in 2022:| Uxbridge: | $198,227 |
| State: | $140,113 |
Number of families with income $30k - 40k:| Uxbridge: | 29.1% (4) |
| State: | 2.8% (3,234) |
Number of families with income $60k - 75k:| Uxbridge: | 31.0% (4) |
| Massachusetts: | 6.1% (7,105) |
Number of families with income $75k - 100k:| Uxbridge: | 39.9% (5) |
| State: | 8.5% (10,022) |
Median per capita income in Uxbridge in 2022:| Uxbridge: | $62,908 |
| Massachusetts: | $58,900 |
Income statistics for Hispanic or Latino residents
Median household income in Uxbridge, MA in 2022:| Uxbridge: | $56,708 |
| Massachusetts: | $61,523 |
Change in median household income between 2000 and 2022:| Uxbridge, Massachusetts: | +116.0% |
| State: | +125.4% |
Number of households with income < $10k:| Uxbridge: | 8.1% (2,902) |
| Massachusetts: | 8.8% (25,307) |
Number of households with income $10k - 20k:| Uxbridge: | 10.5% (3,733) |
| Massachusetts: | 10.0% (28,653) |
Number of households with income $20k - 30k:| Uxbridge: | 10.3% (3,692) |
| Massachusetts: | 8.8% (25,189) |
Number of households with income $30k - 40k:| Uxbridge: | 9.5% (3,395) |
| State: | 7.2% (20,822) |
Number of households with income $40k - 50k:| Uxbridge: | 7.1% (2,539) |
| State: | 7.2% (20,817) |
Number of households with income $50k - 60k:| Uxbridge: | 8.0% (2,852) |
| State: | 6.5% (18,748) |
Number of households with income $60k - 75k:| Uxbridge: | 11.1% (3,952) |
| Massachusetts: | 8.8% (25,390) |
Number of households with income $75k - 100k:| Uxbridge: | 14.1% (5,028) |
| State: | 12.0% (34,488) |
Number of households with income $100k - 125k:| Uxbridge: | 5.7% (2,030) |
| Massachusetts: | 8.6% (24,599) |
Number of households with income $125k - 150k:| Uxbridge: | 8.8% (3,153) |
| State: | 6.2% (17,743) |
Number of households with income $150k - 200k:| Uxbridge: | 3.6% (1,268) |
| State: | 7.3% (21,017) |
Number of households with income > $200k:| Uxbridge: | 3.2% (1,136) |
| State: | 8.6% (24,606) |
Aggregate household income in Uxbridge in 2022: $4,389,610
Median family income in Uxbridge in 2022:| Uxbridge: | $152,019 |
| State: | $66,072 |
Number of families with income < $10k:| Uxbridge: | 5.1% (20) |
| Massachusetts: | 6.2% (12,456) |
Number of families with income $10k - 20k:| Uxbridge: | 3.6% (14) |
| State: | 6.0% (12,071) |
Number of families with income $20k - 30k:| Uxbridge: | 7.0% (27) |
| State: | 10.1% (20,376) |
Number of families with income $30k - 40k:| Uxbridge: | 10.1% (39) |
| State: | 8.2% (16,470) |
Number of families with income $40k - 50k:| Uxbridge: | 8.4% (33) |
| State: | 7.4% (14,829) |
Number of families with income $50k - 60k:| Uxbridge: | 11.1% (43) |
| State: | 7.3% (14,643) |
Number of families with income $60k - 75k:| Uxbridge: | 11.5% (44) |
| State: | 10.6% (21,252) |
Number of families with income $75k - 100k:| Uxbridge: | 18.4% (71) |
| State: | 12.0% (24,088) |
Number of families with income $100k - 125k:| Uxbridge: | 7.3% (28) |
| Massachusetts: | 8.9% (17,954) |
Number of families with income $125k - 150k:| Uxbridge: | 11.7% (45) |
| Massachusetts: | 6.9% (13,837) |
Number of families with income $150k - 200k:| Uxbridge: | 2.6% (10) |
| State: | 7.3% (14,683) |
Number of families with income > $200k:| Uxbridge: | 3.2% (12) |
| Massachusetts: | 9.3% (18,741) |
Median non-family income in Uxbridge in 2022:| Uxbridge: | $49,455 |
| State: | $37,563 |
Change in median non-family income between 2000 and 2022:| Uxbridge, Massachusetts: | +95.9% |
| State: | +115.0% |
Median per capita income in Uxbridge in 2022:| Uxbridge: | $35,212 |
| State: | $28,993 |
Change in median per capita income between 2000 and 2022:| Uxbridge, Massachusetts: | +110.9% |
| State: | +142.4% |
Income statistics for American Indian and Alaska Native residents
Median household income in Uxbridge, MA in 2022:| Uxbridge: | $262,964 |
| State: | $87,730 |
Number of households with income < $10k:| Uxbridge: | 6.6% (986) |
| State: | 6.6% (451) |
Number of households with income $10k - 20k:| Uxbridge: | 7.0% (1,041) |
| State: | 7.0% (476) |
Number of households with income $20k - 30k:| Uxbridge: | 2.8% (419) |
| Massachusetts: | 2.8% (192) |
Number of households with income $30k - 40k:| Uxbridge: | 3.2% (477) |
| State: | 3.2% (218) |
Number of households with income $40k - 50k:| Uxbridge: | 2.9% (435) |
| Massachusetts: | 2.9% (199) |
Number of households with income $50k - 60k:| Uxbridge: | 9.9% (1,480) |
| State: | 9.9% (677) |
Number of households with income $60k - 75k:| Uxbridge: | 11.5% (1,708) |
| State: | 11.5% (781) |
Number of households with income $75k - 100k:| Uxbridge: | 9.2% (1,375) |
| Massachusetts: | 9.2% (629) |
Number of households with income $100k - 125k:| Uxbridge: | 6.0% (888) |
| State: | 6.0% (406) |
Number of households with income $125k - 150k:| Uxbridge: | 13.5% (2,014) |
| Massachusetts: | 13.5% (921) |
Number of households with income $150k - 200k:| Uxbridge: | 12.6% (1,878) |
| Massachusetts: | 12.6% (859) |
Number of households with income > $200k:| Uxbridge: | 14.7% (2,193) |
| State: | 14.7% (1,003) |
Aggregate household income in Uxbridge in 2022: $1,587,024
Median per capita income in Uxbridge in 2022:| Uxbridge: | $97,184 |
| State: | $39,434 |
Change in median per capita income between 2000 and 2022:| Uxbridge, Massachusetts: | +80.0% |
| State: | +148.2% |
Income statistics for Multirace residents
Median household income in Uxbridge, MA in 2022:| Uxbridge: | $55,705 |
| State: | $71,552 |
Change in median household income between 2000 and 2022:| Uxbridge, Massachusetts: | +84.7% |
| Massachusetts: | +109.0% |
Number of households with income < $10k:| Uxbridge: | 7.4% (2,074) |
| Massachusetts: | 6.6% (15,127) |
Number of households with income $10k - 20k:| Uxbridge: | 10.3% (2,882) |
| State: | 9.2% (21,158) |
Number of households with income $20k - 30k:| Uxbridge: | 10.2% (2,850) |
| State: | 7.8% (18,016) |
Number of households with income $30k - 40k:| Uxbridge: | 11.3% (3,154) |
| State: | 7.9% (18,260) |
Number of households with income $40k - 50k:| Uxbridge: | 6.2% (1,730) |
| State: | 5.6% (13,027) |
Number of households with income $50k - 60k:| Uxbridge: | 8.7% (2,436) |
| State: | 5.6% (12,909) |
Number of households with income $60k - 75k:| Uxbridge: | 8.2% (2,279) |
| State: | 9.0% (20,800) |
Number of households with income $75k - 100k:| Uxbridge: | 13.5% (3,766) |
| State: | 12.1% (27,875) |
Number of households with income $100k - 125k:| Uxbridge: | 6.2% (1,723) |
| State: | 8.1% (18,754) |
Number of households with income $125k - 150k:| Uxbridge: | 6.4% (1,793) |
| State: | 6.8% (15,621) |
Number of households with income $150k - 200k:| Uxbridge: | 5.9% (1,654) |
| State: | 9.4% (21,618) |
Number of households with income > $200k:| Uxbridge: | 5.6% (1,555) |
| State: | 12.0% (27,592) |
Aggregate household income in Uxbridge in 2022: $7,460,370
Median family income in Uxbridge in 2022:| Uxbridge: | $54,564 |
| Massachusetts: | $78,380 |
Number of families with income < $10k:| Uxbridge: | 45.4% (15) |
| Massachusetts: | 4.5% (7,017) |
Number of families with income $30k - 40k:| Uxbridge: | 54.6% (18) |
| Massachusetts: | 8.2% (12,705) |
Median non-family income in Uxbridge in 2022:| Uxbridge: | $47,995 |
| State: | $42,253 |
Change in median non-family income between 2000 and 2022:| Uxbridge, Massachusetts: | +60.0% |
| Massachusetts: | +93.7% |
Median per capita income in Uxbridge in 2022:| Uxbridge: | $20,452 |
| State: | $34,029 |
Change in median per capita income between 2000 and 2022:| Uxbridge, Massachusetts: | +104.0% |
| State: | +132.1% |
Income statistics for other residents
Aggregate household income in Uxbridge in 2022: $580,537
Median non-family income in Uxbridge in 2022:| Uxbridge: | $104,103 |
| State: | $36,127 |
Median per capita income in Uxbridge in 2022:| Uxbridge: | $64,461 |
| State: | $30,797 |