Upper San Gabriel Valley, California (CA) income map, earnings map, and wages data
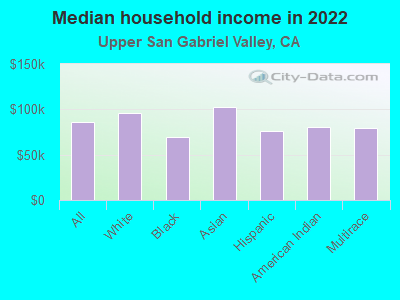
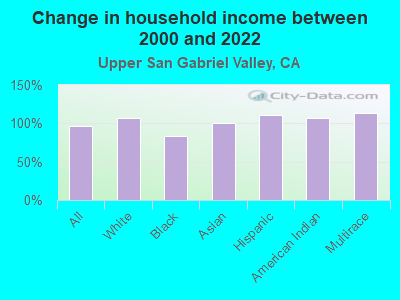
The median household income in Upper San Gabriel Valley, CA in 2022 was $85,690, which was 6.8% less than the median annual income of $91,551 across the entire state of California. Compared to the median income of $43,812 in 2000 this represents an increase of 48.9%. The per capita income in 2022 was $37,744, which means an increase of 52.1% compared to 2000 when it was $18,083.
Income statistics for all residents
Median household income in Upper San Gabriel Valley, CA in 2022:| Upper San Gabriel Valley: | $85,690 |
| State: | $91,551 |
Change in median household income between 2000 and 2022:| Upper San Gabriel Valley, California: | +95.6% |
| California: | +92.8% |
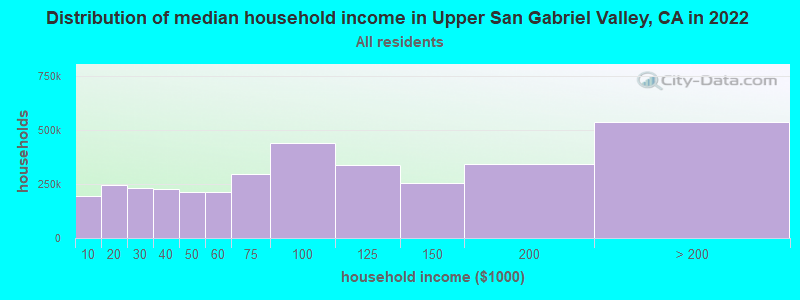
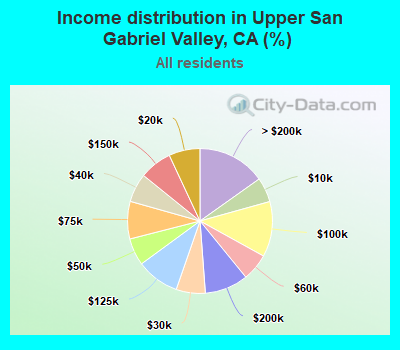
Number of households with income < $10k:| Upper San Gabriel Valley: | 5.5% (195,269) |
| State: | 4.8% (654,370) |
Number of households with income $10k - 20k:| Upper San Gabriel Valley: | 6.9% (246,158) |
| State: | 5.8% (789,493) |
Number of households with income $20k - 30k:| Upper San Gabriel Valley: | 6.5% (230,953) |
| State: | 5.7% (778,318) |
Number of households with income $30k - 40k:| Upper San Gabriel Valley: | 6.4% (227,913) |
| California: | 5.8% (783,170) |
Number of households with income $40k - 50k:| Upper San Gabriel Valley: | 6.1% (215,487) |
| California: | 5.8% (781,352) |
Number of households with income $50k - 60k:| Upper San Gabriel Valley: | 6.1% (215,660) |
| State: | 5.6% (760,175) |
Number of households with income $60k - 75k:| Upper San Gabriel Valley: | 8.4% (297,069) |
| California: | 8.2% (1,104,699) |
Number of households with income $75k - 100k:| Upper San Gabriel Valley: | 12.4% (438,481) |
| State: | 12.0% (1,627,633) |
Number of households with income $100k - 125k:| Upper San Gabriel Valley: | 9.6% (340,654) |
| State: | 10.0% (1,358,619) |
Number of households with income $125k - 150k:| Upper San Gabriel Valley: | 7.2% (256,986) |
| State: | 7.6% (1,027,455) |
Number of households with income $150k - 200k:| Upper San Gabriel Valley: | 9.7% (344,257) |
| California: | 10.6% (1,439,811) |
Number of households with income > $200k:| Upper San Gabriel Valley: | 15.2% (538,241) |
| State: | 18.0% (2,445,491) |
Aggregate household income in Upper San Gabriel Valley in 2022: $410,815,007,900
Median family income in Upper San Gabriel Valley in 2022:| Upper San Gabriel Valley: | $93,243 |
| State: | $104,823 |
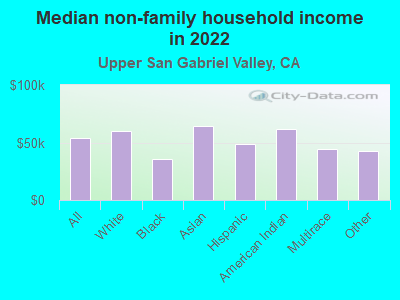
Median non-family income in Upper San Gabriel Valley in 2022:| Upper San Gabriel Valley: | $53,662 |
| State: | $59,348 |
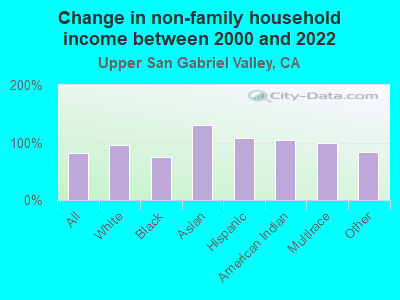
Change in median non-family income between 2000 and 2022:| Upper San Gabriel Valley, California: | +81.8% |
| California: | +85.3% |
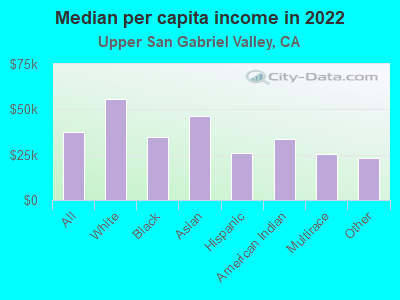
Median per capita income in Upper San Gabriel Valley in 2022:| Upper San Gabriel Valley: | $37,744 |
| State: | $46,661 |
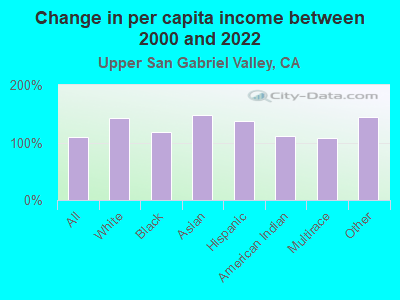
Change in median per capita income between 2000 and 2022:| Upper San Gabriel Valley, California: | +108.7% |
| State: | +105.5% |
Income statistics for White residents
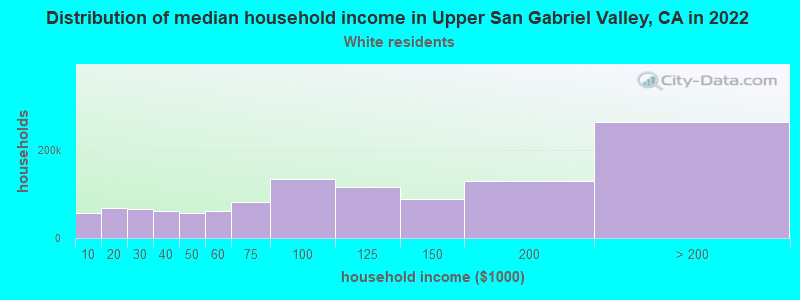
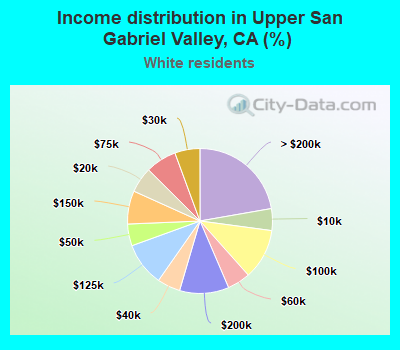
Median household income in Upper San Gabriel Valley, CA in 2022:| Upper San Gabriel Valley: | $95,479 |
| State: | $100,917 |
Change in median household income between 2000 and 2022:| Upper San Gabriel Valley, California: | +107.4% |
| State: | +96.8% |
Number of households with income < $10k:| Upper San Gabriel Valley: | 4.9% (57,656) |
| State: | 4.4% (284,109) |
Number of households with income $10k - 20k:| Upper San Gabriel Valley: | 5.7% (67,770) |
| State: | 5.3% (340,330) |
Number of households with income $20k - 30k:| Upper San Gabriel Valley: | 5.6% (66,515) |
| California: | 5.3% (343,145) |
Number of households with income $30k - 40k:| Upper San Gabriel Valley: | 5.2% (61,179) |
| State: | 5.1% (330,146) |
Number of households with income $40k - 50k:| Upper San Gabriel Valley: | 4.9% (57,875) |
| California: | 5.2% (335,310) |
Number of households with income $50k - 60k:| Upper San Gabriel Valley: | 5.1% (60,978) |
| State: | 5.1% (326,299) |
Number of households with income $60k - 75k:| Upper San Gabriel Valley: | 6.9% (82,161) |
| State: | 7.6% (487,640) |
Number of households with income $75k - 100k:| Upper San Gabriel Valley: | 11.3% (133,918) |
| State: | 11.5% (736,578) |
Number of households with income $100k - 125k:| Upper San Gabriel Valley: | 9.8% (115,736) |
| State: | 10.1% (648,782) |
Number of households with income $125k - 150k:| Upper San Gabriel Valley: | 7.4% (87,977) |
| State: | 7.8% (499,671) |
Number of households with income $150k - 200k:| Upper San Gabriel Valley: | 11.0% (130,529) |
| California: | 11.4% (729,603) |
Number of households with income > $200k:| Upper San Gabriel Valley: | 22.3% (264,186) |
| State: | 21.2% (1,364,246) |
Aggregate household income in Upper San Gabriel Valley in 2022: $188,475,940,600
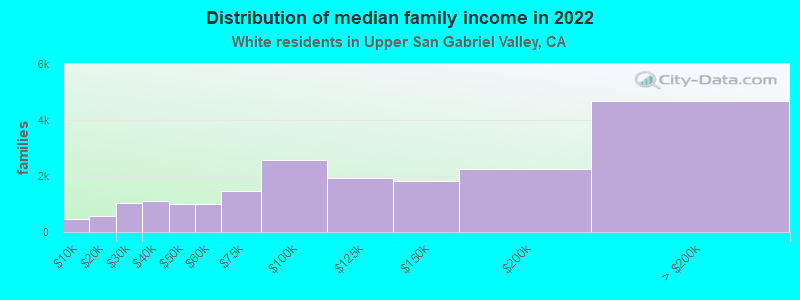
Median family income in Upper San Gabriel Valley in 2022:| Upper San Gabriel Valley: | $121,615 |
| California: | $125,379 |
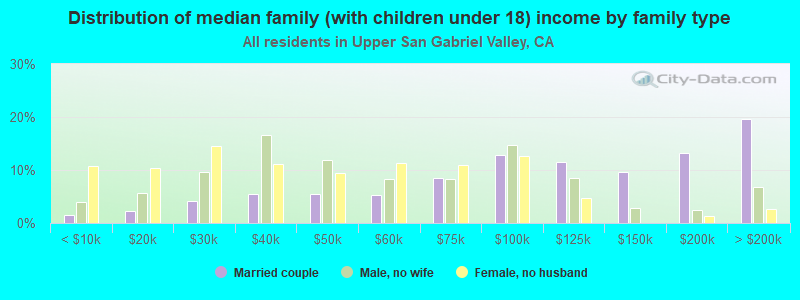
Number of families with income < $10k:| Upper San Gabriel Valley: | 2.3% (455) |
| State: | 2.2% (87,079) |
Number of families with income $10k - 20k:| Upper San Gabriel Valley: | 2.8% (556) |
| State: | 2.5% (97,716) |
Number of families with income $20k - 30k:| Upper San Gabriel Valley: | 5.2% (1,031) |
| State: | 3.5% (137,295) |
Number of families with income $30k - 40k:| Upper San Gabriel Valley: | 5.5% (1,090) |
| State: | 3.9% (152,947) |
Number of families with income $40k - 50k:| Upper San Gabriel Valley: | 5.1% (1,010) |
| State: | 4.3% (169,197) |
Number of families with income $50k - 60k:| Upper San Gabriel Valley: | 5.1% (1,015) |
| California: | 4.5% (176,192) |
Number of families with income $60k - 75k:| Upper San Gabriel Valley: | 7.5% (1,482) |
| State: | 7.0% (274,752) |
Number of families with income $75k - 100k:| Upper San Gabriel Valley: | 13.0% (2,576) |
| State: | 11.3% (445,632) |
Number of families with income $100k - 125k:| Upper San Gabriel Valley: | 9.7% (1,928) |
| State: | 10.7% (423,630) |
Number of families with income $125k - 150k:| Upper San Gabriel Valley: | 9.1% (1,819) |
| State: | 9.1% (357,408) |
Number of families with income $150k - 200k:| Upper San Gabriel Valley: | 11.3% (2,257) |
| State: | 13.5% (532,693) |
Number of families with income > $200k:| Upper San Gabriel Valley: | 23.5% (4,670) |
| California: | 27.6% (1,086,948) |
Median non-family income in Upper San Gabriel Valley in 2022:| Upper San Gabriel Valley: | $60,376 |
| California: | $62,819 |
Change in median non-family income between 2000 and 2022:| Upper San Gabriel Valley, California: | +96.2% |
| State: | +84.4% |
Median per capita income in Upper San Gabriel Valley in 2022:| Upper San Gabriel Valley: | $55,585 |
| State: | $61,706 |
Change in median per capita income between 2000 and 2022:| Upper San Gabriel Valley, California: | +142.5% |
| State: | +122.7% |
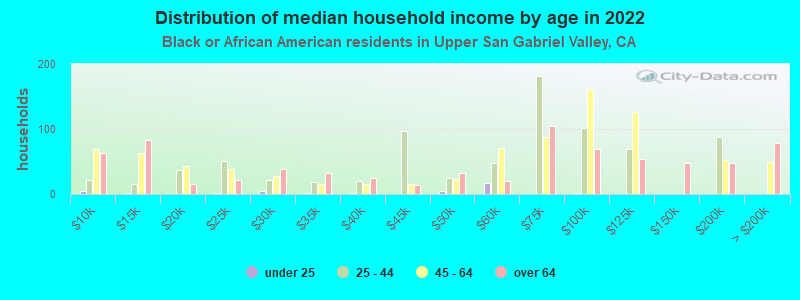
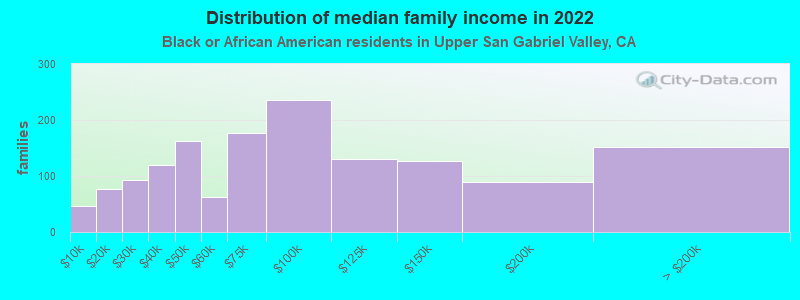
Income statistics for Black or African American residents
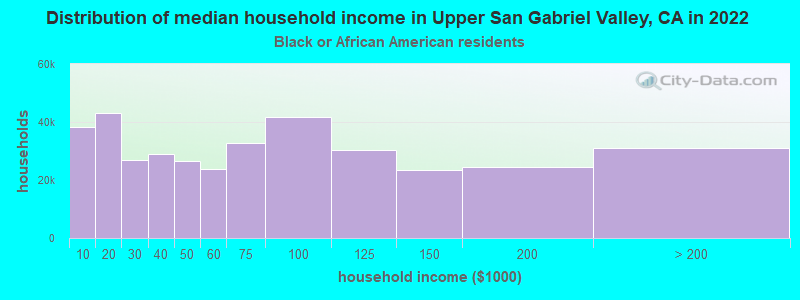
Median household income in Upper San Gabriel Valley, CA in 2022:| Upper San Gabriel Valley: | $69,829 |
| State: | $63,268 |
Change in median household income between 2000 and 2022:| Upper San Gabriel Valley, California: | +83.6% |
| California: | +81.0% |
Number of households with income < $10k:| Upper San Gabriel Valley: | 10.3% (38,216) |
| State: | 9.0% (73,219) |
Number of households with income $10k - 20k:| Upper San Gabriel Valley: | 11.6% (43,053) |
| State: | 10.6% (86,666) |
Number of households with income $20k - 30k:| Upper San Gabriel Valley: | 7.3% (26,984) |
| California: | 7.1% (57,719) |
Number of households with income $30k - 40k:| Upper San Gabriel Valley: | 7.8% (29,118) |
| State: | 7.2% (58,714) |
Number of households with income $40k - 50k:| Upper San Gabriel Valley: | 7.1% (26,412) |
| California: | 7.1% (58,075) |
Number of households with income $50k - 60k:| Upper San Gabriel Valley: | 6.4% (23,925) |
| California: | 6.8% (55,229) |
Number of households with income $60k - 75k:| Upper San Gabriel Valley: | 8.9% (32,929) |
| State: | 8.8% (71,895) |
Number of households with income $75k - 100k:| Upper San Gabriel Valley: | 11.2% (41,815) |
| State: | 11.9% (96,893) |
Number of households with income $100k - 125k:| Upper San Gabriel Valley: | 8.1% (30,258) |
| State: | 8.7% (70,729) |
Number of households with income $125k - 150k:| Upper San Gabriel Valley: | 6.4% (23,619) |
| State: | 6.3% (51,211) |
Number of households with income $150k - 200k:| Upper San Gabriel Valley: | 6.5% (24,319) |
| State: | 7.2% (58,687) |
Number of households with income > $200k:| Upper San Gabriel Valley: | 8.4% (31,144) |
| State: | 9.3% (75,487) |
Aggregate household income in Upper San Gabriel Valley in 2022: $1,589,942,730
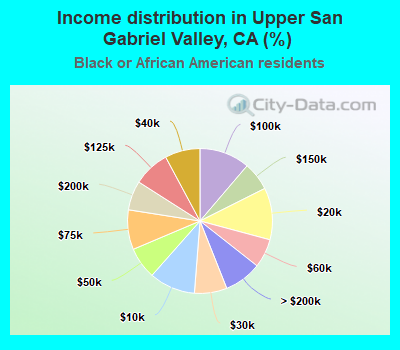
Median family income in Upper San Gabriel Valley in 2022:| Upper San Gabriel Valley: | $84,906 |
| State: | $77,263 |
Number of families with income < $10k:| Upper San Gabriel Valley: | 3.1% (46) |
| State: | 5.9% (27,037) |
Number of families with income $10k - 20k:| Upper San Gabriel Valley: | 5.2% (76) |
| California: | 6.4% (29,505) |
Number of families with income $20k - 30k:| Upper San Gabriel Valley: | 6.3% (93) |
| State: | 5.6% (25,755) |
Number of families with income $30k - 40k:| Upper San Gabriel Valley: | 8.1% (119) |
| California: | 6.8% (30,948) |
Number of families with income $40k - 50k:| Upper San Gabriel Valley: | 11.1% (163) |
| California: | 8.3% (38,171) |
Number of families with income $50k - 60k:| Upper San Gabriel Valley: | 4.3% (63) |
| State: | 7.0% (31,860) |
Number of families with income $60k - 75k:| Upper San Gabriel Valley: | 12.0% (176) |
| State: | 8.7% (40,021) |
Number of families with income $75k - 100k:| Upper San Gabriel Valley: | 16.0% (235) |
| California: | 12.4% (56,846) |
Number of families with income $100k - 125k:| Upper San Gabriel Valley: | 8.8% (130) |
| State: | 9.8% (44,911) |
Number of families with income $125k - 150k:| Upper San Gabriel Valley: | 8.6% (126) |
| State: | 7.5% (34,434) |
Number of families with income $150k - 200k:| Upper San Gabriel Valley: | 6.1% (90) |
| State: | 9.3% (42,807) |
Number of families with income > $200k:| Upper San Gabriel Valley: | 10.3% (151) |
| State: | 12.2% (56,093) |
Median non-family income in Upper San Gabriel Valley in 2022:| Upper San Gabriel Valley: | $35,598 |
| State: | $41,942 |
Change in median non-family income between 2000 and 2022:| Upper San Gabriel Valley, California: | +73.5% |
| California: | +72.0% |
Median per capita income in Upper San Gabriel Valley in 2022:| Upper San Gabriel Valley: | $34,898 |
| State: | $36,708 |
Change in median per capita income between 2000 and 2022:| Upper San Gabriel Valley, California: | +117.9% |
| California: | +110.4% |
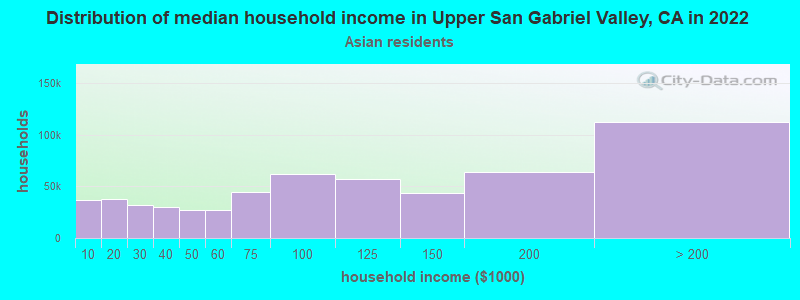
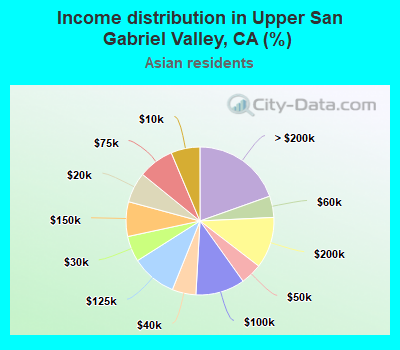
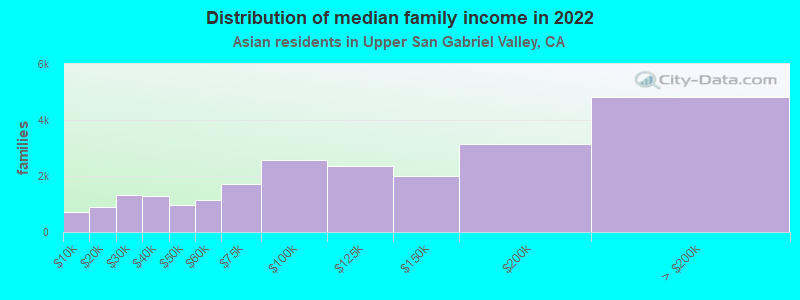
Income statistics for Asian residents
Median household income in Upper San Gabriel Valley, CA in 2022:| Upper San Gabriel Valley: | $102,769 |
| State: | $119,861 |
Change in median household income between 2000 and 2022:| Upper San Gabriel Valley, California: | +101.1% |
| California: | +116.5% |
Number of households with income < $10k:| Upper San Gabriel Valley: | 6.3% (36,395) |
| State: | 5.1% (106,273) |
Number of households with income $10k - 20k:| Upper San Gabriel Valley: | 6.6% (38,170) |
| State: | 4.9% (101,815) |
Number of households with income $20k - 30k:| Upper San Gabriel Valley: | 5.6% (32,290) |
| State: | 4.6% (94,414) |
Number of households with income $30k - 40k:| Upper San Gabriel Valley: | 5.2% (29,873) |
| California: | 4.1% (84,491) |
Number of households with income $40k - 50k:| Upper San Gabriel Valley: | 4.7% (26,977) |
| California: | 4.0% (81,758) |
Number of households with income $50k - 60k:| Upper San Gabriel Valley: | 4.7% (26,809) |
| California: | 3.9% (80,971) |
Number of households with income $60k - 75k:| Upper San Gabriel Valley: | 7.8% (44,876) |
| State: | 6.0% (124,194) |
Number of households with income $75k - 100k:| Upper San Gabriel Valley: | 10.8% (61,775) |
| State: | 9.7% (200,337) |
Number of households with income $100k - 125k:| Upper San Gabriel Valley: | 9.9% (56,977) |
| California: | 9.4% (193,488) |
Number of households with income $125k - 150k:| Upper San Gabriel Valley: | 7.6% (43,541) |
| State: | 7.7% (158,253) |
Number of households with income $150k - 200k:| Upper San Gabriel Valley: | 11.2% (64,364) |
| California: | 12.2% (252,139) |
Number of households with income > $200k:| Upper San Gabriel Valley: | 19.6% (112,454) |
| California: | 28.4% (586,641) |
Aggregate household income in Upper San Gabriel Valley in 2022: $45,075,016,643
Median family income in Upper San Gabriel Valley in 2022:| Upper San Gabriel Valley: | $109,687 |
| State: | $136,040 |
Number of families with income < $10k:| Upper San Gabriel Valley: | 3.1% (722) |
| California: | 2.8% (42,046) |
Number of families with income $10k - 20k:| Upper San Gabriel Valley: | 3.9% (887) |
| California: | 3.1% (46,821) |
Number of families with income $20k - 30k:| Upper San Gabriel Valley: | 5.8% (1,333) |
| California: | 4.1% (61,519) |
Number of families with income $30k - 40k:| Upper San Gabriel Valley: | 5.6% (1,279) |
| State: | 3.7% (55,234) |
Number of families with income $40k - 50k:| Upper San Gabriel Valley: | 4.2% (955) |
| California: | 3.9% (58,471) |
Number of families with income $50k - 60k:| Upper San Gabriel Valley: | 5.0% (1,153) |
| State: | 3.9% (58,911) |
Number of families with income $60k - 75k:| Upper San Gabriel Valley: | 7.5% (1,729) |
| State: | 5.9% (88,675) |
Number of families with income $75k - 100k:| Upper San Gabriel Valley: | 11.2% (2,578) |
| California: | 9.5% (143,103) |
Number of families with income $100k - 125k:| Upper San Gabriel Valley: | 10.3% (2,362) |
| State: | 9.4% (142,085) |
Number of families with income $125k - 150k:| Upper San Gabriel Valley: | 8.8% (2,012) |
| State: | 8.0% (120,635) |
Number of families with income $150k - 200k:| Upper San Gabriel Valley: | 13.6% (3,131) |
| State: | 13.2% (198,099) |
Number of families with income > $200k:| Upper San Gabriel Valley: | 21.0% (4,809) |
| State: | 32.5% (489,303) |
Median non-family income in Upper San Gabriel Valley in 2022:| Upper San Gabriel Valley: | $64,016 |
| California: | $74,216 |
Change in median non-family income between 2000 and 2022:| Upper San Gabriel Valley, California: | +131.1% |
| State: | +136.3% |
Median per capita income in Upper San Gabriel Valley in 2022:| Upper San Gabriel Valley: | $46,426 |
| State: | $58,824 |
Change in median per capita income between 2000 and 2022:| Upper San Gabriel Valley, California: | +148.4% |
| State: | +166.8% |
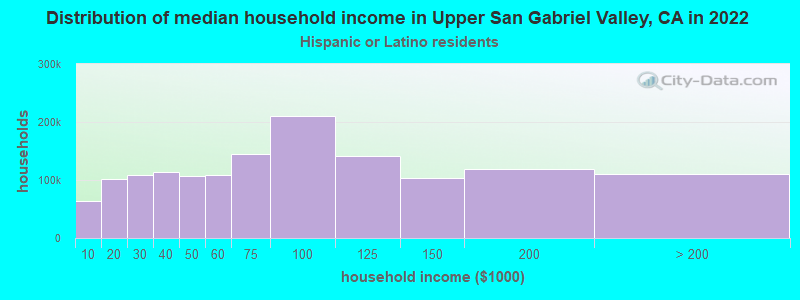
Income statistics for Hispanic or Latino residents
Median household income in Upper San Gabriel Valley, CA in 2022:| Upper San Gabriel Valley: | $76,440 |
| State: | $75,698 |
Change in median household income between 2000 and 2022:| Upper San Gabriel Valley, California: | +110.8% |
| State: | +107.2% |
Number of households with income < $10k:| Upper San Gabriel Valley: | 4.5% (64,499) |
| State: | 4.3% (183,294) |
Number of households with income $10k - 20k:| Upper San Gabriel Valley: | 7.1% (101,922) |
| California: | 6.0% (253,903) |
Number of households with income $20k - 30k:| Upper San Gabriel Valley: | 7.6% (109,084) |
| California: | 6.8% (286,386) |
Number of households with income $30k - 40k:| Upper San Gabriel Valley: | 7.9% (113,545) |
| State: | 7.4% (313,728) |
Number of households with income $40k - 50k:| Upper San Gabriel Valley: | 7.5% (107,578) |
| California: | 7.4% (313,199) |
Number of households with income $50k - 60k:| Upper San Gabriel Valley: | 7.6% (109,197) |
| State: | 7.2% (305,366) |
Number of households with income $60k - 75k:| Upper San Gabriel Valley: | 10.1% (145,210) |
| California: | 10.3% (434,937) |
Number of households with income $75k - 100k:| Upper San Gabriel Valley: | 14.6% (209,854) |
| State: | 14.4% (607,302) |
Number of households with income $100k - 125k:| Upper San Gabriel Valley: | 9.9% (141,767) |
| State: | 10.6% (447,424) |
Number of households with income $125k - 150k:| Upper San Gabriel Valley: | 7.2% (103,519) |
| State: | 7.5% (316,022) |
Number of households with income $150k - 200k:| Upper San Gabriel Valley: | 8.3% (118,497) |
| State: | 9.2% (386,269) |
Number of households with income > $200k:| Upper San Gabriel Valley: | 7.6% (109,554) |
| State: | 8.8% (372,651) |
Aggregate household income in Upper San Gabriel Valley in 2022: $89,902,084,804
Median family income in Upper San Gabriel Valley in 2022:| Upper San Gabriel Valley: | $75,246 |
| State: | $77,589 |
Number of families with income < $10k:| Upper San Gabriel Valley: | 3.2% (1,037) |
| State: | 3.9% (129,468) |
Number of families with income $10k - 20k:| Upper San Gabriel Valley: | 5.4% (1,753) |
| California: | 4.6% (151,997) |
Number of families with income $20k - 30k:| Upper San Gabriel Valley: | 8.6% (2,767) |
| California: | 6.6% (216,764) |
Number of families with income $30k - 40k:| Upper San Gabriel Valley: | 10.0% (3,217) |
| State: | 7.6% (249,849) |
Number of families with income $40k - 50k:| Upper San Gabriel Valley: | 9.0% (2,892) |
| California: | 7.7% (254,822) |
Number of families with income $50k - 60k:| Upper San Gabriel Valley: | 8.6% (2,775) |
| State: | 7.4% (244,815) |
Number of families with income $60k - 75k:| Upper San Gabriel Valley: | 11.4% (3,670) |
| State: | 10.5% (345,838) |
Number of families with income $75k - 100k:| Upper San Gabriel Valley: | 15.1% (4,872) |
| State: | 14.9% (491,589) |
Number of families with income $100k - 125k:| Upper San Gabriel Valley: | 9.6% (3,097) |
| State: | 10.7% (355,400) |
Number of families with income $125k - 150k:| Upper San Gabriel Valley: | 7.1% (2,301) |
| State: | 7.8% (259,317) |
Number of families with income $150k - 200k:| Upper San Gabriel Valley: | 6.6% (2,133) |
| State: | 9.3% (306,566) |
Number of families with income > $200k:| Upper San Gabriel Valley: | 5.3% (1,704) |
| California: | 9.1% (299,984) |
Median non-family income in Upper San Gabriel Valley in 2022:| Upper San Gabriel Valley: | $48,926 |
| State: | $49,746 |
Change in median non-family income between 2000 and 2022:| Upper San Gabriel Valley, California: | +107.5% |
| State: | +100.7% |
Median per capita income in Upper San Gabriel Valley in 2022:| Upper San Gabriel Valley: | $25,774 |
| State: | $27,240 |
Change in median per capita income between 2000 and 2022:| Upper San Gabriel Valley, California: | +138.1% |
| California: | +133.3% |
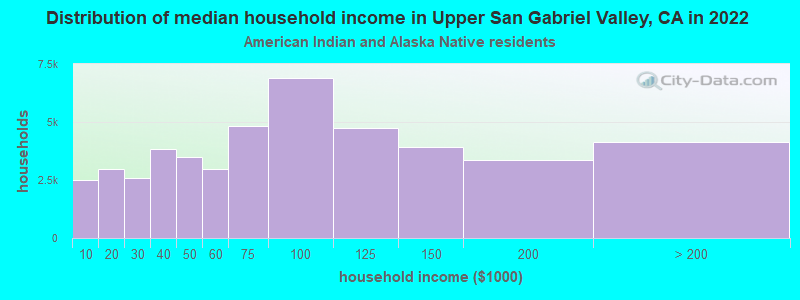
Income statistics for American Indian and Alaska Native residents
Median household income in Upper San Gabriel Valley, CA in 2022:| Upper San Gabriel Valley: | $79,978 |
| State: | $76,752 |
Change in median household income between 2000 and 2022:| Upper San Gabriel Valley, California: | +106.6% |
| State: | +110.0% |
Number of households with income < $10k:| Upper San Gabriel Valley: | 5.4% (2,482) |
| State: | 5.4% (8,471) |
Number of households with income $10k - 20k:| Upper San Gabriel Valley: | 6.4% (2,957) |
| State: | 6.0% (9,381) |
Number of households with income $20k - 30k:| Upper San Gabriel Valley: | 5.6% (2,606) |
| State: | 5.5% (8,668) |
Number of households with income $30k - 40k:| Upper San Gabriel Valley: | 8.3% (3,845) |
| State: | 8.3% (13,030) |
Number of households with income $40k - 50k:| Upper San Gabriel Valley: | 7.6% (3,510) |
| California: | 6.9% (10,908) |
Number of households with income $50k - 60k:| Upper San Gabriel Valley: | 6.4% (2,966) |
| California: | 7.1% (11,198) |
Number of households with income $60k - 75k:| Upper San Gabriel Valley: | 10.4% (4,814) |
| California: | 9.6% (15,190) |
Number of households with income $75k - 100k:| Upper San Gabriel Valley: | 14.9% (6,903) |
| State: | 14.1% (22,274) |
Number of households with income $100k - 125k:| Upper San Gabriel Valley: | 10.3% (4,746) |
| State: | 11.2% (17,643) |
Number of households with income $125k - 150k:| Upper San Gabriel Valley: | 8.5% (3,924) |
| California: | 8.3% (13,117) |
Number of households with income $150k - 200k:| Upper San Gabriel Valley: | 7.3% (3,370) |
| California: | 8.8% (13,853) |
Number of households with income > $200k:| Upper San Gabriel Valley: | 8.9% (4,135) |
| California: | 8.8% (13,925) |
Aggregate household income in Upper San Gabriel Valley in 2022: $152,866,637
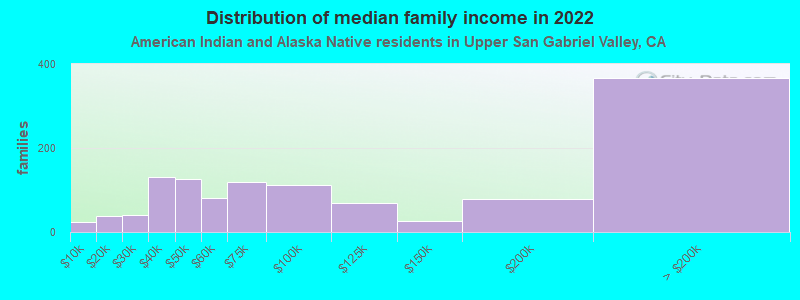
Median family income in Upper San Gabriel Valley in 2022:| Upper San Gabriel Valley: | $82,165 |
| State: | $81,108 |
Number of families with income < $10k:| Upper San Gabriel Valley: | 1.9% (24) |
| State: | 5.0% (5,711) |
Number of families with income $10k - 20k:| Upper San Gabriel Valley: | 3.1% (38) |
| State: | 3.7% (4,148) |
Number of families with income $20k - 30k:| Upper San Gabriel Valley: | 3.4% (41) |
| California: | 4.3% (4,876) |
Number of families with income $30k - 40k:| Upper San Gabriel Valley: | 10.8% (131) |
| California: | 8.8% (9,994) |
Number of families with income $40k - 50k:| Upper San Gabriel Valley: | 10.4% (126) |
| State: | 7.8% (8,776) |
Number of families with income $50k - 60k:| Upper San Gabriel Valley: | 6.6% (80) |
| State: | 6.9% (7,834) |
Number of families with income $60k - 75k:| Upper San Gabriel Valley: | 9.8% (119) |
| State: | 9.1% (10,247) |
Number of families with income $75k - 100k:| Upper San Gabriel Valley: | 9.2% (112) |
| State: | 14.8% (16,731) |
Number of families with income $100k - 125k:| Upper San Gabriel Valley: | 5.7% (70) |
| California: | 12.0% (13,609) |
Number of families with income $125k - 150k:| Upper San Gabriel Valley: | 2.2% (26) |
| State: | 8.0% (9,104) |
Number of families with income $150k - 200k:| Upper San Gabriel Valley: | 6.5% (79) |
| California: | 9.5% (10,721) |
Number of families with income > $200k:| Upper San Gabriel Valley: | 30.3% (367) |
| State: | 10.1% (11,409) |
Median non-family income in Upper San Gabriel Valley in 2022:| Upper San Gabriel Valley: | $61,451 |
| California: | $51,296 |
Change in median non-family income between 2000 and 2022:| Upper San Gabriel Valley, California: | +103.8% |
| State: | +114.0% |
Median per capita income in Upper San Gabriel Valley in 2022:| Upper San Gabriel Valley: | $33,881 |
| State: | $30,289 |
Change in median per capita income between 2000 and 2022:| Upper San Gabriel Valley, California: | +111.4% |
| State: | +98.9% |
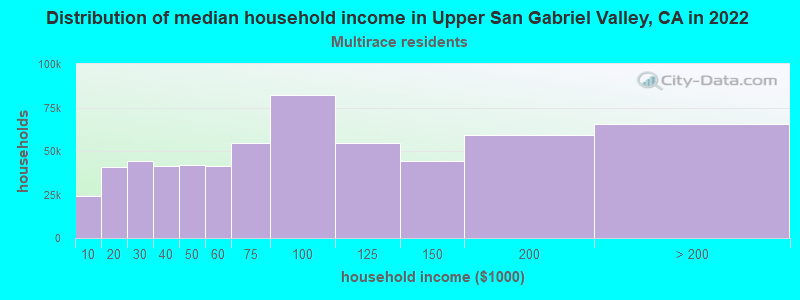
Income statistics for Multirace residents
Median household income in Upper San Gabriel Valley, CA in 2022:| Upper San Gabriel Valley: | $79,959 |
| State: | $83,153 |
Change in median household income between 2000 and 2022:| Upper San Gabriel Valley, California: | +112.7% |
| State: | +106.0% |
Number of households with income < $10k:| Upper San Gabriel Valley: | 4.1% (24,201) |
| California: | 4.2% (85,299) |
Number of households with income $10k - 20k:| Upper San Gabriel Valley: | 6.9% (40,848) |
| State: | 6.1% (122,966) |
Number of households with income $20k - 30k:| Upper San Gabriel Valley: | 7.4% (44,148) |
| State: | 6.4% (129,328) |
Number of households with income $30k - 40k:| Upper San Gabriel Valley: | 7.0% (41,610) |
| California: | 6.4% (130,070) |
Number of households with income $40k - 50k:| Upper San Gabriel Valley: | 7.0% (41,888) |
| State: | 6.5% (131,254) |
Number of households with income $50k - 60k:| Upper San Gabriel Valley: | 7.0% (41,419) |
| California: | 6.5% (132,382) |
Number of households with income $60k - 75k:| Upper San Gabriel Valley: | 9.2% (54,580) |
| State: | 9.4% (191,472) |
Number of households with income $75k - 100k:| Upper San Gabriel Valley: | 13.8% (82,118) |
| California: | 13.3% (269,691) |
Number of households with income $100k - 125k:| Upper San Gabriel Valley: | 9.2% (54,587) |
| California: | 10.2% (207,286) |
Number of households with income $125k - 150k:| Upper San Gabriel Valley: | 7.4% (44,189) |
| State: | 7.8% (158,259) |
Number of households with income $150k - 200k:| Upper San Gabriel Valley: | 9.9% (59,123) |
| California: | 10.3% (209,227) |
Number of households with income > $200k:| Upper San Gabriel Valley: | 11.0% (65,581) |
| State: | 13.0% (263,210) |
Aggregate household income in Upper San Gabriel Valley in 2022: $4,864,680,500
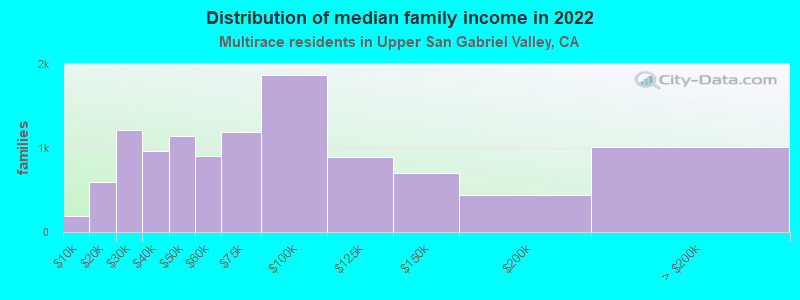
Median family income in Upper San Gabriel Valley in 2022:| Upper San Gabriel Valley: | $82,130 |
| California: | $87,642 |
Number of families with income < $10k:| Upper San Gabriel Valley: | 1.8% (196) |
| State: | 3.2% (48,017) |
Number of families with income $10k - 20k:| Upper San Gabriel Valley: | 5.4% (596) |
| State: | 4.1% (60,419) |
Number of families with income $20k - 30k:| Upper San Gabriel Valley: | 10.9% (1,213) |
| State: | 6.1% (89,742) |
Number of families with income $30k - 40k:| Upper San Gabriel Valley: | 8.7% (962) |
| State: | 6.2% (91,415) |
Number of families with income $40k - 50k:| Upper San Gabriel Valley: | 10.3% (1,140) |
| State: | 6.8% (100,085) |
Number of families with income $50k - 60k:| Upper San Gabriel Valley: | 8.2% (908) |
| California: | 6.7% (98,298) |
Number of families with income $60k - 75k:| Upper San Gabriel Valley: | 10.7% (1,185) |
| State: | 9.5% (140,131) |
Number of families with income $75k - 100k:| Upper San Gabriel Valley: | 16.8% (1,866) |
| California: | 13.8% (203,439) |
Number of families with income $100k - 125k:| Upper San Gabriel Valley: | 8.0% (887) |
| State: | 10.4% (153,515) |
Number of families with income $125k - 150k:| Upper San Gabriel Valley: | 6.3% (698) |
| State: | 8.4% (124,115) |
Number of families with income $150k - 200k:| Upper San Gabriel Valley: | 3.9% (436) |
| State: | 10.9% (161,643) |
Number of families with income > $200k:| Upper San Gabriel Valley: | 9.1% (1,010) |
| State: | 14.0% (207,317) |
Median non-family income in Upper San Gabriel Valley in 2022:| Upper San Gabriel Valley: | $44,746 |
| California: | $56,558 |
Change in median non-family income between 2000 and 2022:| Upper San Gabriel Valley, California: | +100.0% |
| California: | +100.2% |
Median per capita income in Upper San Gabriel Valley in 2022:| Upper San Gabriel Valley: | $25,615 |
| State: | $32,124 |
Change in median per capita income between 2000 and 2022:| Upper San Gabriel Valley, California: | +108.4% |
| State: | +120.4% |
Income statistics for other residents
Number of households with income < $10k:| Upper San Gabriel Valley: | 5.1% (11,489) |
| California: | 4.6% (93,035) |
Number of households with income $10k - 20k:| Upper San Gabriel Valley: | 7.4% (16,869) |
| State: | 6.3% (126,222) |
Number of households with income $20k - 30k:| Upper San Gabriel Valley: | 7.8% (17,730) |
| State: | 7.1% (142,656) |
Number of households with income $30k - 40k:| Upper San Gabriel Valley: | 8.5% (19,360) |
| State: | 8.2% (165,018) |
Number of households with income $40k - 50k:| Upper San Gabriel Valley: | 7.9% (18,066) |
| State: | 8.0% (161,732) |
Number of households with income $50k - 60k:| Upper San Gabriel Valley: | 8.0% (18,210) |
| State: | 7.6% (152,152) |
Number of households with income $60k - 75k:| Upper San Gabriel Valley: | 10.4% (23,771) |
| State: | 10.4% (209,951) |
Number of households with income $75k - 100k:| Upper San Gabriel Valley: | 14.7% (33,402) |
| State: | 14.7% (296,102) |
Number of households with income $100k - 125k:| Upper San Gabriel Valley: | 10.0% (22,735) |
| State: | 10.7% (214,281) |
Number of households with income $125k - 150k:| Upper San Gabriel Valley: | 6.9% (15,617) |
| California: | 7.1% (143,092) |
Number of households with income $150k - 200k:| Upper San Gabriel Valley: | 7.5% (17,023) |
| State: | 8.6% (172,215) |
Number of households with income > $200k:| Upper San Gabriel Valley: | 5.8% (13,214) |
| State: | 6.7% (134,102) |
Aggregate household income in Upper San Gabriel Valley in 2022: $19,102,699,844
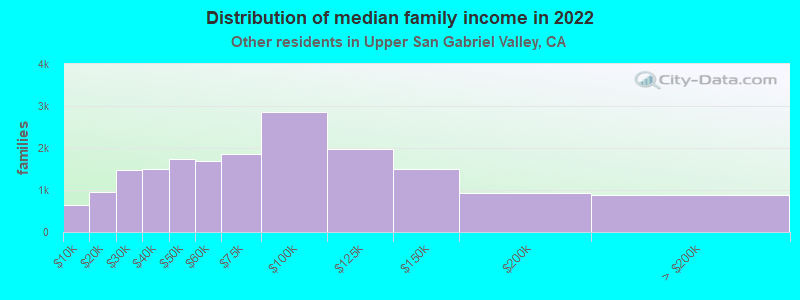
Median family income in Upper San Gabriel Valley in 2022:| Upper San Gabriel Valley: | $71,492 |
| State: | $72,756 |
Number of families with income < $10k:| Upper San Gabriel Valley: | 3.6% (648) |
| California: | 4.3% (69,090) |
Number of families with income $10k - 20k:| Upper San Gabriel Valley: | 5.3% (953) |
| State: | 5.1% (82,116) |
Number of families with income $20k - 30k:| Upper San Gabriel Valley: | 8.2% (1,475) |
| State: | 7.0% (112,854) |
Number of families with income $30k - 40k:| Upper San Gabriel Valley: | 8.4% (1,511) |
| California: | 8.4% (135,938) |
Number of families with income $40k - 50k:| Upper San Gabriel Valley: | 9.7% (1,743) |
| State: | 8.4% (135,353) |
Number of families with income $50k - 60k:| Upper San Gabriel Valley: | 9.4% (1,689) |
| State: | 7.7% (124,826) |
Number of families with income $60k - 75k:| Upper San Gabriel Valley: | 10.3% (1,856) |
| State: | 10.7% (173,628) |
Number of families with income $75k - 100k:| Upper San Gabriel Valley: | 15.9% (2,866) |
| California: | 15.2% (245,724) |
Number of families with income $100k - 125k:| Upper San Gabriel Valley: | 11.0% (1,979) |
| California: | 10.9% (176,716) |
Number of families with income $125k - 150k:| Upper San Gabriel Valley: | 8.3% (1,494) |
| California: | 7.4% (119,985) |
Number of families with income $150k - 200k:| Upper San Gabriel Valley: | 5.1% (917) |
| State: | 8.5% (137,332) |
Number of families with income > $200k:| Upper San Gabriel Valley: | 4.8% (871) |
| California: | 6.6% (106,346) |
Median non-family income in Upper San Gabriel Valley in 2022:| Upper San Gabriel Valley: | $42,504 |
| California: | $43,881 |
Change in median non-family income between 2000 and 2022:| Upper San Gabriel Valley, California: | +84.3% |
| State: | +84.6% |
Median per capita income in Upper San Gabriel Valley in 2022:| Upper San Gabriel Valley: | $23,351 |
| State: | $25,164 |
Change in median per capita income between 2000 and 2022:| Upper San Gabriel Valley, California: | +144.3% |
| State: | +137.9% |