The median household income in Upper Marlboro, MD in 2022 was $108,245, which was 12.2% greater than the median annual income of $94,991 across the entire state of Maryland. Compared to the median income of $52,813 in 2000 this represents an increase of 51.2%. The per capita income in 2022 was $53,469, which means an increase of 46.0% compared to 2000 when it was $28,892.
Whole page based on the data from 2000 / 2022 when the population of Upper Marlboro, Maryland was 648 / 751
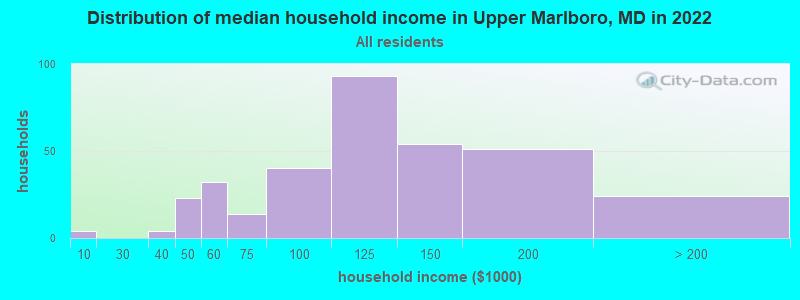
Income statistics for all residents
Median household income in Upper Marlboro, MD in 2022:
Upper Marlboro:
$108,245
State:
$94,991
Change in median household income between 2000 and 2022:
Upper Marlboro, Maryland:
+105.0%
State:
+79.7%
Number of households with income < $10k:
Upper Marlboro:
1.2% (4)
State:
4.8% (114,450)
Number of households with income $10k - 20k:
Upper Marlboro:
0.0% (0)
State:
5.0% (117,883)
Number of households with income $20k - 30k:
Upper Marlboro:
0.0% (0)
State:
5.2% (123,350)
Number of households with income $30k - 40k:
Upper Marlboro:
1.2% (4)
Maryland:
5.6% (134,104)
Number of households with income $40k - 50k:
Upper Marlboro:
6.8% (23)
State:
5.6% (132,932)
Number of households with income $50k - 60k:
Upper Marlboro:
9.4% (32)
State:
5.6% (132,707)
Number of households with income $60k - 75k:
Upper Marlboro:
4.1% (14)
Maryland:
7.9% (188,335)
Number of households with income $75k - 100k:
Upper Marlboro:
11.8% (40)
State:
12.5% (297,873)
Number of households with income $100k - 125k:
Upper Marlboro:
27.4% (93)
State:
10.5% (250,497)
Number of households with income $125k - 150k:
Upper Marlboro:
15.9% (54)
State:
8.1% (193,208)
Number of households with income $150k - 200k:
Upper Marlboro:
15.0% (51)
Maryland:
11.6% (274,905)
Number of households with income > $200k:
Upper Marlboro:
7.1% (24)
State:
17.5% (415,740)
Aggregate household income in Upper Marlboro in 2022: $39,872,507
Median family income in Upper Marlboro in 2022:
Upper Marlboro:
$121,685
State:
$117,294
Number of families with income $50k - 60k:
Upper Marlboro:
0.6% (1)
State:
5.0% (77,590)
Number of families with income $60k - 75k:
Upper Marlboro:
1.9% (3)
Maryland:
7.1% (109,924)
Number of families with income $75k - 100k:
Upper Marlboro:
10.7% (17)
Maryland:
12.0% (185,255)
Number of families with income $100k - 125k:
Upper Marlboro:
39.2% (63)
State:
11.2% (173,203)
Number of families with income $125k - 150k:
Upper Marlboro:
23.5% (38)
Maryland:
9.3% (143,453)
Number of families with income $150k - 200k:
Upper Marlboro:
13.3% (22)
State:
14.2% (218,861)
Number of families with income > $200k:
Upper Marlboro:
10.8% (18)
State:
23.2% (359,182)
Median non-family income in Upper Marlboro in 2022:
Upper Marlboro:
$83,686
Maryland:
$57,179
Change in median non-family income between 2000 and 2022:
Upper Marlboro, Maryland:
+76.2%
State:
+75.1%
Median per capita income in Upper Marlboro in 2022:
Upper Marlboro:
$53,469
State:
$49,236
Change in median per capita income between 2000 and 2022:
Upper Marlboro, Maryland:
+85.1%
Maryland:
+92.2%
Income statistics for White residents
Median household income in Upper Marlboro, MD in 2022:
Upper Marlboro:
$119,937
Maryland:
$107,160
Change in median household income between 2000 and 2022:
Upper Marlboro, Maryland:
+134.9%
State:
+85.3%
Number of households with income < $10k:
Upper Marlboro:
0.0% (0)
State:
3.7% (47,387)
Number of households with income $10k - 20k:
Upper Marlboro:
0.0% (0)
Maryland:
4.1% (52,102)
Number of households with income $20k - 30k:
Upper Marlboro:
0.0% (0)
State:
4.6% (58,758)
Number of households with income $30k - 40k:
Upper Marlboro:
0.0% (0)
State:
4.7% (59,745)
Number of households with income $40k - 50k:
Upper Marlboro:
13.3% (14)
State:
5.0% (62,576)
Number of households with income $50k - 60k:
Upper Marlboro:
13.3% (14)
State:
5.1% (64,484)
Number of households with income $60k - 75k:
Upper Marlboro:
3.8% (4)
State:
7.7% (97,019)
Number of households with income $75k - 100k:
Upper Marlboro:
6.7% (7)
Maryland:
11.8% (149,205)
Number of households with income $100k - 125k:
Upper Marlboro:
17.1% (18)
State:
10.6% (134,231)
Number of households with income $125k - 150k:
Upper Marlboro:
8.6% (9)
Maryland:
8.8% (111,081)
Number of households with income $150k - 200k:
Upper Marlboro:
25.7% (27)
State:
12.9% (162,966)
Number of households with income > $200k:
Upper Marlboro:
11.4% (12)
Maryland:
20.9% (264,377)
Aggregate household income in Upper Marlboro in 2022: $12,710,889
Median family income in Upper Marlboro in 2022:
Upper Marlboro:
$141,969
State:
$134,708
Number of families with income $75k - 100k:
Upper Marlboro:
11.3% (4)
State:
11.3% (91,779)
Number of families with income $100k - 125k:
Upper Marlboro:
17.7% (6)
State:
11.3% (91,483)
Number of families with income $125k - 150k:
Upper Marlboro:
22.1% (8)
State:
9.9% (80,832)
Number of families with income $150k - 200k:
Upper Marlboro:
25.4% (9)
State:
16.0% (130,295)
Number of families with income > $200k:
Upper Marlboro:
23.5% (9)
Maryland:
28.1% (228,324)
Median non-family income in Upper Marlboro in 2022:
Upper Marlboro:
$116,748
State:
$61,991
Median per capita income in Upper Marlboro in 2022:
Upper Marlboro:
$60,474
State:
$59,750
Change in median per capita income between 2000 and 2022:
Upper Marlboro, Maryland:
+86.8%
Maryland:
+104.5%
Income statistics for Black or African American residents
Median household income in Upper Marlboro, MD in 2022:
Upper Marlboro:
$108,190
State:
$77,368
Change in median household income between 2000 and 2022:
Upper Marlboro, Maryland:
+80.3%
Maryland:
+85.7%
Number of households with income < $10k:
Upper Marlboro:
1.4% (3)
State:
7.0% (50,093)
Number of households with income $10k - 20k:
Upper Marlboro:
0.0% (0)
State:
7.2% (51,849)
Number of households with income $20k - 30k:
Upper Marlboro:
0.0% (0)
State:
5.8% (41,510)
Number of households with income $30k - 40k:
Upper Marlboro:
1.4% (3)
State:
6.9% (49,466)
Number of households with income $40k - 50k:
Upper Marlboro:
2.4% (5)
Maryland:
6.6% (47,557)
Number of households with income $50k - 60k:
Upper Marlboro:
8.0% (17)
State:
6.2% (44,818)
Number of households with income $60k - 75k:
Upper Marlboro:
4.7% (10)
State:
8.6% (61,728)
Number of households with income $75k - 100k:
Upper Marlboro:
14.2% (30)
State:
13.2% (95,107)
Number of households with income $100k - 125k:
Upper Marlboro:
34.0% (72)
State:
10.2% (73,579)
Number of households with income $125k - 150k:
Upper Marlboro:
19.8% (42)
Maryland:
7.2% (51,970)
Number of households with income $150k - 200k:
Upper Marlboro:
10.8% (23)
Maryland:
9.4% (67,623)
Number of households with income > $200k:
Upper Marlboro:
3.3% (7)
Maryland:
11.7% (83,862)
Aggregate household income in Upper Marlboro in 2022: $24,695,611
Median family income in Upper Marlboro in 2022:
Upper Marlboro:
$117,155
Maryland:
$96,241
Number of families with income $50k - 60k:
Upper Marlboro:
0.6% (1)
Maryland:
5.9% (25,636)
Number of families with income $60k - 75k:
Upper Marlboro:
2.7% (3)
Maryland:
8.0% (35,163)
Number of families with income $75k - 100k:
Upper Marlboro:
9.5% (11)
State:
12.8% (55,976)
Number of families with income $100k - 125k:
Upper Marlboro:
47.5% (56)
State:
11.4% (49,778)
Number of families with income $125k - 150k:
Upper Marlboro:
26.0% (31)
State:
8.8% (38,547)
Number of families with income $150k - 200k:
Upper Marlboro:
10.1% (12)
State:
11.8% (51,381)
Number of families with income > $200k:
Upper Marlboro:
3.5% (4)
State:
16.5% (71,997)
Median non-family income in Upper Marlboro in 2022:
Upper Marlboro:
$76,088
Maryland:
$49,944
Change in median non-family income between 2000 and 2022:
Upper Marlboro, Maryland:
+43.2%
State:
+71.8%
Median per capita income in Upper Marlboro in 2022:
Upper Marlboro:
$51,323
State:
$40,756
Change in median per capita income between 2000 and 2022:
Upper Marlboro, Maryland:
+101.4%
State:
+113.5%
Income statistics for Multirace residents
Median household income in Upper Marlboro, MD in 2022:
Upper Marlboro:
$135,616
State:
$99,027
Aggregate household income in Upper Marlboro in 2022: $1,541,396
Median per capita income in Upper Marlboro in 2022:
Upper Marlboro:
$89,726
State:
$35,630
Discuss Upper Marlboro, Maryland (MD) on our hugely popular Maryland forum.