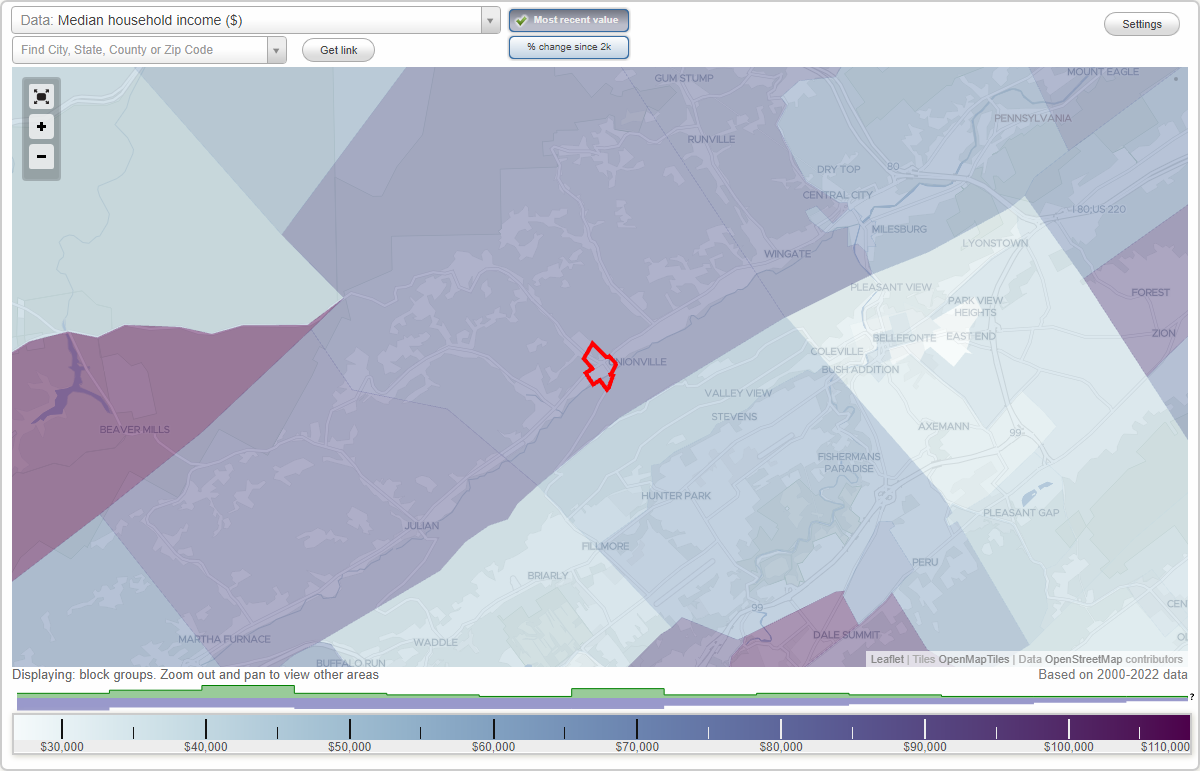
The median household income in Unionville, PA in 2022 was $55,353, which was 29.7% less than the median annual income of $71,798 across the entire state of Pennsylvania. Compared to the median income of $34,286 in 2000 this represents an increase of 38.1%. The per capita income in 2022 was $30,189, which means an increase of 49.4% compared to 2000 when it was $15,284.
Whole page based on the data from 2000 / 2022 when the population of Unionville, Pennsylvania was 313 / 256
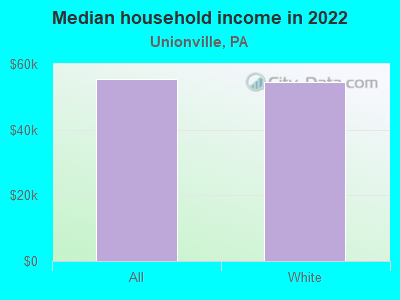
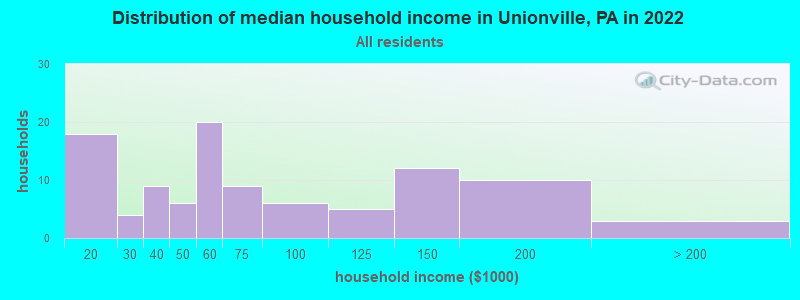
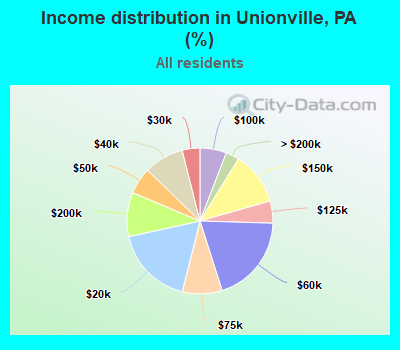
Income statistics for all residents
Median household income in Unionville, PA in 2022:
Unionville:
$55,354
State:
$71,798
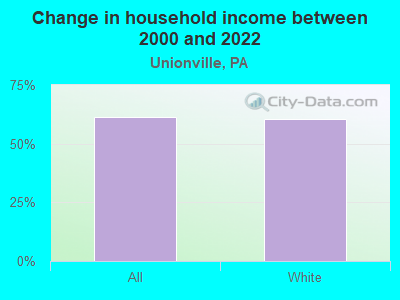
Change in median household income between 2000 and 2022:
Unionville, Pennsylvania:
+61.4%
Pennsylvania:
+79.0%
Number of households with income < $10k:
Unionville:
0.0% (0)
Pennsylvania:
5.5% (291,562)
Number of households with income $10k - 20k:
Unionville:
17.6% (18)
State:
7.3% (384,726)
Number of households with income $20k - 30k:
Unionville:
3.9% (4)
Pennsylvania:
7.4% (389,464)
Number of households with income $30k - 40k:
Unionville:
8.8% (9)
State:
7.6% (402,138)
Number of households with income $40k - 50k:
Unionville:
5.9% (6)
State:
7.3% (387,945)
Number of households with income $50k - 60k:
Unionville:
19.6% (20)
Pennsylvania:
7.0% (372,468)
Number of households with income $60k - 75k:
Unionville:
8.8% (9)
State:
9.9% (524,786)
Number of households with income $75k - 100k:
Unionville:
5.9% (6)
State:
12.6% (666,253)
Number of households with income $100k - 125k:
Unionville:
4.9% (5)
State:
9.9% (526,402)
Number of households with income $125k - 150k:
Unionville:
11.8% (12)
State:
6.9% (362,702)
Number of households with income $150k - 200k:
Unionville:
9.8% (10)
State:
8.3% (440,827)
Number of households with income > $200k:
Unionville:
2.9% (3)
State:
10.3% (544,792)
Aggregate household income in Unionville in 2022: $7,881,210
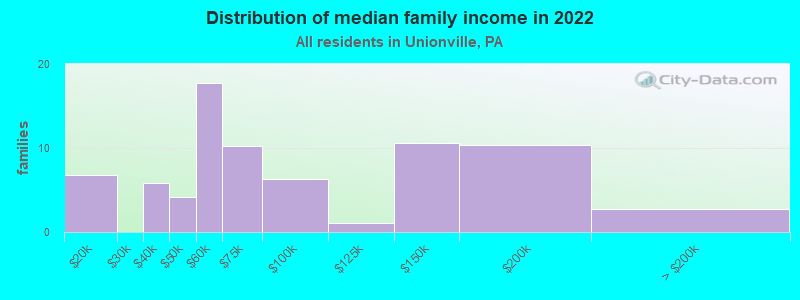
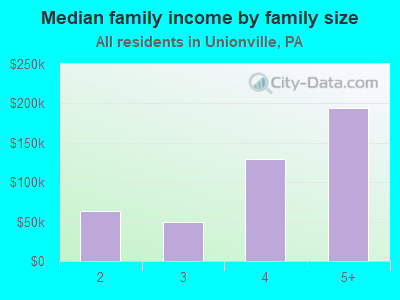
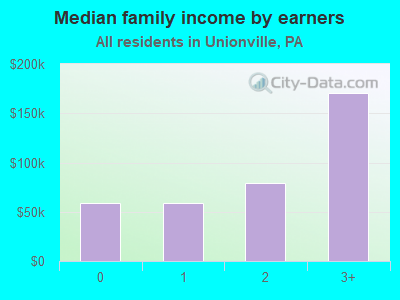
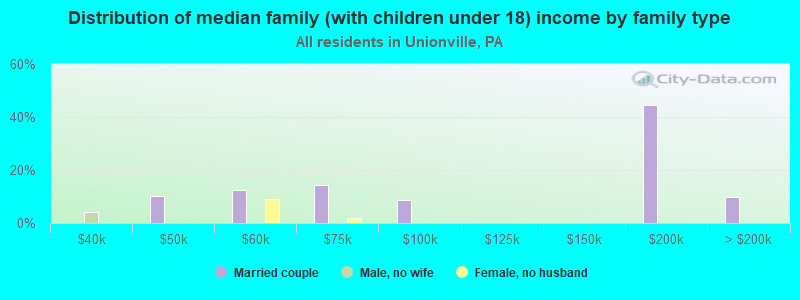
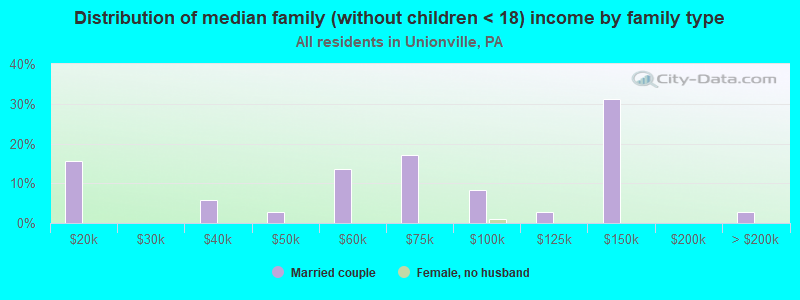
Median family income in Unionville in 2022:
Unionville:
$61,804
State:
$93,029
Number of families with income $10k - 20k:
Unionville:
9.0% (7)
State:
3.5% (115,881)
Number of families with income $30k - 40k:
Unionville:
7.7% (6)
State:
5.8% (191,305)
Number of families with income $40k - 50k:
Unionville:
5.5% (4)
State:
6.4% (211,380)
Number of families with income $50k - 60k:
Unionville:
23.4% (18)
State:
6.4% (209,910)
Number of families with income $60k - 75k:
Unionville:
13.4% (10)
Pennsylvania:
9.7% (318,991)
Number of families with income $75k - 100k:
Unionville:
8.3% (6)
State:
14.0% (461,021)
Number of families with income $100k - 125k:
Unionville:
1.5% (1)
Pennsylvania:
12.2% (400,961)
Number of families with income $125k - 150k:
Unionville:
13.9% (11)
State:
8.8% (288,471)
Number of families with income $150k - 200k:
Unionville:
13.7% (10)
Pennsylvania:
11.2% (367,642)
Number of families with income > $200k:
Unionville:
3.7% (3)
State:
14.3% (470,863)
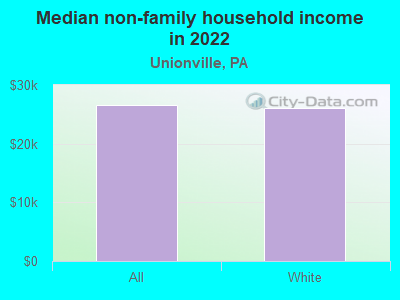
Median non-family income in Unionville in 2022:
Unionville:
$26,660
State:
$42,203
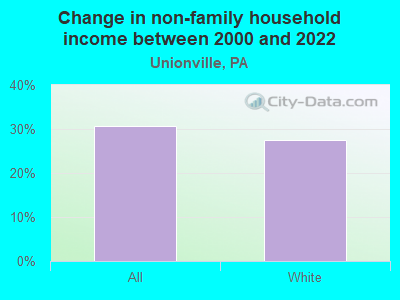
Change in median non-family income between 2000 and 2022:
Unionville, Pennsylvania:
+30.6%
State:
+90.1%
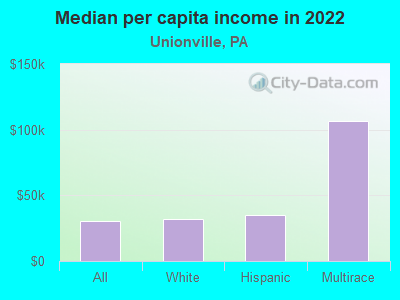
Median per capita income in Unionville in 2022:
Unionville:
$30,189
State:
$41,489
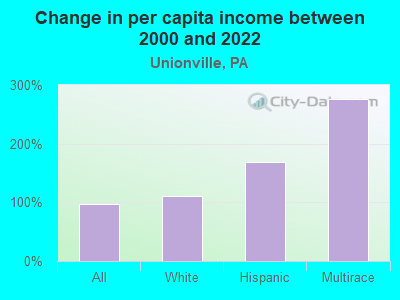
Change in median per capita income between 2000 and 2022:
Unionville, Pennsylvania:
+97.5%
State:
+98.7%
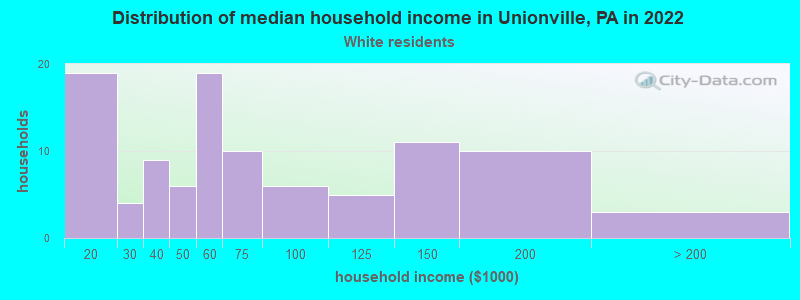
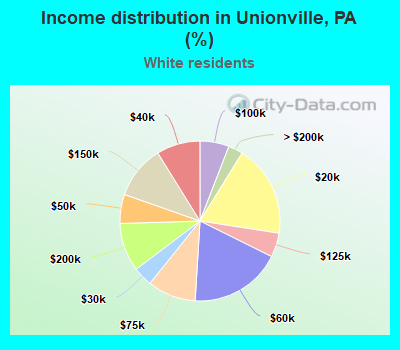
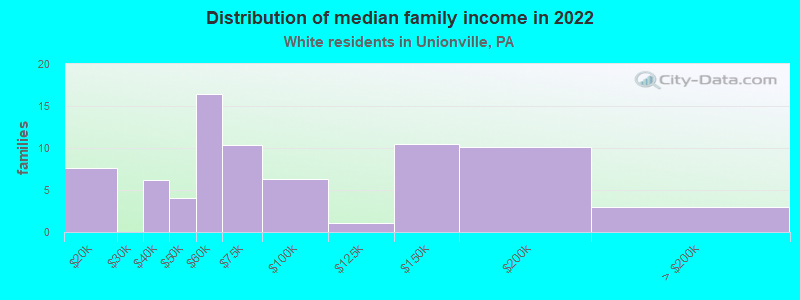
Income statistics for White residents
Median household income in Unionville, PA in 2022:
Unionville:
$54,424
Pennsylvania:
$76,765
Change in median household income between 2000 and 2022:
Unionville, Pennsylvania:
+60.4%
State:
+84.3%
Number of households with income < $10k:
Unionville:
0.0% (0)
State:
4.3% (179,792)
Number of households with income $10k - 20k:
Unionville:
18.6% (19)
State:
6.5% (268,738)
Number of households with income $20k - 30k:
Unionville:
3.9% (4)
State:
7.0% (288,138)
Number of households with income $30k - 40k:
Unionville:
8.8% (9)
State:
7.2% (300,208)
Number of households with income $40k - 50k:
Unionville:
5.9% (6)
Pennsylvania:
7.2% (298,756)
Number of households with income $50k - 60k:
Unionville:
18.6% (19)
State:
6.8% (283,251)
Number of households with income $60k - 75k:
Unionville:
9.8% (10)
State:
9.9% (408,159)
Number of households with income $75k - 100k:
Unionville:
5.9% (6)
State:
13.2% (547,809)
Number of households with income $100k - 125k:
Unionville:
4.9% (5)
State:
10.5% (436,652)
Number of households with income $125k - 150k:
Unionville:
10.8% (11)
State:
7.3% (304,132)
Number of households with income $150k - 200k:
Unionville:
9.8% (10)
Pennsylvania:
9.0% (374,658)
Number of households with income > $200k:
Unionville:
2.9% (3)
Pennsylvania:
10.9% (452,618)
Aggregate household income in Unionville in 2022: $7,929,364
Median family income in Unionville in 2022:
Unionville:
$61,548
State:
$99,396
Number of families with income $10k - 20k:
Unionville:
10.1% (8)
Pennsylvania:
2.7% (69,032)
Number of families with income $30k - 40k:
Unionville:
8.1% (6)
State:
5.2% (134,367)
Number of families with income $40k - 50k:
Unionville:
5.3% (4)
Pennsylvania:
6.0% (154,327)
Number of families with income $50k - 60k:
Unionville:
21.8% (16)
State:
6.1% (157,983)
Number of families with income $60k - 75k:
Unionville:
13.8% (10)
State:
9.6% (249,292)
Number of families with income $75k - 100k:
Unionville:
8.4% (6)
State:
14.7% (379,316)
Number of families with income $100k - 125k:
Unionville:
1.4% (1)
Pennsylvania:
12.9% (333,626)
Number of families with income $125k - 150k:
Unionville:
13.8% (10)
State:
9.4% (243,915)
Number of families with income $150k - 200k:
Unionville:
13.5% (10)
State:
12.2% (314,926)
Number of families with income > $200k:
Unionville:
3.9% (3)
Pennsylvania:
15.1% (390,885)
Median non-family income in Unionville in 2022:
Unionville:
$26,032
State:
$44,251
Change in median non-family income between 2000 and 2022:
Unionville, Pennsylvania:
+27.5%
State:
+94.2%
Median per capita income in Unionville in 2022:
Unionville:
$31,859
State:
$45,306
Change in median per capita income between 2000 and 2022:
Unionville, Pennsylvania:
+110.5%
State:
+105.4%
Income statistics for Hispanic or Latino residents
Aggregate household income in Unionville in 2022: $1,317,206
Median per capita income in Unionville in 2022:
Unionville:
$34,766
State:
$23,829
Income statistics for Multirace residents
Median per capita income in Unionville in 2022:
Unionville:
$106,619
State:
$27,581
Discuss Unionville, Pennsylvania (PA) on our hugely popular Pennsylvania forum.