Tyler Run-Queens Gate, Pennsylvania (PA) income map, earnings map, and wages data
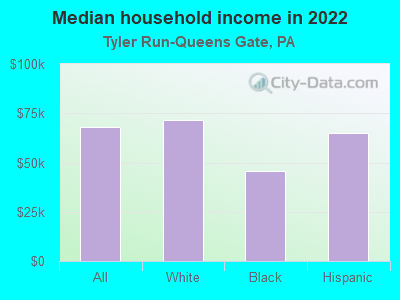
The median household income in Tyler Run-Queens Gate, PA in 2022 was $68,190, which was 5.3% less than the median annual income of $71,798 across the entire state of Pennsylvania. Compared to the median income of $38,523 in 2000 this represents an increase of 43.5%. The per capita income in 2022 was $47,900, which means an increase of 46.6% compared to 2000 when it was $25,589.
Income statistics for all residents
Median household income in Tyler Run-Queens Gate, PA in 2022:| Tyler Run-Queens Gate: | $68,191 |
| State: | $71,798 |
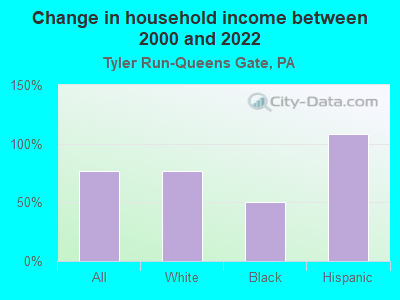
Change in median household income between 2000 and 2022:| Tyler Run-Queens Gate, Pennsylvania: | +77.0% |
| Pennsylvania: | +79.0% |
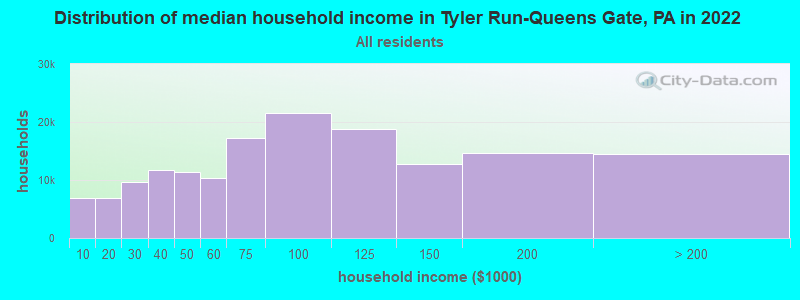
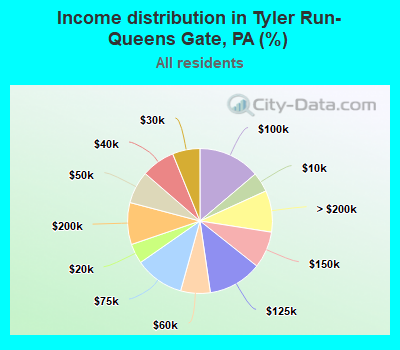
Number of households with income < $10k:| Tyler Run-Queens Gate: | 4.4% (6,911) |
| State: | 5.5% (291,562) |
Number of households with income $10k - 20k:| Tyler Run-Queens Gate: | 4.4% (6,948) |
| State: | 7.3% (384,726) |
Number of households with income $20k - 30k:| Tyler Run-Queens Gate: | 6.1% (9,593) |
| State: | 7.4% (389,464) |
Number of households with income $30k - 40k:| Tyler Run-Queens Gate: | 7.5% (11,752) |
| State: | 7.6% (402,138) |
Number of households with income $40k - 50k:| Tyler Run-Queens Gate: | 7.3% (11,358) |
| Pennsylvania: | 7.3% (387,945) |
Number of households with income $50k - 60k:| Tyler Run-Queens Gate: | 6.6% (10,329) |
| State: | 7.0% (372,468) |
Number of households with income $60k - 75k:| Tyler Run-Queens Gate: | 11.0% (17,240) |
| State: | 9.9% (524,786) |
Number of households with income $75k - 100k:| Tyler Run-Queens Gate: | 13.8% (21,597) |
| State: | 12.6% (666,253) |
Number of households with income $100k - 125k:| Tyler Run-Queens Gate: | 12.0% (18,849) |
| Pennsylvania: | 9.9% (526,402) |
Number of households with income $125k - 150k:| Tyler Run-Queens Gate: | 8.2% (12,824) |
| Pennsylvania: | 6.9% (362,702) |
Number of households with income $150k - 200k:| Tyler Run-Queens Gate: | 9.4% (14,658) |
| Pennsylvania: | 8.3% (440,827) |
Number of households with income > $200k:| Tyler Run-Queens Gate: | 9.3% (14,541) |
| State: | 10.3% (544,792) |
Aggregate household income in Tyler Run-Queens Gate in 2022: $620,309,860
Median family income in Tyler Run-Queens Gate in 2022:| Tyler Run-Queens Gate: | $92,717 |
| Pennsylvania: | $93,029 |
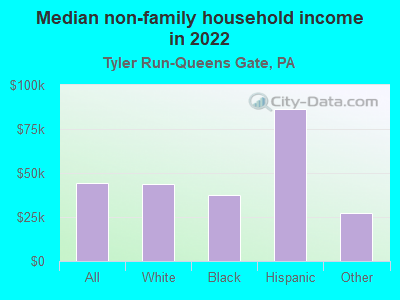
Median non-family income in Tyler Run-Queens Gate in 2022:| Tyler Run-Queens Gate: | $44,447 |
| State: | $42,203 |
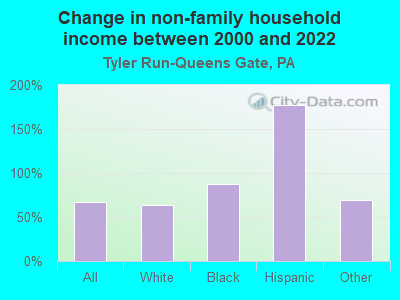
Change in median non-family income between 2000 and 2022:| Tyler Run-Queens Gate, Pennsylvania: | +66.8% |
| State: | +90.1% |
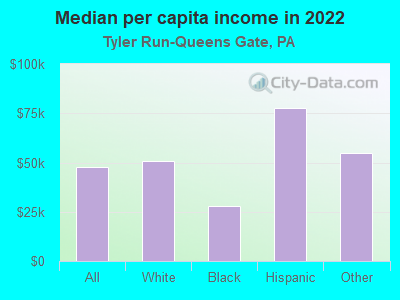
Median per capita income in Tyler Run-Queens Gate in 2022:| Tyler Run-Queens Gate: | $47,900 |
| State: | $41,489 |
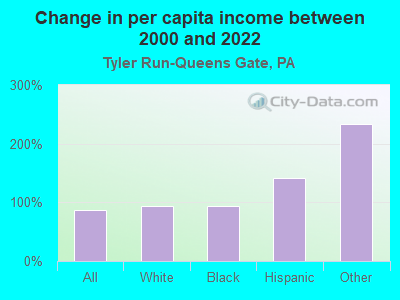
Change in median per capita income between 2000 and 2022:| Tyler Run-Queens Gate, Pennsylvania: | +87.2% |
| State: | +98.7% |
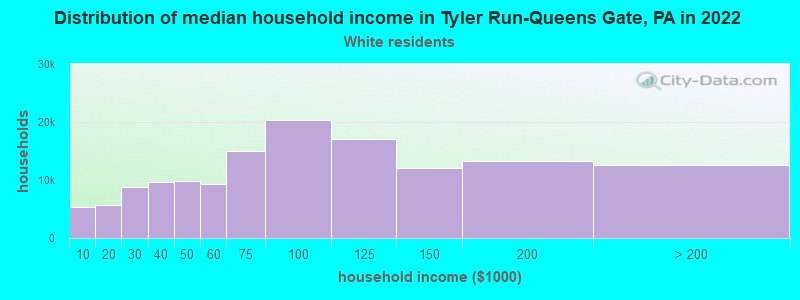
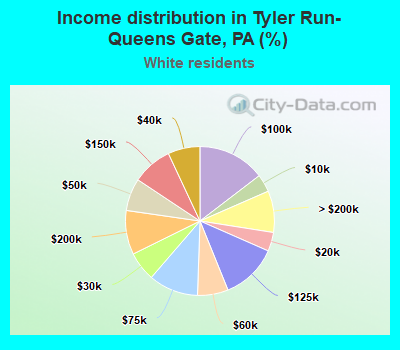
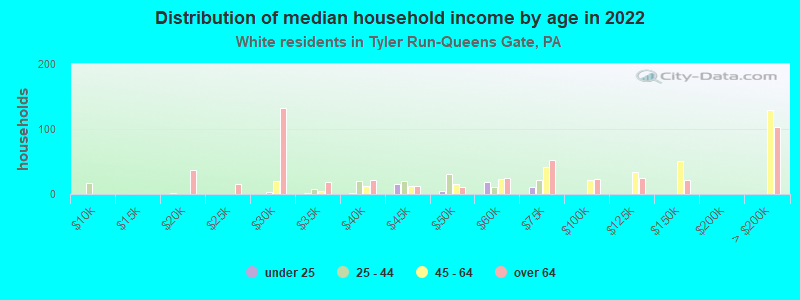
Income statistics for White residents
Median household income in Tyler Run-Queens Gate, PA in 2022:| Tyler Run-Queens Gate: | $71,447 |
| State: | $76,765 |
Change in median household income between 2000 and 2022:| Tyler Run-Queens Gate, Pennsylvania: | +77.2% |
| State: | +84.3% |
Number of households with income < $10k:| Tyler Run-Queens Gate: | 3.9% (5,371) |
| State: | 4.3% (179,792) |
Number of households with income $10k - 20k:| Tyler Run-Queens Gate: | 4.1% (5,717) |
| State: | 6.5% (268,738) |
Number of households with income $20k - 30k:| Tyler Run-Queens Gate: | 6.4% (8,865) |
| Pennsylvania: | 7.0% (288,138) |
Number of households with income $30k - 40k:| Tyler Run-Queens Gate: | 7.0% (9,710) |
| State: | 7.2% (300,208) |
Number of households with income $40k - 50k:| Tyler Run-Queens Gate: | 7.1% (9,835) |
| State: | 7.2% (298,756) |
Number of households with income $50k - 60k:| Tyler Run-Queens Gate: | 6.7% (9,271) |
| Pennsylvania: | 6.8% (283,251) |
Number of households with income $60k - 75k:| Tyler Run-Queens Gate: | 10.8% (15,054) |
| State: | 9.9% (408,159) |
Number of households with income $75k - 100k:| Tyler Run-Queens Gate: | 14.6% (20,354) |
| Pennsylvania: | 13.2% (547,809) |
Number of households with income $100k - 125k:| Tyler Run-Queens Gate: | 12.3% (17,128) |
| State: | 10.5% (436,652) |
Number of households with income $125k - 150k:| Tyler Run-Queens Gate: | 8.7% (12,118) |
| State: | 7.3% (304,132) |
Number of households with income $150k - 200k:| Tyler Run-Queens Gate: | 9.6% (13,344) |
| Pennsylvania: | 9.0% (374,658) |
Number of households with income > $200k:| Tyler Run-Queens Gate: | 9.0% (12,580) |
| State: | 10.9% (452,618) |
Aggregate household income in Tyler Run-Queens Gate in 2022: $527,066,213
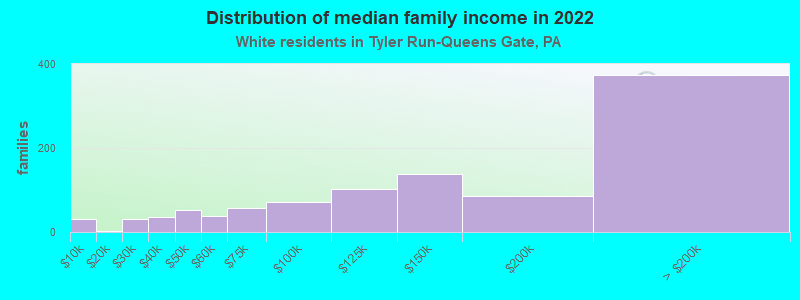
Median family income in Tyler Run-Queens Gate in 2022:| Tyler Run-Queens Gate: | $94,004 |
| Pennsylvania: | $99,396 |
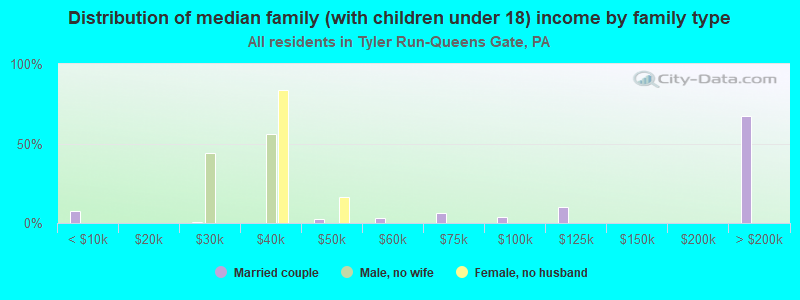
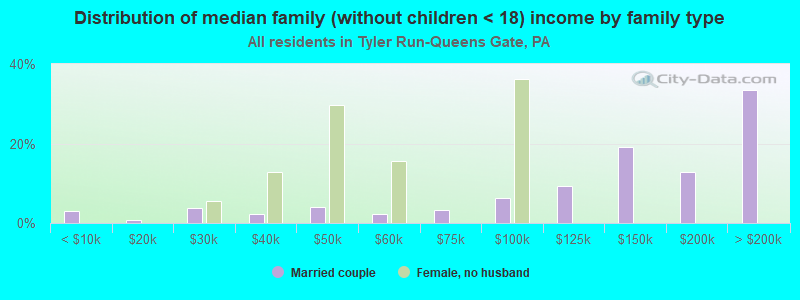
Number of families with income < $10k:| Tyler Run-Queens Gate: | 3.0% (31) |
| State: | 2.2% (56,136) |
Number of families with income $10k - 20k:| Tyler Run-Queens Gate: | 0.3% (3) |
| State: | 2.7% (69,032) |
Number of families with income $20k - 30k:| Tyler Run-Queens Gate: | 3.1% (32) |
| State: | 3.9% (100,065) |
Number of families with income $30k - 40k:| Tyler Run-Queens Gate: | 3.4% (35) |
| State: | 5.2% (134,367) |
Number of families with income $40k - 50k:| Tyler Run-Queens Gate: | 5.2% (53) |
| Pennsylvania: | 6.0% (154,327) |
Number of families with income $50k - 60k:| Tyler Run-Queens Gate: | 3.9% (39) |
| Pennsylvania: | 6.1% (157,983) |
Number of families with income $60k - 75k:| Tyler Run-Queens Gate: | 5.6% (58) |
| State: | 9.6% (249,292) |
Number of families with income $75k - 100k:| Tyler Run-Queens Gate: | 7.0% (71) |
| State: | 14.7% (379,316) |
Number of families with income $100k - 125k:| Tyler Run-Queens Gate: | 10.0% (102) |
| State: | 12.9% (333,626) |
Number of families with income $125k - 150k:| Tyler Run-Queens Gate: | 13.4% (137) |
| Pennsylvania: | 9.4% (243,915) |
Number of families with income $150k - 200k:| Tyler Run-Queens Gate: | 8.3% (85) |
| State: | 12.2% (314,926) |
Number of families with income > $200k:| Tyler Run-Queens Gate: | 36.7% (374) |
| State: | 15.1% (390,885) |
Median non-family income in Tyler Run-Queens Gate in 2022:| Tyler Run-Queens Gate: | $43,786 |
| State: | $44,251 |
Change in median non-family income between 2000 and 2022:| Tyler Run-Queens Gate, Pennsylvania: | +64.4% |
| Pennsylvania: | +94.2% |
Median per capita income in Tyler Run-Queens Gate in 2022:| Tyler Run-Queens Gate: | $50,754 |
| Pennsylvania: | $45,306 |
Change in median per capita income between 2000 and 2022:| Tyler Run-Queens Gate, Pennsylvania: | +93.0% |
| State: | +105.4% |
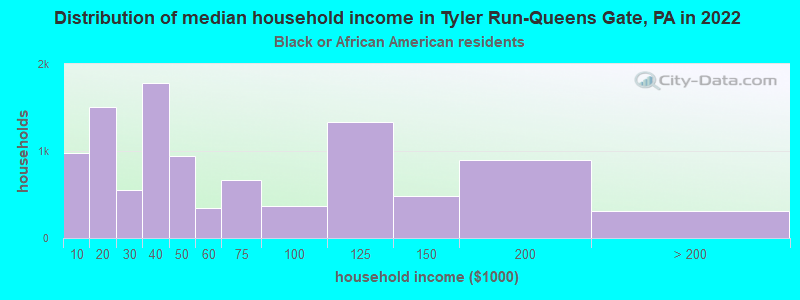
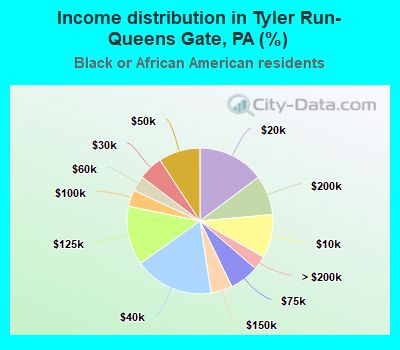
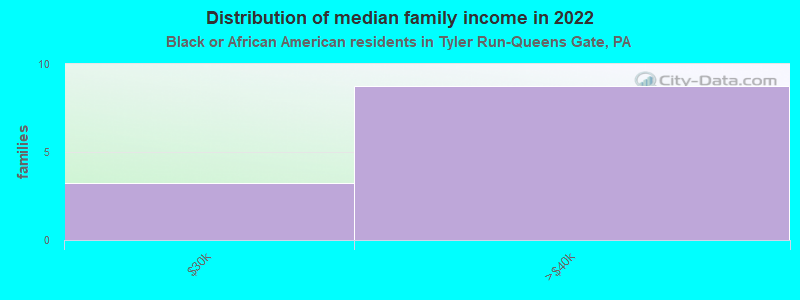
Income statistics for Black or African American residents
Median household income in Tyler Run-Queens Gate, PA in 2022:| Tyler Run-Queens Gate: | $45,443 |
| State: | $46,564 |
Change in median household income between 2000 and 2022:| Tyler Run-Queens Gate, Pennsylvania: | +50.0% |
| Pennsylvania: | +69.8% |
Number of households with income < $10k:| Tyler Run-Queens Gate: | 9.6% (980) |
| State: | 12.0% (64,705) |
Number of households with income $10k - 20k:| Tyler Run-Queens Gate: | 14.8% (1,501) |
| State: | 12.7% (68,459) |
Number of households with income $20k - 30k:| Tyler Run-Queens Gate: | 5.4% (551) |
| State: | 9.3% (49,778) |
Number of households with income $30k - 40k:| Tyler Run-Queens Gate: | 17.6% (1,787) |
| Pennsylvania: | 10.0% (53,629) |
Number of households with income $40k - 50k:| Tyler Run-Queens Gate: | 9.2% (940) |
| State: | 8.5% (45,601) |
Number of households with income $50k - 60k:| Tyler Run-Queens Gate: | 3.4% (347) |
| State: | 7.8% (41,725) |
Number of households with income $60k - 75k:| Tyler Run-Queens Gate: | 6.5% (665) |
| State: | 10.4% (55,653) |
Number of households with income $75k - 100k:| Tyler Run-Queens Gate: | 3.7% (372) |
| Pennsylvania: | 9.5% (51,281) |
Number of households with income $100k - 125k:| Tyler Run-Queens Gate: | 13.1% (1,334) |
| State: | 7.1% (38,125) |
Number of households with income $125k - 150k:| Tyler Run-Queens Gate: | 4.8% (484) |
| Pennsylvania: | 4.5% (24,172) |
Number of households with income $150k - 200k:| Tyler Run-Queens Gate: | 8.8% (899) |
| State: | 4.0% (21,749) |
Number of households with income > $200k:| Tyler Run-Queens Gate: | 3.0% (310) |
| State: | 4.2% (22,562) |
Aggregate household income in Tyler Run-Queens Gate in 2022: $6,537,727
Median family income in Tyler Run-Queens Gate in 2022:| Tyler Run-Queens Gate: | $81,967 |
| Pennsylvania: | $61,391 |
Number of families with income $20k - 30k:| Tyler Run-Queens Gate: | 27.1% (3) |
| Pennsylvania: | 7.3% (21,340) |
Number of families with income $30k - 40k:| Tyler Run-Queens Gate: | 72.9% (9) |
| State: | 9.2% (26,982) |
Median non-family income in Tyler Run-Queens Gate in 2022:| Tyler Run-Queens Gate: | $37,451 |
| Pennsylvania: | $30,767 |
Change in median non-family income between 2000 and 2022:| Tyler Run-Queens Gate, Pennsylvania: | +87.3% |
| State: | +75.1% |
Median per capita income in Tyler Run-Queens Gate in 2022:| Tyler Run-Queens Gate: | $27,870 |
| State: | $28,010 |
Change in median per capita income between 2000 and 2022:| Tyler Run-Queens Gate, Pennsylvania: | +94.3% |
| State: | +101.5% |
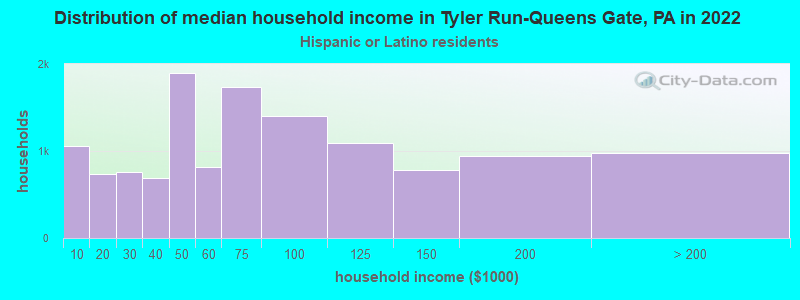
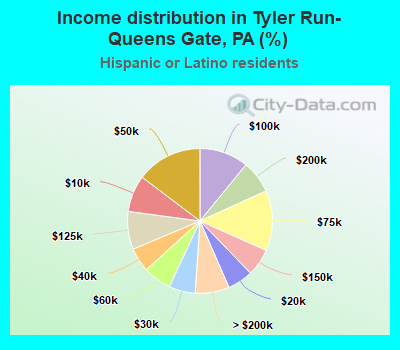
Income statistics for Hispanic or Latino residents
Median household income in Tyler Run-Queens Gate, PA in 2022:| Tyler Run-Queens Gate: | $65,041 |
| State: | $55,478 |
Change in median household income between 2000 and 2022:| Tyler Run-Queens Gate, Pennsylvania: | +108.1% |
| State: | +106.0% |
Number of households with income < $10k:| Tyler Run-Queens Gate: | 8.2% (1,055) |
| Pennsylvania: | 8.7% (29,517) |
Number of households with income $10k - 20k:| Tyler Run-Queens Gate: | 5.7% (735) |
| Pennsylvania: | 10.0% (33,785) |
Number of households with income $20k - 30k:| Tyler Run-Queens Gate: | 5.9% (760) |
| State: | 9.9% (33,399) |
Number of households with income $30k - 40k:| Tyler Run-Queens Gate: | 5.4% (695) |
| State: | 8.8% (29,878) |
Number of households with income $40k - 50k:| Tyler Run-Queens Gate: | 14.7% (1,891) |
| Pennsylvania: | 8.5% (28,549) |
Number of households with income $50k - 60k:| Tyler Run-Queens Gate: | 6.3% (812) |
| Pennsylvania: | 7.6% (25,792) |
Number of households with income $60k - 75k:| Tyler Run-Queens Gate: | 13.4% (1,731) |
| State: | 10.6% (35,808) |
Number of households with income $75k - 100k:| Tyler Run-Queens Gate: | 10.9% (1,405) |
| State: | 11.9% (40,287) |
Number of households with income $100k - 125k:| Tyler Run-Queens Gate: | 8.4% (1,088) |
| Pennsylvania: | 8.0% (27,028) |
Number of households with income $125k - 150k:| Tyler Run-Queens Gate: | 6.1% (784) |
| State: | 5.2% (17,622) |
Number of households with income $150k - 200k:| Tyler Run-Queens Gate: | 7.3% (942) |
| State: | 5.2% (17,563) |
Number of households with income > $200k:| Tyler Run-Queens Gate: | 7.6% (979) |
| State: | 5.5% (18,469) |
Aggregate household income in Tyler Run-Queens Gate in 2022: $3,866,613
Median non-family income in Tyler Run-Queens Gate in 2022:| Tyler Run-Queens Gate: | $86,510 |
| State: | $34,664 |
Median per capita income in Tyler Run-Queens Gate in 2022:| Tyler Run-Queens Gate: | $77,547 |
| State: | $23,829 |
Change in median per capita income between 2000 and 2022:| Tyler Run-Queens Gate, Pennsylvania: | +141.8% |
| State: | +116.4% |
Income statistics for other residents
Number of households with income < $10k:| Tyler Run-Queens Gate: | 7.7% (3) |
| State: | 9.2% (14,206) |
Number of households with income $10k - 20k:| Tyler Run-Queens Gate: | 7.7% (3) |
| Pennsylvania: | 11.0% (17,038) |
Number of households with income $20k - 30k:| Tyler Run-Queens Gate: | 7.7% (3) |
| Pennsylvania: | 11.0% (17,000) |
Number of households with income $30k - 40k:| Tyler Run-Queens Gate: | 7.7% (3) |
| Pennsylvania: | 11.0% (17,022) |
Number of households with income $40k - 50k:| Tyler Run-Queens Gate: | 7.7% (3) |
| State: | 7.7% (11,829) |
Number of households with income $50k - 60k:| Tyler Run-Queens Gate: | 7.7% (3) |
| State: | 8.0% (12,320) |
Number of households with income $60k - 75k:| Tyler Run-Queens Gate: | 10.3% (4) |
| State: | 8.8% (13,590) |
Number of households with income $75k - 100k:| Tyler Run-Queens Gate: | 10.3% (4) |
| State: | 10.5% (16,166) |
Number of households with income $100k - 125k:| Tyler Run-Queens Gate: | 10.3% (4) |
| Pennsylvania: | 8.0% (12,371) |
Number of households with income $125k - 150k:| Tyler Run-Queens Gate: | 5.1% (2) |
| Pennsylvania: | 4.0% (6,190) |
Number of households with income $150k - 200k:| Tyler Run-Queens Gate: | 7.7% (3) |
| State: | 5.1% (7,862) |
Number of households with income > $200k:| Tyler Run-Queens Gate: | 10.3% (4) |
| State: | 5.6% (8,691) |
Aggregate household income in Tyler Run-Queens Gate in 2022: $4,345,850
Median non-family income in Tyler Run-Queens Gate in 2022:| Tyler Run-Queens Gate: | $27,382 |
| Pennsylvania: | $29,531 |
Change in median non-family income between 2000 and 2022:| Tyler Run-Queens Gate, Pennsylvania: | +68.5% |
| State: | +77.5% |
Median per capita income in Tyler Run-Queens Gate in 2022:| Tyler Run-Queens Gate: | $54,892 |
| Pennsylvania: | $24,779 |