The median household income in Tupelo, OK in 2022 was $34,237, which was 74.3% less than the median annual income of $59,673 across the entire state of Oklahoma. Compared to the median income of $17,000 in 2000 this represents an increase of 50.3%. The per capita income in 2022 was $17,926, which means an increase of 50.6% compared to 2000 when it was $8,852.
Whole page based on the data from 2000 / 2022 when the population of Tupelo, Oklahoma was 377 / 393
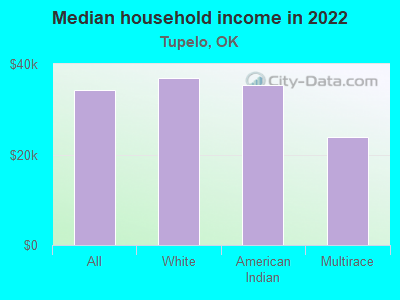
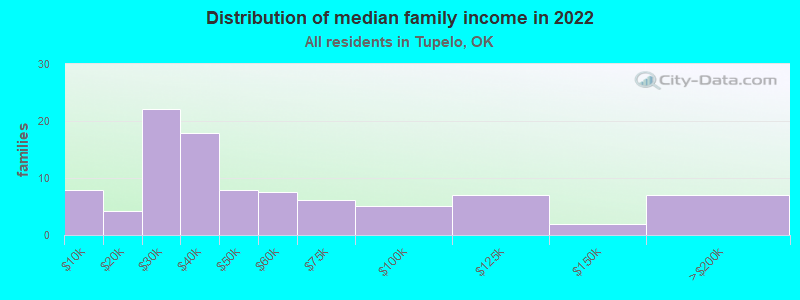
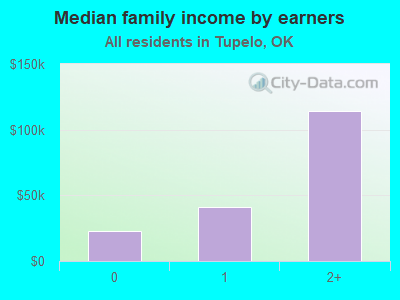
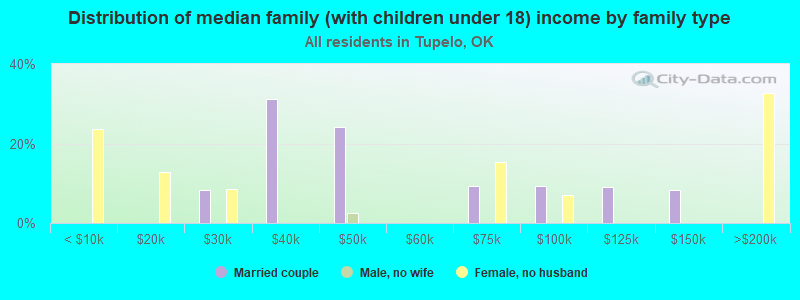
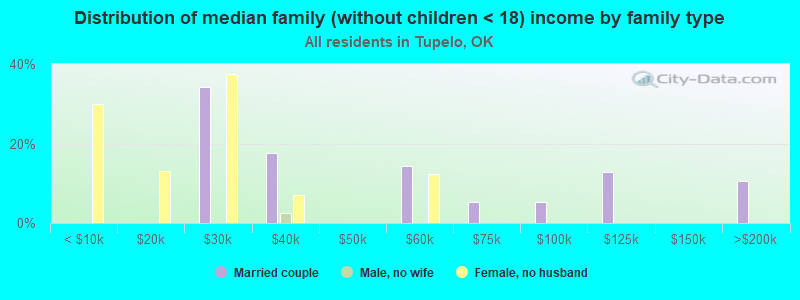
Income statistics for all residents
Median household income in Tupelo, OK in 2022:
Tupelo:
$34,238
Oklahoma:
$59,673
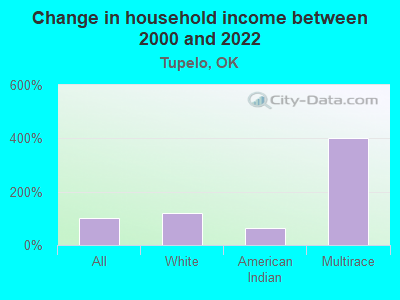
Change in median household income between 2000 and 2022:
Tupelo, Oklahoma:
+101.4%
State:
+78.7%
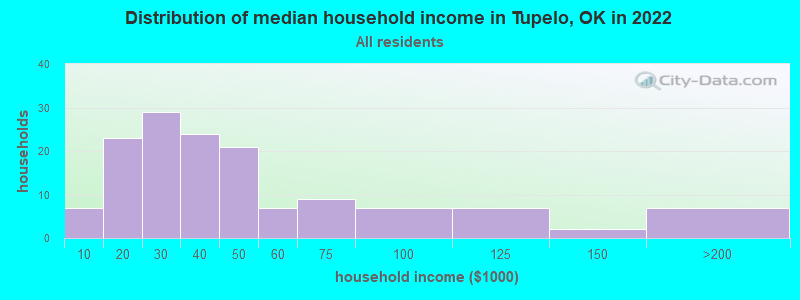
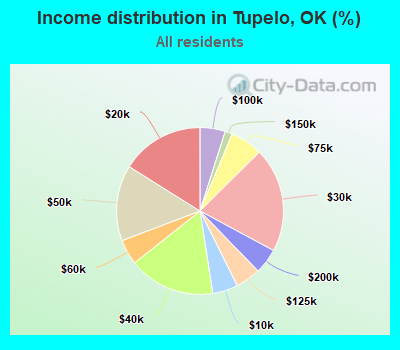
Number of households with income < $10k:
Tupelo:
4.9% (7)
State:
6.4% (100,950)
Number of households with income $10k - 20k:
Tupelo:
16.1% (23)
State:
8.8% (137,709)
Number of households with income $20k - 30k:
Tupelo:
20.3% (29)
Oklahoma:
9.1% (143,661)
Number of households with income $30k - 40k:
Tupelo:
16.8% (24)
Oklahoma:
9.0% (141,098)
Number of households with income $40k - 50k:
Tupelo:
14.7% (21)
State:
8.9% (140,217)
Number of households with income $50k - 60k:
Tupelo:
4.9% (7)
Oklahoma:
8.1% (126,882)
Number of households with income $60k - 75k:
Tupelo:
6.3% (9)
State:
10.0% (157,916)
Number of households with income $75k - 100k:
Tupelo:
4.9% (7)
State:
12.4% (195,015)
Number of households with income $100k - 125k:
Tupelo:
4.9% (7)
Oklahoma:
9.0% (141,779)
Number of households with income $125k - 150k:
Tupelo:
1.4% (2)
Oklahoma:
5.8% (91,594)
Number of households with income $150k - 200k:
Tupelo:
4.9% (7)
State:
6.3% (98,589)
Number of households with income > $200k:
Tupelo:
0.0% (0)
Oklahoma:
6.2% (97,770)
Aggregate household income in Tupelo in 2022: $6,699,723
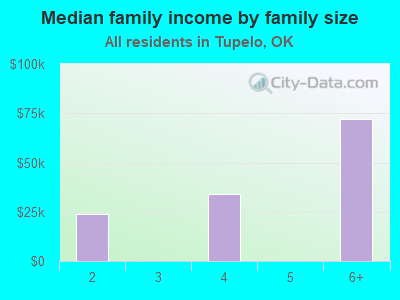
Median family income in Tupelo in 2022:
Tupelo:
$34,970
Oklahoma:
$75,476
Number of families with income < $10k:
Tupelo:
8.4% (8)
State:
4.2% (42,724)
Number of families with income $10k - 20k:
Tupelo:
4.4% (4)
Oklahoma:
4.9% (49,571)
Number of families with income $20k - 30k:
Tupelo:
23.3% (22)
State:
6.3% (64,367)
Number of families with income $30k - 40k:
Tupelo:
18.9% (18)
Oklahoma:
7.5% (76,467)
Number of families with income $40k - 50k:
Tupelo:
8.3% (8)
Oklahoma:
8.3% (84,578)
Number of families with income $50k - 60k:
Tupelo:
7.9% (8)
Oklahoma:
7.8% (79,642)
Number of families with income $60k - 75k:
Tupelo:
6.5% (6)
State:
10.6% (108,169)
Number of families with income $75k - 100k:
Tupelo:
5.4% (5)
State:
14.6% (148,857)
Number of families with income $100k - 125k:
Tupelo:
7.4% (7)
Oklahoma:
11.2% (113,480)
Number of families with income $125k - 150k:
Tupelo:
2.0% (2)
Oklahoma:
7.6% (77,253)
Number of families with income $150k - 200k:
Tupelo:
7.4% (7)
Oklahoma:
8.4% (85,947)
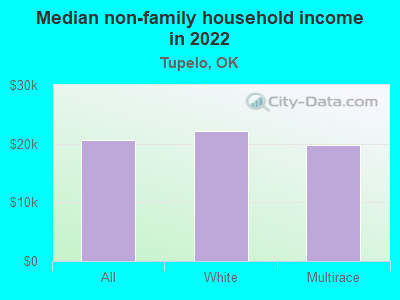
Median non-family income in Tupelo in 2022:
Tupelo:
$20,661
State:
$35,419
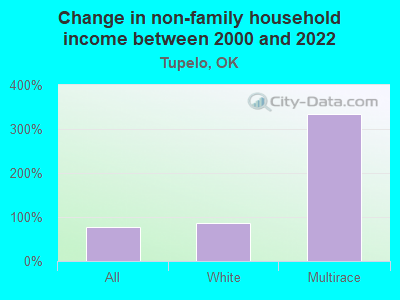
Change in median non-family income between 2000 and 2022:
Tupelo, Oklahoma:
+77.1%
State:
+83.2%
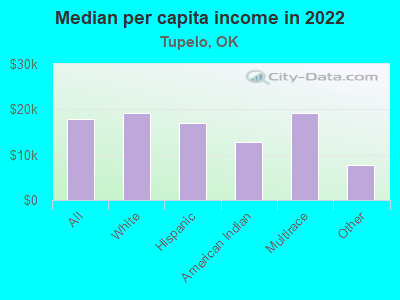
Median per capita income in Tupelo in 2022:
Tupelo:
$17,927
Oklahoma:
$32,930
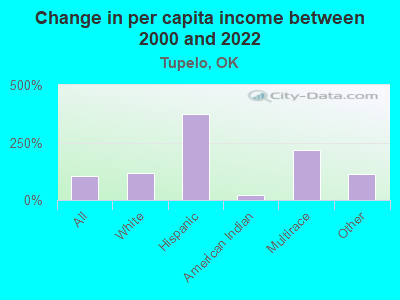
Change in median per capita income between 2000 and 2022:
Tupelo, Oklahoma:
+102.5%
State:
+86.6%
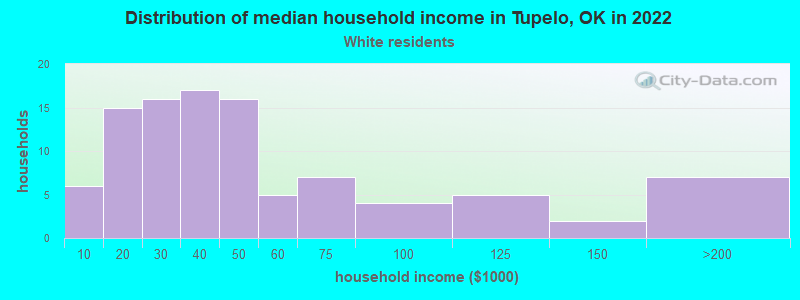
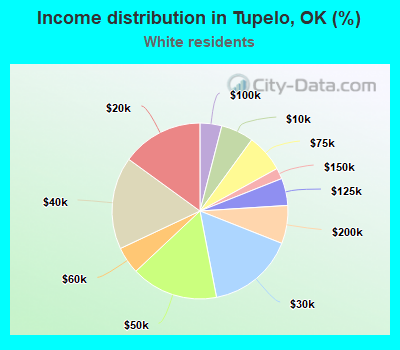
Income statistics for White residents
Median household income in Tupelo, OK in 2022:
Tupelo:
$36,946
State:
$63,444
Change in median household income between 2000 and 2022:
Tupelo, Oklahoma:
+118.9%
Oklahoma:
+79.3%
Number of households with income < $10k:
Tupelo:
6.0% (6)
Oklahoma:
5.5% (60,994)
Number of households with income $10k - 20k:
Tupelo:
15.0% (15)
State:
8.2% (91,263)
Number of households with income $20k - 30k:
Tupelo:
16.0% (16)
Oklahoma:
8.7% (96,988)
Number of households with income $30k - 40k:
Tupelo:
17.0% (17)
State:
8.4% (93,121)
Number of households with income $40k - 50k:
Tupelo:
16.0% (16)
Oklahoma:
8.6% (95,446)
Number of households with income $50k - 60k:
Tupelo:
5.0% (5)
State:
7.9% (87,723)
Number of households with income $60k - 75k:
Tupelo:
7.0% (7)
State:
9.9% (109,955)
Number of households with income $75k - 100k:
Tupelo:
4.0% (4)
State:
12.9% (143,880)
Number of households with income $100k - 125k:
Tupelo:
5.0% (5)
Oklahoma:
9.7% (107,851)
Number of households with income $125k - 150k:
Tupelo:
2.0% (2)
State:
6.3% (69,802)
Number of households with income $150k - 200k:
Tupelo:
7.0% (7)
Oklahoma:
6.9% (76,863)
Number of households with income > $200k:
Tupelo:
0.0% (0)
State:
7.0% (78,099)
Aggregate household income in Tupelo in 2022: $4,960,854
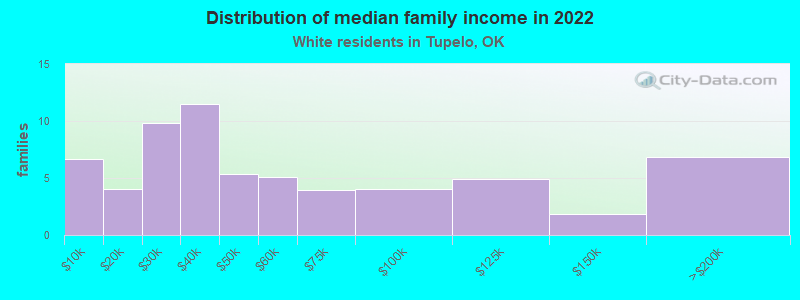
Median family income in Tupelo in 2022:
Tupelo:
$42,259
Oklahoma:
$82,251
Number of families with income < $10k:
Tupelo:
10.5% (7)
State:
3.4% (24,057)
Number of families with income $10k - 20k:
Tupelo:
6.2% (4)
Oklahoma:
4.1% (29,440)
Number of families with income $20k - 30k:
Tupelo:
15.3% (10)
State:
5.7% (40,670)
Number of families with income $30k - 40k:
Tupelo:
17.9% (11)
Oklahoma:
6.5% (46,540)
Number of families with income $40k - 50k:
Tupelo:
8.4% (5)
Oklahoma:
7.7% (55,082)
Number of families with income $50k - 60k:
Tupelo:
8.0% (5)
Oklahoma:
7.5% (53,408)
Number of families with income $60k - 75k:
Tupelo:
6.1% (4)
Oklahoma:
10.4% (74,624)
Number of families with income $75k - 100k:
Tupelo:
6.2% (4)
Oklahoma:
15.3% (109,679)
Number of families with income $100k - 125k:
Tupelo:
7.7% (5)
State:
12.0% (86,208)
Number of families with income $125k - 150k:
Tupelo:
2.9% (2)
Oklahoma:
8.3% (59,328)
Number of families with income $150k - 200k:
Tupelo:
10.7% (7)
Oklahoma:
9.4% (67,640)
Median non-family income in Tupelo in 2022:
Tupelo:
$22,161
Oklahoma:
$36,941
Change in median non-family income between 2000 and 2022:
Tupelo, Oklahoma:
+86.6%
Oklahoma:
+83.5%
Median per capita income in Tupelo in 2022:
Tupelo:
$19,095
State:
$37,390
Change in median per capita income between 2000 and 2022:
Tupelo, Oklahoma:
+116.0%
State:
+92.4%
Income statistics for Hispanic or Latino residents
Aggregate household income in Tupelo in 2022: $275,017
Median per capita income in Tupelo in 2022:
Tupelo:
$17,010
State:
$19,473
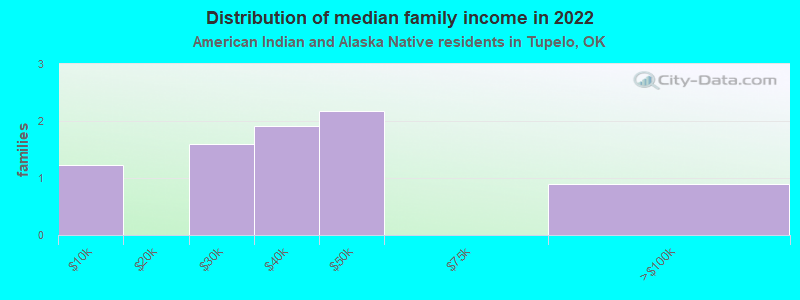
Income statistics for American Indian and Alaska Native residents
Median household income in Tupelo, OK in 2022:
Tupelo:
$35,408
Oklahoma:
$53,261
Change in median household income between 2000 and 2022:
Tupelo, Oklahoma:
+61.9%
Oklahoma:
+94.7%
Aggregate household income in Tupelo in 2022: $411,450
Median family income in Tupelo in 2022:
Tupelo:
$32,183
Oklahoma:
$61,590
Median per capita income in Tupelo in 2022:
Tupelo:
$12,868
State:
$25,549
Change in median per capita income between 2000 and 2022:
Tupelo, Oklahoma:
+22.7%
Oklahoma:
+118.7%
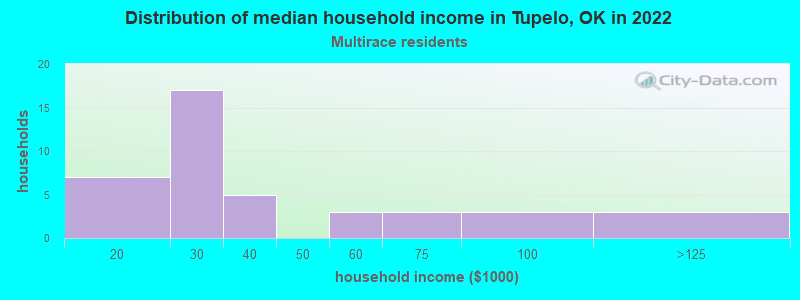
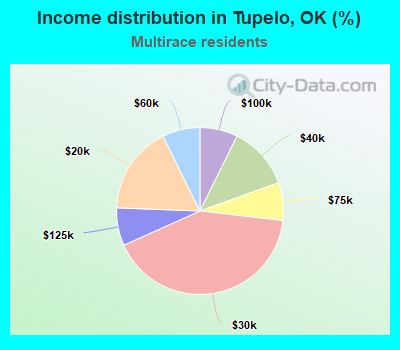
Income statistics for Multirace residents
Median household income in Tupelo, OK in 2022:
Tupelo:
$23,771
State:
$53,626
Number of households with income < $10k:
Tupelo:
0.0% (0)
Oklahoma:
6.8% (11,975)
Number of households with income $10k - 20k:
Tupelo:
17.1% (7)
State:
8.9% (15,797)
Number of households with income $20k - 30k:
Tupelo:
41.5% (17)
State:
10.2% (18,071)
Number of households with income $30k - 40k:
Tupelo:
12.2% (5)
State:
11.0% (19,477)
Number of households with income $40k - 50k:
Tupelo:
0.0% (0)
State:
9.3% (16,501)
Number of households with income $50k - 60k:
Tupelo:
7.3% (3)
State:
8.9% (15,635)
Number of households with income $60k - 75k:
Tupelo:
7.3% (3)
State:
10.9% (19,250)
Number of households with income $75k - 100k:
Tupelo:
7.3% (3)
Oklahoma:
11.5% (20,279)
Number of households with income $100k - 125k:
Tupelo:
7.3% (3)
Oklahoma:
8.0% (14,067)
Number of households with income $125k - 150k:
Tupelo:
0.0% (0)
Oklahoma:
4.9% (8,612)
Number of households with income $150k - 200k:
Tupelo:
0.0% (0)
Oklahoma:
5.0% (8,897)
Number of households with income > $200k:
Tupelo:
0.0% (0)
State:
4.5% (7,970)
Aggregate household income in Tupelo in 2022: $1,558,348
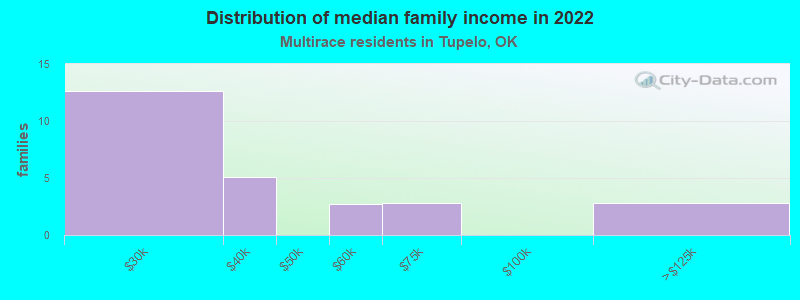
Median family income in Tupelo in 2022:
Tupelo:
$26,352
State:
$62,946
Number of families with income $20k - 30k:
Tupelo:
48.6% (13)
State:
7.7% (9,202)
Number of families with income $30k - 40k:
Tupelo:
19.4% (5)
Oklahoma:
10.8% (12,890)
Number of families with income $50k - 60k:
Tupelo:
10.5% (3)
Oklahoma:
7.7% (9,220)
Number of families with income $60k - 75k:
Tupelo:
10.6% (3)
Oklahoma:
11.3% (13,582)
Number of families with income $100k - 125k:
Tupelo:
10.9% (3)
State:
10.2% (12,250)
Median non-family income in Tupelo in 2022:
Tupelo:
$19,831
State:
$34,773
Median per capita income in Tupelo in 2022:
Tupelo:
$19,173
Oklahoma:
$23,085
Income statistics for other residents
Median per capita income in Tupelo in 2022:
Tupelo:
$7,675
State:
$21,007
Change in median per capita income between 2000 and 2022:
Tupelo, Oklahoma:
+113.2%
Oklahoma:
+119.2%
Discuss Tupelo, Oklahoma (OK) on our hugely popular Oklahoma forum.