The median household income in Tonawanda, NY in 2022 was $61,308, which was 29.8% less than the median annual income of $79,557 across the entire state of New York. Compared to the median income of $37,523 in 2000 this represents an increase of 38.8%. The per capita income in 2022 was $34,581, which means an increase of 45.7% compared to 2000 when it was $18,789.
Whole page based on the data from 2000 / 2022 when the population of Tonawanda, New York was 16,136 / 15,081
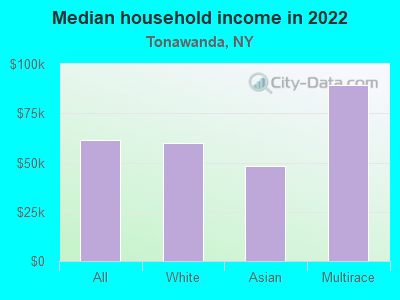
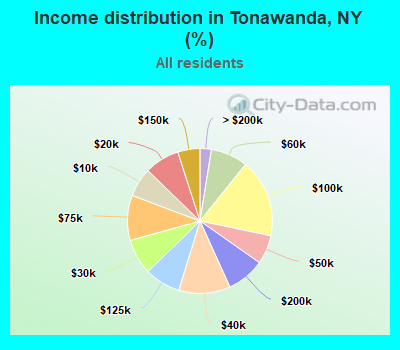
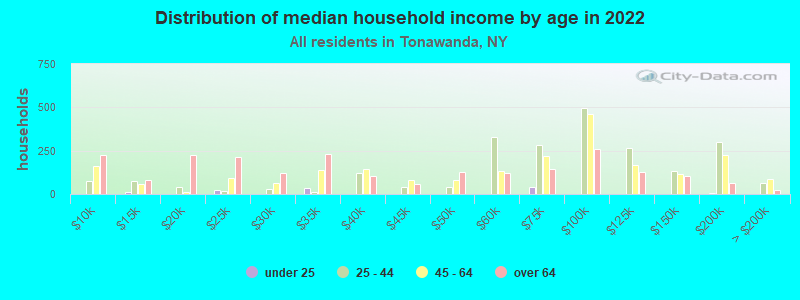
Income statistics for all residents
Median household income in Tonawanda, NY in 2022:
Tonawanda:
$61,309
State:
$79,557
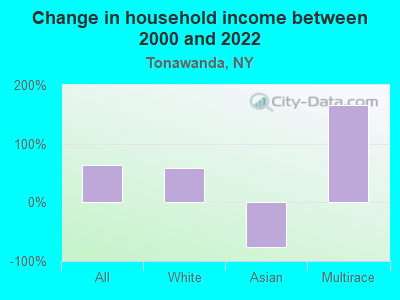
Change in median household income between 2000 and 2022:
Tonawanda, New York:
+63.4%
State:
+83.3%
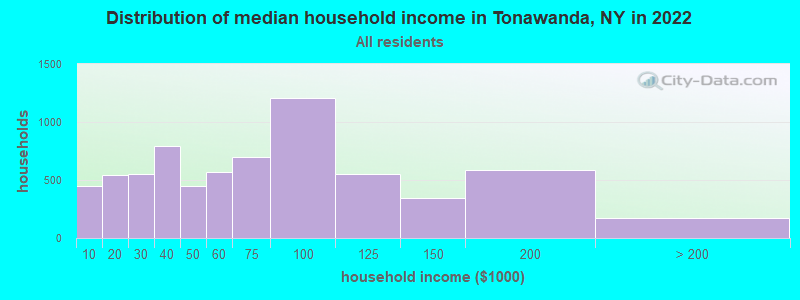
Number of households with income < $10k:
Tonawanda:
6.5% (447)
New York:
6.8% (527,598)
Number of households with income $10k - 20k:
Tonawanda:
7.8% (539)
New York:
7.4% (574,940)
Number of households with income $20k - 30k:
Tonawanda:
7.9% (548)
State:
6.7% (517,718)
Number of households with income $30k - 40k:
Tonawanda:
11.5% (794)
New York:
6.5% (506,674)
Number of households with income $40k - 50k:
Tonawanda:
6.5% (445)
State:
6.1% (470,439)
Number of households with income $50k - 60k:
Tonawanda:
8.2% (569)
State:
5.8% (454,042)
Number of households with income $60k - 75k:
Tonawanda:
10.1% (694)
State:
8.5% (657,508)
Number of households with income $75k - 100k:
Tonawanda:
17.5% (1,207)
State:
11.6% (899,824)
Number of households with income $100k - 125k:
Tonawanda:
8.0% (552)
New York:
9.3% (723,825)
Number of households with income $125k - 150k:
Tonawanda:
4.9% (341)
State:
7.1% (552,420)
Number of households with income $150k - 200k:
Tonawanda:
8.5% (586)
New York:
9.4% (727,051)
Number of households with income > $200k:
Tonawanda:
2.5% (175)
State:
15.0% (1,162,269)
Aggregate household income in Tonawanda in 2022: $520,027,061
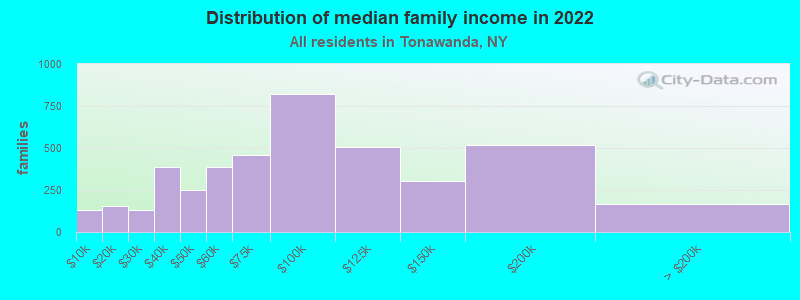
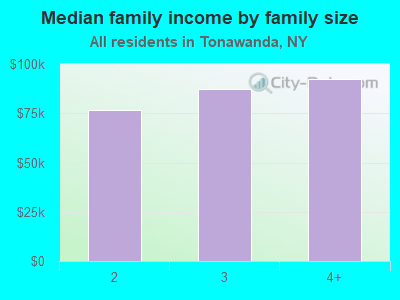
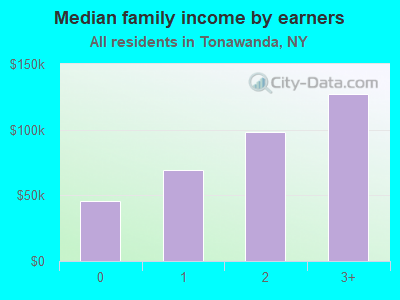
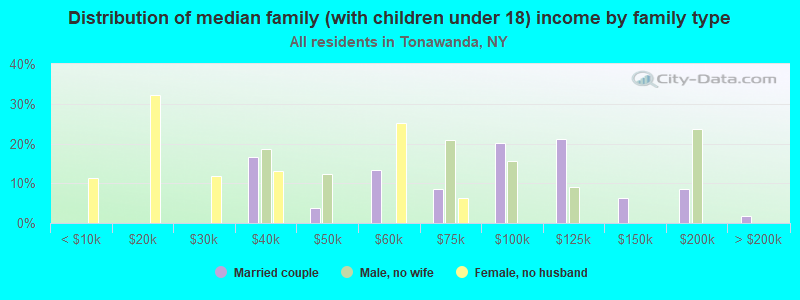
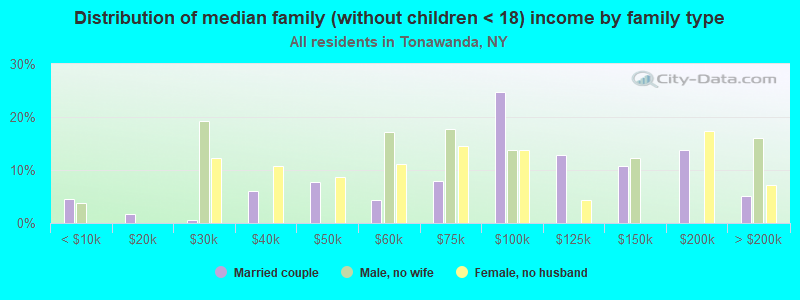
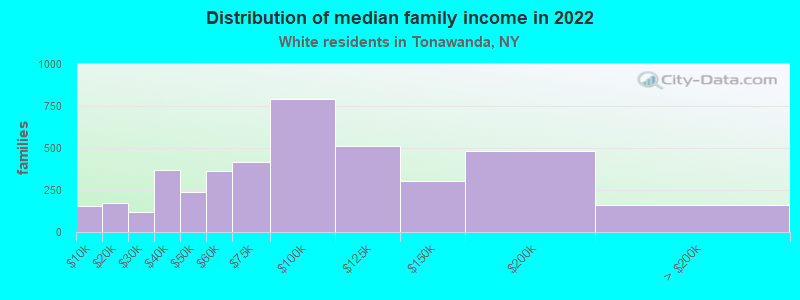
Median family income in Tonawanda in 2022:
Tonawanda:
$79,942
State:
$99,066
Number of families with income < $10k:
Tonawanda:
3.2% (133)
State:
4.2% (197,409)
Number of families with income $10k - 20k:
Tonawanda:
3.7% (156)
State:
4.3% (205,373)
Number of families with income $20k - 30k:
Tonawanda:
3.1% (131)
New York:
5.1% (241,229)
Number of families with income $30k - 40k:
Tonawanda:
9.1% (384)
State:
5.5% (259,233)
Number of families with income $40k - 50k:
Tonawanda:
5.9% (248)
State:
5.5% (259,113)
Number of families with income $50k - 60k:
Tonawanda:
9.2% (389)
New York:
5.4% (255,320)
Number of families with income $60k - 75k:
Tonawanda:
10.9% (461)
State:
8.2% (388,624)
Number of families with income $75k - 100k:
Tonawanda:
19.5% (821)
State:
12.3% (583,110)
Number of families with income $100k - 125k:
Tonawanda:
11.9% (504)
New York:
10.6% (500,579)
Number of families with income $125k - 150k:
Tonawanda:
7.2% (305)
New York:
8.5% (400,594)
Number of families with income $150k - 200k:
Tonawanda:
12.2% (516)
New York:
11.6% (551,650)
Number of families with income > $200k:
Tonawanda:
4.0% (168)
New York:
18.9% (895,998)
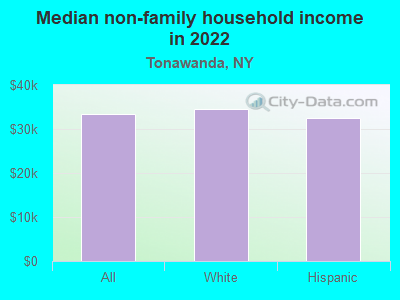
Median non-family income in Tonawanda in 2022:
Tonawanda:
$33,302
State:
$50,181
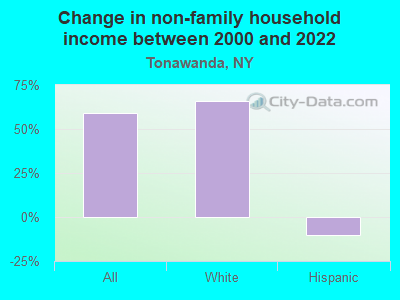
Change in median non-family income between 2000 and 2022:
Tonawanda, New York:
+59.0%
New York:
+85.4%
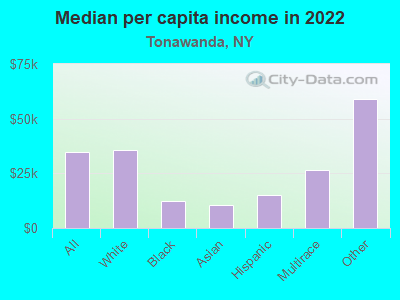
Median per capita income in Tonawanda in 2022:
Tonawanda:
$34,582
New York:
$47,421
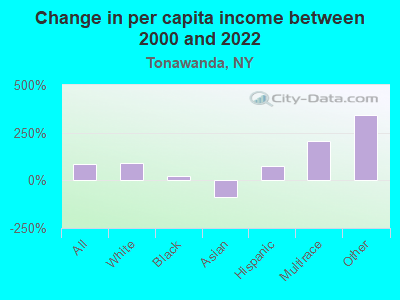
Change in median per capita income between 2000 and 2022:
Tonawanda, New York:
+84.1%
State:
+102.7%
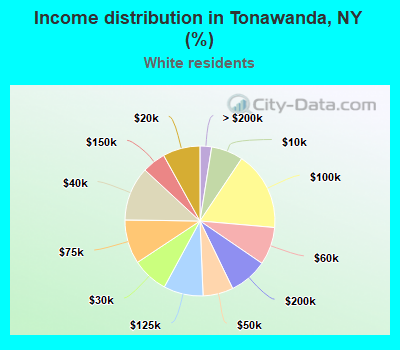
Income statistics for White residents
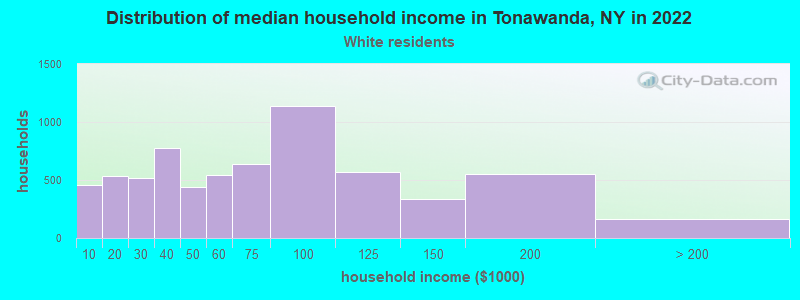
Median household income in Tonawanda, NY in 2022:
Tonawanda:
$60,142
State:
$89,408
Change in median household income between 2000 and 2022:
Tonawanda, New York:
+59.2%
State:
+85.5%
Number of households with income < $10k:
Tonawanda:
6.9% (459)
State:
4.8% (225,550)
Number of households with income $10k - 20k:
Tonawanda:
8.0% (537)
State:
6.1% (289,425)
Number of households with income $20k - 30k:
Tonawanda:
7.8% (521)
New York:
5.9% (280,254)
Number of households with income $30k - 40k:
Tonawanda:
11.7% (779)
State:
6.1% (288,263)
Number of households with income $40k - 50k:
Tonawanda:
6.5% (436)
New York:
5.9% (278,079)
Number of households with income $50k - 60k:
Tonawanda:
8.1% (544)
State:
5.7% (267,554)
Number of households with income $60k - 75k:
Tonawanda:
9.5% (636)
State:
8.4% (398,344)
Number of households with income $75k - 100k:
Tonawanda:
17.0% (1,135)
New York:
11.8% (554,841)
Number of households with income $100k - 125k:
Tonawanda:
8.5% (570)
State:
10.0% (469,794)
Number of households with income $125k - 150k:
Tonawanda:
5.1% (338)
State:
7.6% (360,467)
Number of households with income $150k - 200k:
Tonawanda:
8.3% (553)
State:
10.1% (477,078)
Number of households with income > $200k:
Tonawanda:
2.5% (168)
State:
17.6% (829,233)
Aggregate household income in Tonawanda in 2022: $495,807,019
Median family income in Tonawanda in 2022:
Tonawanda:
$80,130
State:
$115,170
Number of families with income < $10k:
Tonawanda:
3.8% (155)
State:
2.5% (68,851)
Number of families with income $10k - 20k:
Tonawanda:
4.2% (172)
State:
3.0% (83,127)
Number of families with income $20k - 30k:
Tonawanda:
3.0% (121)
New York:
3.5% (97,578)
Number of families with income $30k - 40k:
Tonawanda:
9.1% (370)
State:
4.1% (114,108)
Number of families with income $40k - 50k:
Tonawanda:
5.8% (238)
New York:
4.7% (130,902)
Number of families with income $50k - 60k:
Tonawanda:
8.9% (363)
New York:
4.9% (135,118)
Number of families with income $60k - 75k:
Tonawanda:
10.2% (415)
State:
7.8% (216,254)
Number of families with income $75k - 100k:
Tonawanda:
19.4% (793)
State:
12.4% (342,382)
Number of families with income $100k - 125k:
Tonawanda:
12.5% (511)
State:
11.4% (314,917)
Number of families with income $125k - 150k:
Tonawanda:
7.4% (301)
State:
9.4% (260,489)
Number of families with income $150k - 200k:
Tonawanda:
11.9% (484)
State:
13.2% (365,586)
Number of families with income > $200k:
Tonawanda:
3.9% (161)
New York:
23.2% (642,319)
Median non-family income in Tonawanda in 2022:
Tonawanda:
$34,446
State:
$54,783
Change in median non-family income between 2000 and 2022:
Tonawanda, New York:
+65.8%
State:
+87.9%
Median per capita income in Tonawanda in 2022:
Tonawanda:
$35,651
State:
$57,640
Change in median per capita income between 2000 and 2022:
Tonawanda, New York:
+91.4%
State:
+111.6%
Income statistics for Black or African American residents
Number of households with income < $10k:
Tonawanda:
0.0% (0)
State:
12.0% (128,500)
Number of households with income $10k - 20k:
Tonawanda:
0.0% (0)
State:
10.0% (107,541)
Number of households with income $20k - 30k:
Tonawanda:
0.0% (0)
New York:
8.4% (90,192)
Number of households with income $30k - 40k:
Tonawanda:
0.0% (0)
State:
7.4% (79,579)
Number of households with income $40k - 50k:
Tonawanda:
0.0% (0)
State:
6.8% (72,491)
Number of households with income $50k - 60k:
Tonawanda:
0.0% (0)
State:
6.7% (71,309)
Number of households with income $60k - 75k:
Tonawanda:
100.0% (29)
State:
8.9% (95,050)
Number of households with income $75k - 100k:
Tonawanda:
0.0% (0)
State:
11.5% (123,569)
Number of households with income $100k - 125k:
Tonawanda:
0.0% (0)
State:
8.1% (86,632)
Number of households with income $125k - 150k:
Tonawanda:
0.0% (0)
State:
6.0% (64,788)
Number of households with income $150k - 200k:
Tonawanda:
0.0% (0)
State:
7.2% (76,644)
Number of households with income > $200k:
Tonawanda:
0.0% (0)
State:
7.0% (75,062)
Aggregate household income in Tonawanda in 2022: $722,417
Median per capita income in Tonawanda in 2022:
Tonawanda:
$12,464
New York:
$31,947
Change in median per capita income between 2000 and 2022:
Tonawanda, New York:
+24.8%
State:
+106.1%
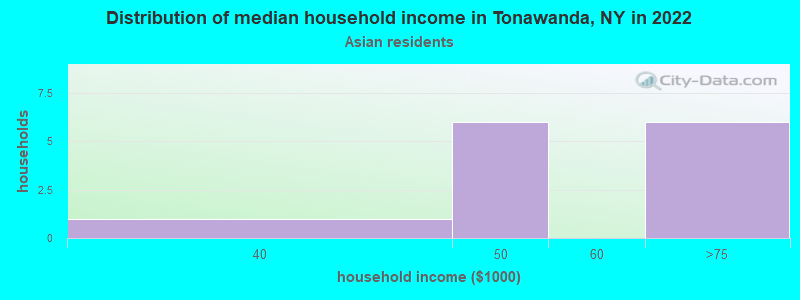
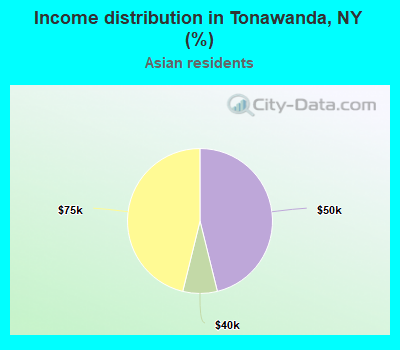
Income statistics for Asian residents
Median household income in Tonawanda, NY in 2022:
Tonawanda:
$48,359
State:
$89,947
Change in median household income between 2000 and 2022:: -75.8%
Tonawanda, New York:
-75.8%
State:
+98.1%
Number of households with income < $10k:
Tonawanda:
0.0% (0)
State:
6.9% (42,537)
Number of households with income $10k - 20k:
Tonawanda:
0.0% (0)
New York:
7.3% (44,745)
Number of households with income $20k - 30k:
Tonawanda:
0.0% (0)
State:
6.2% (38,249)
Number of households with income $30k - 40k:
Tonawanda:
7.7% (1)
New York:
5.5% (33,993)
Number of households with income $40k - 50k:
Tonawanda:
46.2% (6)
State:
4.8% (29,795)
Number of households with income $50k - 60k:
Tonawanda:
0.0% (0)
New York:
5.2% (32,100)
Number of households with income $60k - 75k:
Tonawanda:
46.2% (6)
State:
7.3% (44,615)
Number of households with income $75k - 100k:
Tonawanda:
0.0% (0)
State:
10.8% (66,687)
Number of households with income $100k - 125k:
Tonawanda:
0.0% (0)
State:
8.2% (50,233)
Number of households with income $125k - 150k:
Tonawanda:
0.0% (0)
State:
7.2% (44,299)
Number of households with income $150k - 200k:
Tonawanda:
0.0% (0)
State:
10.4% (63,837)
Number of households with income > $200k:
Tonawanda:
0.0% (0)
State:
20.1% (123,891)
Aggregate household income in Tonawanda in 2022: $1,116,956
Median per capita income in Tonawanda in 2022:
Tonawanda:
$10,616
New York:
$46,726
Change in median per capita income between 2000 and 2022:: -87.7%
Tonawanda, New York:
-87.7%
State:
+126.6%
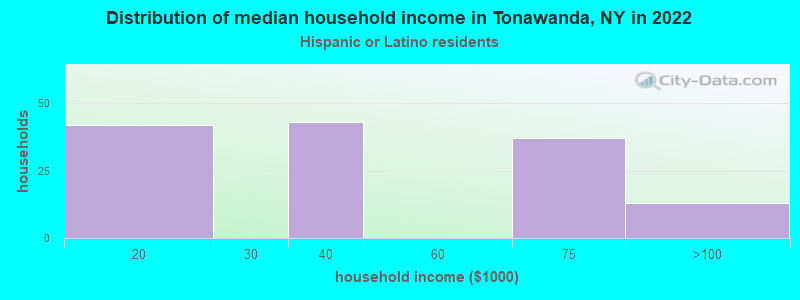
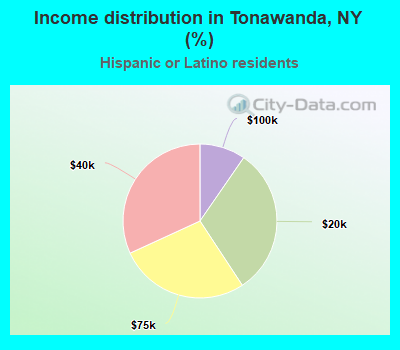
Income statistics for Hispanic or Latino residents
Number of households with income < $10k:
Tonawanda:
0.0% (0)
New York:
9.9% (127,185)
Number of households with income $10k - 20k:
Tonawanda:
31.1% (42)
New York:
10.7% (136,699)
Number of households with income $20k - 30k:
Tonawanda:
0.0% (0)
State:
8.1% (102,991)
Number of households with income $30k - 40k:
Tonawanda:
31.9% (43)
New York:
7.8% (100,149)
Number of households with income $40k - 50k:
Tonawanda:
0.0% (0)
State:
6.9% (87,760)
Number of households with income $50k - 60k:
Tonawanda:
0.0% (0)
State:
6.3% (80,968)
Number of households with income $60k - 75k:
Tonawanda:
27.4% (37)
State:
8.7% (110,631)
Number of households with income $75k - 100k:
Tonawanda:
9.6% (13)
New York:
11.2% (142,787)
Number of households with income $100k - 125k:
Tonawanda:
0.0% (0)
New York:
8.2% (104,850)
Number of households with income $125k - 150k:
Tonawanda:
0.0% (0)
State:
6.3% (80,274)
Number of households with income $150k - 200k:
Tonawanda:
0.0% (0)
New York:
7.4% (95,117)
Number of households with income > $200k:
Tonawanda:
0.0% (0)
State:
8.6% (109,514)
Aggregate household income in Tonawanda in 2022: $5,813,279
Median non-family income in Tonawanda in 2022:
Tonawanda:
$32,480
State:
$34,000
Change in median non-family income between 2000 and 2022:: -10.4%
Tonawanda, New York:
-10.4%
State:
+93.9%
Median per capita income in Tonawanda in 2022:
Tonawanda:
$15,255
State:
$29,761
Change in median per capita income between 2000 and 2022:
Tonawanda, New York:
+77.3%
State:
+132.7%
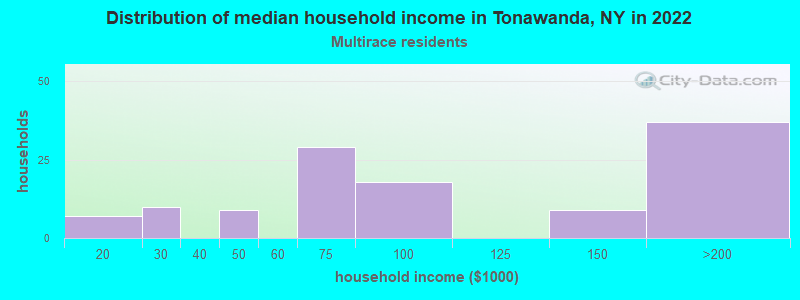
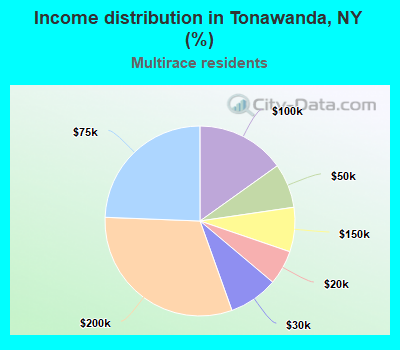
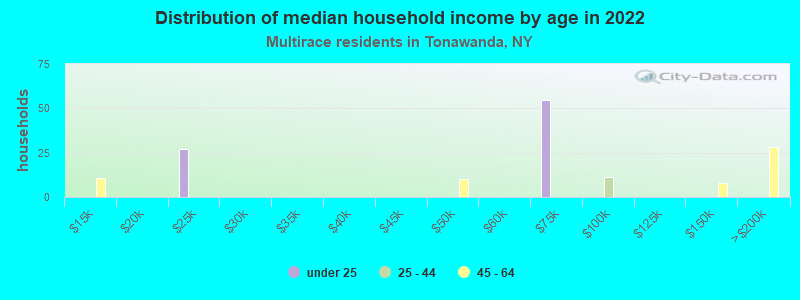
Income statistics for Multirace residents
Median household income in Tonawanda, NY in 2022:
Tonawanda:
$89,141
New York:
$73,557
Number of households with income < $10k:
Tonawanda:
0.0% (0)
New York:
8.9% (57,924)
Number of households with income $10k - 20k:
Tonawanda:
5.9% (7)
New York:
8.7% (56,590)
Number of households with income $20k - 30k:
Tonawanda:
8.4% (10)
New York:
7.1% (46,287)
Number of households with income $30k - 40k:
Tonawanda:
0.0% (0)
New York:
6.9% (45,132)
Number of households with income $40k - 50k:
Tonawanda:
7.6% (9)
State:
5.8% (37,946)
Number of households with income $50k - 60k:
Tonawanda:
0.0% (0)
New York:
5.6% (36,410)
Number of households with income $60k - 75k:
Tonawanda:
24.4% (29)
State:
7.8% (50,819)
Number of households with income $75k - 100k:
Tonawanda:
15.1% (18)
New York:
11.7% (76,024)
Number of households with income $100k - 125k:
Tonawanda:
0.0% (0)
State:
9.3% (60,635)
Number of households with income $125k - 150k:
Tonawanda:
7.6% (9)
State:
6.2% (40,533)
Number of households with income $150k - 200k:
Tonawanda:
31.1% (37)
New York:
8.6% (56,409)
Number of households with income > $200k:
Tonawanda:
0.0% (0)
State:
13.4% (87,442)
Aggregate household income in Tonawanda in 2022: $13,754,183
Median per capita income in Tonawanda in 2022:
Tonawanda:
$26,558
New York:
$36,931
Income statistics for other residents
Median per capita income in Tonawanda in 2022:
Tonawanda:
$58,769
State:
$26,975
Discuss Tonawanda, New York (NY) on our hugely popular New York forum.