The median household income in Sun Valley, PA in 2022 was $70,236, which was 2.2% less than the median annual income of $71,798 across the entire state of Pennsylvania. Compared to the median income of $46,257 in 2000 this represents an increase of 34.1%. The per capita income in 2022 was $30,827, which means an increase of 35.1% compared to 2000 when it was $20,011.
Whole page based on the data from 2000 / 2022 when the population of Sun Valley, Pennsylvania was 2,399 / 2,194
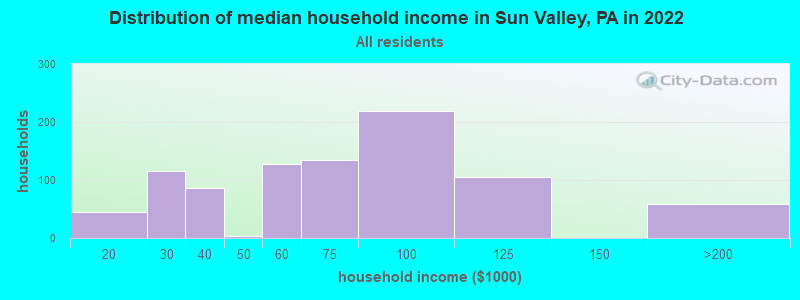
Income statistics for all residents
Median household income in Sun Valley, PA in 2022:
Sun Valley:
$70,237
State:
$71,798
Change in median household income between 2000 and 2022:
Sun Valley, Pennsylvania:
+51.8%
State:
+79.0%
Number of households with income < $10k:
Sun Valley:
0.0% (0)
State:
5.5% (291,562)
Number of households with income $10k - 20k:
Sun Valley:
4.9% (44)
Pennsylvania:
7.3% (384,726)
Number of households with income $20k - 30k:
Sun Valley:
12.9% (115)
State:
7.4% (389,464)
Number of households with income $30k - 40k:
Sun Valley:
9.7% (87)
State:
7.6% (402,138)
Number of households with income $40k - 50k:
Sun Valley:
0.4% (4)
State:
7.3% (387,945)
Number of households with income $50k - 60k:
Sun Valley:
14.2% (127)
State:
7.0% (372,468)
Number of households with income $60k - 75k:
Sun Valley:
15.1% (135)
State:
9.9% (524,786)
Number of households with income $75k - 100k:
Sun Valley:
24.5% (219)
State:
12.6% (666,253)
Number of households with income $100k - 125k:
Sun Valley:
11.7% (105)
State:
9.9% (526,402)
Number of households with income $125k - 150k:
Sun Valley:
0.0% (0)
State:
6.9% (362,702)
Number of households with income $150k - 200k:
Sun Valley:
6.5% (58)
State:
8.3% (440,827)
Number of households with income > $200k:
Sun Valley:
0.0% (0)
State:
10.3% (544,792)
Aggregate household income in Sun Valley in 2022: $65,050,944
Median family income in Sun Valley in 2022:
Sun Valley:
$77,045
Pennsylvania:
$93,029
Number of families with income < $10k:
Sun Valley:
0.7% (4)
State:
3.1% (101,868)
Number of families with income $10k - 20k:
Sun Valley:
1.0% (6)
Pennsylvania:
3.5% (115,881)
Number of families with income $20k - 30k:
Sun Valley:
10.8% (66)
State:
4.8% (156,521)
Number of families with income $40k - 50k:
Sun Valley:
0.6% (4)
State:
6.4% (211,380)
Number of families with income $50k - 60k:
Sun Valley:
22.0% (135)
State:
6.4% (209,910)
Number of families with income $60k - 75k:
Sun Valley:
12.1% (74)
State:
9.7% (318,991)
Number of families with income $75k - 100k:
Sun Valley:
29.5% (180)
Pennsylvania:
14.0% (461,021)
Number of families with income $100k - 125k:
Sun Valley:
14.3% (87)
State:
12.2% (400,961)
Number of families with income $150k - 200k:
Sun Valley:
9.0% (55)
State:
11.2% (367,642)
Median non-family income in Sun Valley in 2022:
Sun Valley:
$34,085
State:
$42,203
Change in median non-family income between 2000 and 2022:
Sun Valley, Pennsylvania:
+32.0%
State:
+90.1%
Median per capita income in Sun Valley in 2022:
Sun Valley:
$30,828
Pennsylvania:
$41,489
Change in median per capita income between 2000 and 2022:
Sun Valley, Pennsylvania:
+54.1%
State:
+98.7%
Income statistics for White residents
Median household income in Sun Valley, PA in 2022:
Sun Valley:
$70,936
Pennsylvania:
$76,765
Change in median household income between 2000 and 2022:
Sun Valley, Pennsylvania:
+56.0%
State:
+84.3%
Number of households with income < $10k:
Sun Valley:
0.0% (0)
State:
4.3% (179,792)
Number of households with income $10k - 20k:
Sun Valley:
6.5% (45)
State:
6.5% (268,738)
Number of households with income $20k - 30k:
Sun Valley:
7.1% (49)
Pennsylvania:
7.0% (288,138)
Number of households with income $30k - 40k:
Sun Valley:
9.1% (63)
State:
7.2% (300,208)
Number of households with income $40k - 50k:
Sun Valley:
0.6% (4)
State:
7.2% (298,756)
Number of households with income $50k - 60k:
Sun Valley:
13.2% (92)
Pennsylvania:
6.8% (283,251)
Number of households with income $60k - 75k:
Sun Valley:
17.8% (124)
State:
9.9% (408,159)
Number of households with income $75k - 100k:
Sun Valley:
27.5% (191)
State:
13.2% (547,809)
Number of households with income $100k - 125k:
Sun Valley:
9.6% (67)
State:
10.5% (436,652)
Number of households with income $125k - 150k:
Sun Valley:
0.0% (0)
State:
7.3% (304,132)
Number of households with income $150k - 200k:
Sun Valley:
8.6% (60)
State:
9.0% (374,658)
Number of households with income > $200k:
Sun Valley:
0.0% (0)
State:
10.9% (452,618)
Aggregate household income in Sun Valley in 2022: $52,565,651
Median family income in Sun Valley in 2022:
Sun Valley:
$82,873
Pennsylvania:
$99,396
Number of families with income $10k - 20k:
Sun Valley:
1.4% (6)
Pennsylvania:
2.7% (69,032)
Number of families with income $40k - 50k:
Sun Valley:
0.7% (3)
State:
6.0% (154,327)
Number of families with income $50k - 60k:
Sun Valley:
21.8% (98)
State:
6.1% (157,983)
Number of families with income $60k - 75k:
Sun Valley:
15.4% (69)
Pennsylvania:
9.6% (249,292)
Number of families with income $75k - 100k:
Sun Valley:
35.8% (161)
State:
14.7% (379,316)
Number of families with income $100k - 125k:
Sun Valley:
12.2% (55)
Pennsylvania:
12.9% (333,626)
Number of families with income $150k - 200k:
Sun Valley:
12.6% (57)
State:
12.2% (314,926)
Median non-family income in Sun Valley in 2022:
Sun Valley:
$31,877
Pennsylvania:
$44,251
Change in median non-family income between 2000 and 2022:
Sun Valley, Pennsylvania:
+24.8%
State:
+94.2%
Median per capita income in Sun Valley in 2022:
Sun Valley:
$32,857
State:
$45,306
Change in median per capita income between 2000 and 2022:
Sun Valley, Pennsylvania:
+62.2%
Pennsylvania:
+105.4%
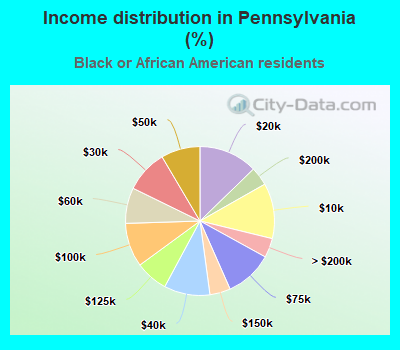
Income statistics for Black or African American residents
Number of households with income < $10k:
Sun Valley:
0.0% (0)
State:
12.0% (64,705)
Number of households with income $10k - 20k:
Sun Valley:
0.0% (0)
Pennsylvania:
12.7% (68,459)
Number of households with income $20k - 30k:
Sun Valley:
42.7% (73)
State:
9.3% (49,778)
Number of households with income $30k - 40k:
Sun Valley:
14.0% (24)
State:
10.0% (53,629)
Number of households with income $40k - 50k:
Sun Valley:
0.0% (0)
Pennsylvania:
8.5% (45,601)
Number of households with income $50k - 60k:
Sun Valley:
14.0% (24)
State:
7.8% (41,725)
Number of households with income $60k - 75k:
Sun Valley:
0.0% (0)
State:
10.4% (55,653)
Number of households with income $75k - 100k:
Sun Valley:
8.2% (14)
State:
9.5% (51,281)
Number of households with income $100k - 125k:
Sun Valley:
21.1% (36)
State:
7.1% (38,125)
Number of households with income $125k - 150k:
Sun Valley:
0.0% (0)
Pennsylvania:
4.5% (24,172)
Number of households with income $150k - 200k:
Sun Valley:
0.0% (0)
Pennsylvania:
4.0% (21,749)
Number of households with income > $200k:
Sun Valley:
0.0% (0)
Pennsylvania:
4.2% (22,562)
Aggregate household income in Sun Valley in 2022: $8,162,320
Median per capita income in Sun Valley in 2022:
Sun Valley:
$21,929
State:
$28,010
Change in median per capita income between 2000 and 2022:
Sun Valley, Pennsylvania:
+16.3%
Pennsylvania:
+101.5%
Income statistics for Hispanic or Latino residents
Number of households with income < $10k:
Sun Valley:
0.0% (0)
Pennsylvania:
8.7% (29,517)
Number of households with income $10k - 20k:
Sun Valley:
0.0% (0)
State:
10.0% (33,785)
Number of households with income $20k - 30k:
Sun Valley:
0.0% (0)
Pennsylvania:
9.9% (33,399)
Number of households with income $30k - 40k:
Sun Valley:
0.0% (0)
Pennsylvania:
8.8% (29,878)
Number of households with income $40k - 50k:
Sun Valley:
0.0% (0)
State:
8.5% (28,549)
Number of households with income $50k - 60k:
Sun Valley:
0.0% (0)
State:
7.6% (25,792)
Number of households with income $60k - 75k:
Sun Valley:
100.0% (43)
State:
10.6% (35,808)
Number of households with income $75k - 100k:
Sun Valley:
0.0% (0)
State:
11.9% (40,287)
Number of households with income $100k - 125k:
Sun Valley:
0.0% (0)
State:
8.0% (27,028)
Number of households with income $125k - 150k:
Sun Valley:
0.0% (0)
Pennsylvania:
5.2% (17,622)
Number of households with income $150k - 200k:
Sun Valley:
0.0% (0)
Pennsylvania:
5.2% (17,563)
Number of households with income > $200k:
Sun Valley:
0.0% (0)
State:
5.5% (18,469)
Aggregate household income in Sun Valley in 2022: $10,219,426
Median per capita income in Sun Valley in 2022:
Sun Valley:
$24,854
State:
$23,829
Change in median per capita income between 2000 and 2022:
Sun Valley, Pennsylvania:
+63.3%
State:
+116.4%
Income statistics for Multirace residents
Number of households with income < $10k:
Sun Valley:
0.0% (0)
State:
7.8% (21,911)
Number of households with income $10k - 20k:
Sun Valley:
42.9% (6)
State:
8.2% (22,847)
Number of households with income $20k - 30k:
Sun Valley:
57.1% (8)
State:
8.7% (24,252)
Number of households with income $30k - 40k:
Sun Valley:
0.0% (0)
State:
7.3% (20,502)
Number of households with income $40k - 50k:
Sun Valley:
0.0% (0)
State:
7.7% (21,525)
Number of households with income $50k - 60k:
Sun Valley:
0.0% (0)
State:
8.6% (24,174)
Number of households with income $60k - 75k:
Sun Valley:
0.0% (0)
State:
11.9% (33,350)
Number of households with income $75k - 100k:
Sun Valley:
0.0% (0)
State:
11.5% (32,274)
Number of households with income $100k - 125k:
Sun Valley:
0.0% (0)
Pennsylvania:
8.3% (23,361)
Number of households with income $125k - 150k:
Sun Valley:
0.0% (0)
Pennsylvania:
5.3% (14,784)
Number of households with income $150k - 200k:
Sun Valley:
0.0% (0)
State:
6.9% (19,314)
Number of households with income > $200k:
Sun Valley:
0.0% (0)
Pennsylvania:
7.8% (21,759)
Aggregate household income in Sun Valley in 2022: $621,355,900
Median per capita income in Sun Valley in 2022:
Sun Valley:
$18,280
Pennsylvania:
$27,581
Change in median per capita income between 2000 and 2022:
Sun Valley, Pennsylvania:
+41.1%
State:
+139.6%
Discuss Sun Valley, Pennsylvania (PA) on our hugely popular Pennsylvania forum.