Southwest Shasta, California (CA) income map, earnings map, and wages data
The median household income in Southwest Shasta, CA in 2022 was $82,736, which was 10.7% less than the median annual income of $91,551 across the entire state of California. Compared to the median income of $41,607 in 2000 this represents an increase of 49.7%. The per capita income in 2022 was $48,296, which means an increase of 49.7% compared to 2000 when it was $24,276.
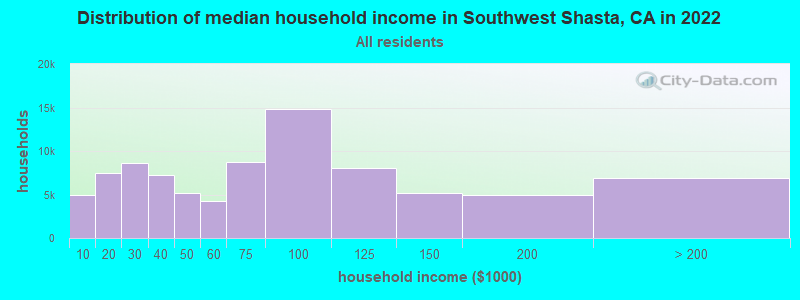
Income statistics for all residents
Median household income in Southwest Shasta, CA in 2022:| Southwest Shasta: | $82,737 |
| State: | $91,551 |
Change in median household income between 2000 and 2022:| Southwest Shasta, California: | +98.9% |
| State: | +92.8% |
Number of households with income < $10k:| Southwest Shasta: | 5.7% (4,961) |
| California: | 4.8% (654,370) |
Number of households with income $10k - 20k:| Southwest Shasta: | 8.7% (7,501) |
| State: | 5.8% (789,493) |
Number of households with income $20k - 30k:| Southwest Shasta: | 10.0% (8,596) |
| State: | 5.7% (778,318) |
Number of households with income $30k - 40k:| Southwest Shasta: | 8.3% (7,198) |
| State: | 5.8% (783,170) |
Number of households with income $40k - 50k:| Southwest Shasta: | 6.1% (5,228) |
| State: | 5.8% (781,352) |
Number of households with income $50k - 60k:| Southwest Shasta: | 4.9% (4,210) |
| State: | 5.6% (760,175) |
Number of households with income $60k - 75k:| Southwest Shasta: | 10.2% (8,769) |
| State: | 8.2% (1,104,699) |
Number of households with income $75k - 100k:| Southwest Shasta: | 17.2% (14,844) |
| State: | 12.0% (1,627,633) |
Number of households with income $100k - 125k:| Southwest Shasta: | 9.3% (8,058) |
| California: | 10.0% (1,358,619) |
Number of households with income $125k - 150k:| Southwest Shasta: | 6.0% (5,148) |
| State: | 7.6% (1,027,455) |
Number of households with income $150k - 200k:| Southwest Shasta: | 5.7% (4,936) |
| State: | 10.6% (1,439,811) |
Number of households with income > $200k:| Southwest Shasta: | 7.9% (6,847) |
| State: | 18.0% (2,445,491) |
Aggregate household income in Southwest Shasta in 2022: $264,845,173
Median family income in Southwest Shasta in 2022:| Southwest Shasta: | $98,314 |
| State: | $104,823 |
Median non-family income in Southwest Shasta in 2022:| Southwest Shasta: | $44,255 |
| State: | $59,348 |
Change in median non-family income between 2000 and 2022:| Southwest Shasta, California: | +88.5% |
| State: | +85.3% |
Median per capita income in Southwest Shasta in 2022:| Southwest Shasta: | $48,296 |
| State: | $46,661 |
Change in median per capita income between 2000 and 2022:| Southwest Shasta, California: | +98.9% |
| California: | +105.5% |
Income statistics for White residents
Median household income in Southwest Shasta, CA in 2022:| Southwest Shasta: | $88,092 |
| California: | $100,917 |
Change in median household income between 2000 and 2022:| Southwest Shasta, California: | +101.7% |
| State: | +96.8% |
Number of households with income < $10k:| Southwest Shasta: | 5.1% (3,734) |
| California: | 4.4% (284,109) |
Number of households with income $10k - 20k:| Southwest Shasta: | 8.3% (6,147) |
| California: | 5.3% (340,330) |
Number of households with income $20k - 30k:| Southwest Shasta: | 10.7% (7,872) |
| State: | 5.3% (343,145) |
Number of households with income $30k - 40k:| Southwest Shasta: | 7.7% (5,683) |
| State: | 5.1% (330,146) |
Number of households with income $40k - 50k:| Southwest Shasta: | 6.1% (4,495) |
| State: | 5.2% (335,310) |
Number of households with income $50k - 60k:| Southwest Shasta: | 4.8% (3,553) |
| California: | 5.1% (326,299) |
Number of households with income $60k - 75k:| Southwest Shasta: | 9.9% (7,326) |
| State: | 7.6% (487,640) |
Number of households with income $75k - 100k:| Southwest Shasta: | 17.4% (12,843) |
| State: | 11.5% (736,578) |
Number of households with income $100k - 125k:| Southwest Shasta: | 9.9% (7,310) |
| California: | 10.1% (648,782) |
Number of households with income $125k - 150k:| Southwest Shasta: | 5.9% (4,382) |
| California: | 7.8% (499,671) |
Number of households with income $150k - 200k:| Southwest Shasta: | 5.6% (4,093) |
| California: | 11.4% (729,603) |
Number of households with income > $200k:| Southwest Shasta: | 8.5% (6,291) |
| California: | 21.2% (1,364,246) |
Aggregate household income in Southwest Shasta in 2022: $217,219,905
Median family income in Southwest Shasta in 2022:| Southwest Shasta: | $103,655 |
| State: | $125,379 |
Number of families with income < $10k:| Southwest Shasta: | 1.3% (16) |
| State: | 2.2% (87,079) |
Number of families with income $10k - 20k:| Southwest Shasta: | 3.8% (47) |
| State: | 2.5% (97,716) |
Number of families with income $20k - 30k:| Southwest Shasta: | 3.8% (47) |
| State: | 3.5% (137,295) |
Number of families with income $30k - 40k:| Southwest Shasta: | 3.7% (45) |
| State: | 3.9% (152,947) |
Number of families with income $40k - 50k:| Southwest Shasta: | 3.3% (41) |
| State: | 4.3% (169,197) |
Number of families with income $50k - 60k:| Southwest Shasta: | 3.2% (40) |
| California: | 4.5% (176,192) |
Number of families with income $60k - 75k:| Southwest Shasta: | 7.8% (95) |
| State: | 7.0% (274,752) |
Number of families with income $75k - 100k:| Southwest Shasta: | 16.3% (201) |
| State: | 11.3% (445,632) |
Number of families with income $100k - 125k:| Southwest Shasta: | 17.6% (216) |
| California: | 10.7% (423,630) |
Number of families with income $125k - 150k:| Southwest Shasta: | 3.6% (45) |
| State: | 9.1% (357,408) |
Number of families with income $150k - 200k:| Southwest Shasta: | 2.9% (36) |
| State: | 13.5% (532,693) |
Number of families with income > $200k:| Southwest Shasta: | 32.6% (400) |
| State: | 27.6% (1,086,948) |
Median non-family income in Southwest Shasta in 2022:| Southwest Shasta: | $44,352 |
| State: | $62,819 |
Change in median non-family income between 2000 and 2022:| Southwest Shasta, California: | +89.2% |
| State: | +84.4% |
Median per capita income in Southwest Shasta in 2022:| Southwest Shasta: | $52,015 |
| California: | $61,706 |
Change in median per capita income between 2000 and 2022:| Southwest Shasta, California: | +108.7% |
| State: | +122.7% |
Income statistics for Asian residents
Median household income in Southwest Shasta, CA in 2022:| Southwest Shasta: | $15,135 |
| State: | $119,861 |
Change in median household income between 2000 and 2022:| Southwest Shasta, California: | +142.2% |
| State: | +116.5% |
Number of households with income < $10k:| Southwest Shasta: | 5.1% (5,997) |
| State: | 5.1% (106,273) |
Number of households with income $10k - 20k:| Southwest Shasta: | 4.9% (5,748) |
| State: | 4.9% (101,815) |
Number of households with income $20k - 30k:| Southwest Shasta: | 4.6% (5,328) |
| State: | 4.6% (94,414) |
Number of households with income $30k - 40k:| Southwest Shasta: | 4.1% (4,769) |
| State: | 4.1% (84,491) |
Number of households with income $40k - 50k:| Southwest Shasta: | 4.0% (4,614) |
| State: | 4.0% (81,758) |
Number of households with income $50k - 60k:| Southwest Shasta: | 3.9% (4,567) |
| California: | 3.9% (80,971) |
Number of households with income $60k - 75k:| Southwest Shasta: | 6.0% (7,008) |
| California: | 6.0% (124,194) |
Number of households with income $75k - 100k:| Southwest Shasta: | 9.7% (11,310) |
| State: | 9.7% (200,337) |
Number of households with income $100k - 125k:| Southwest Shasta: | 9.4% (10,918) |
| California: | 9.4% (193,488) |
Number of households with income $125k - 150k:| Southwest Shasta: | 7.7% (8,932) |
| State: | 7.7% (158,253) |
Number of households with income $150k - 200k:| Southwest Shasta: | 12.2% (14,227) |
| State: | 12.2% (252,139) |
Number of households with income > $200k:| Southwest Shasta: | 28.4% (33,099) |
| State: | 28.4% (586,641) |
Aggregate household income in Southwest Shasta in 2022: $20,128
Median family income in Southwest Shasta in 2022:| Southwest Shasta: | $10,819 |
| California: | $136,040 |
Median per capita income in Southwest Shasta in 2022:| Southwest Shasta: | $11,833 |
| California: | $58,824 |
Income statistics for Hispanic or Latino residents
Median household income in Southwest Shasta, CA in 2022:| Southwest Shasta: | $95,232 |
| State: | $75,698 |
Change in median household income between 2000 and 2022:| Southwest Shasta, California: | +83.6% |
| State: | +107.2% |
Number of households with income < $10k:| Southwest Shasta: | 11.6% (1,507) |
| State: | 4.3% (183,294) |
Number of households with income $10k - 20k:| Southwest Shasta: | 7.9% (1,019) |
| State: | 6.0% (253,903) |
Number of households with income $20k - 30k:| Southwest Shasta: | 7.1% (924) |
| California: | 6.8% (286,386) |
Number of households with income $30k - 40k:| Southwest Shasta: | 8.0% (1,033) |
| State: | 7.4% (313,728) |
Number of households with income $40k - 50k:| Southwest Shasta: | 12.4% (1,602) |
| California: | 7.4% (313,199) |
Number of households with income $50k - 60k:| Southwest Shasta: | 5.2% (678) |
| State: | 7.2% (305,366) |
Number of households with income $60k - 75k:| Southwest Shasta: | 14.4% (1,859) |
| State: | 10.3% (434,937) |
Number of households with income $75k - 100k:| Southwest Shasta: | 10.5% (1,358) |
| State: | 14.4% (607,302) |
Number of households with income $100k - 125k:| Southwest Shasta: | 4.6% (596) |
| State: | 10.6% (447,424) |
Number of households with income $125k - 150k:| Southwest Shasta: | 6.1% (785) |
| California: | 7.5% (316,022) |
Number of households with income $150k - 200k:| Southwest Shasta: | 6.0% (772) |
| State: | 9.2% (386,269) |
Number of households with income > $200k:| Southwest Shasta: | 6.2% (806) |
| State: | 8.8% (372,651) |
Aggregate household income in Southwest Shasta in 2022: $12,598,151
Median family income in Southwest Shasta in 2022:| Southwest Shasta: | $161,447 |
| State: | $77,589 |
Number of families with income < $10k:| Southwest Shasta: | 7.7% (44) |
| State: | 3.9% (129,468) |
Number of families with income $10k - 20k:| Southwest Shasta: | 10.1% (58) |
| California: | 4.6% (151,997) |
Number of families with income $20k - 30k:| Southwest Shasta: | 10.5% (60) |
| California: | 6.6% (216,764) |
Number of families with income $30k - 40k:| Southwest Shasta: | 8.4% (48) |
| California: | 7.6% (249,849) |
Number of families with income $40k - 50k:| Southwest Shasta: | 8.4% (48) |
| State: | 7.7% (254,822) |
Number of families with income $50k - 60k:| Southwest Shasta: | 11.0% (63) |
| California: | 7.4% (244,815) |
Number of families with income $60k - 75k:| Southwest Shasta: | 9.6% (55) |
| State: | 10.5% (345,838) |
Number of families with income $75k - 100k:| Southwest Shasta: | 9.5% (54) |
| State: | 14.9% (491,589) |
Number of families with income $100k - 125k:| Southwest Shasta: | 11.2% (64) |
| State: | 10.7% (355,400) |
Number of families with income $125k - 150k:| Southwest Shasta: | 1.6% (9) |
| State: | 7.8% (259,317) |
Number of families with income $150k - 200k:| Southwest Shasta: | 1.7% (10) |
| State: | 9.3% (306,566) |
Number of families with income > $200k:| Southwest Shasta: | 10.3% (59) |
| California: | 9.1% (299,984) |
Median non-family income in Southwest Shasta in 2022:| Southwest Shasta: | $72,451 |
| State: | $49,746 |
Change in median non-family income between 2000 and 2022:| Southwest Shasta, California: | +41.4% |
| State: | +100.7% |
Median per capita income in Southwest Shasta in 2022:| Southwest Shasta: | $44,656 |
| State: | $27,240 |
Change in median per capita income between 2000 and 2022:| Southwest Shasta, California: | +118.6% |
| State: | +133.3% |
Income statistics for American Indian and Alaska Native residents
Median household income in Southwest Shasta, CA in 2022:| Southwest Shasta: | $61,480 |
| California: | $76,752 |
Change in median household income between 2000 and 2022:| Southwest Shasta, California: | +113.8% |
| State: | +110.0% |
Number of households with income < $10k:| Southwest Shasta: | 5.4% (3,317) |
| State: | 5.4% (8,471) |
Number of households with income $10k - 20k:| Southwest Shasta: | 6.0% (3,660) |
| California: | 6.0% (9,381) |
Number of households with income $20k - 30k:| Southwest Shasta: | 5.6% (3,439) |
| State: | 5.5% (8,668) |
Number of households with income $30k - 40k:| Southwest Shasta: | 8.2% (5,045) |
| State: | 8.3% (13,030) |
Number of households with income $40k - 50k:| Southwest Shasta: | 7.0% (4,268) |
| California: | 6.9% (10,908) |
Number of households with income $50k - 60k:| Southwest Shasta: | 7.1% (4,363) |
| California: | 7.1% (11,198) |
Number of households with income $60k - 75k:| Southwest Shasta: | 9.6% (5,893) |
| State: | 9.6% (15,190) |
Number of households with income $75k - 100k:| Southwest Shasta: | 14.0% (8,608) |
| State: | 14.1% (22,274) |
Number of households with income $100k - 125k:| Southwest Shasta: | 11.3% (6,916) |
| California: | 11.2% (17,643) |
Number of households with income $125k - 150k:| Southwest Shasta: | 8.3% (5,067) |
| California: | 8.3% (13,117) |
Number of households with income $150k - 200k:| Southwest Shasta: | 8.8% (5,385) |
| State: | 8.8% (13,853) |
Number of households with income > $200k:| Southwest Shasta: | 8.8% (5,407) |
| California: | 8.8% (13,925) |
Aggregate household income in Southwest Shasta in 2022: $1,595,519
Median family income in Southwest Shasta in 2022:| Southwest Shasta: | $78,495 |
| State: | $81,108 |
Number of families with income < $10k:| Southwest Shasta: | 9.8% (3) |
| California: | 5.0% (5,711) |
Number of families with income $10k - 20k:| Southwest Shasta: | 2.0% (1) |
| California: | 3.7% (4,148) |
Number of families with income $20k - 30k:| Southwest Shasta: | 4.1% (1) |
| State: | 4.3% (4,876) |
Number of families with income $30k - 40k:| Southwest Shasta: | 19.8% (6) |
| California: | 8.8% (9,994) |
Number of families with income $40k - 50k:| Southwest Shasta: | 18.6% (6) |
| State: | 7.8% (8,776) |
Number of families with income $75k - 100k:| Southwest Shasta: | 45.7% (14) |
| California: | 14.8% (16,731) |
Median non-family income in Southwest Shasta in 2022:| Southwest Shasta: | $10,843 |
| California: | $51,296 |
Median per capita income in Southwest Shasta in 2022:| Southwest Shasta: | $42,601 |
| State: | $30,289 |
Income statistics for Multirace residents
Median household income in Southwest Shasta, CA in 2022:| Southwest Shasta: | $64,100 |
| State: | $83,153 |
Number of households with income < $10k:| Southwest Shasta: | 6.9% (579) |
| State: | 4.2% (85,299) |
Number of households with income $10k - 20k:| Southwest Shasta: | 9.5% (793) |
| State: | 6.1% (122,966) |
Number of households with income $20k - 30k:| Southwest Shasta: | 7.1% (595) |
| State: | 6.4% (129,328) |
Number of households with income $30k - 40k:| Southwest Shasta: | 12.5% (1,041) |
| State: | 6.4% (130,070) |
Number of households with income $40k - 50k:| Southwest Shasta: | 6.2% (518) |
| State: | 6.5% (131,254) |
Number of households with income $50k - 60k:| Southwest Shasta: | 3.8% (314) |
| State: | 6.5% (132,382) |
Number of households with income $60k - 75k:| Southwest Shasta: | 12.8% (1,071) |
| State: | 9.4% (191,472) |
Number of households with income $75k - 100k:| Southwest Shasta: | 16.2% (1,356) |
| State: | 13.3% (269,691) |
Number of households with income $100k - 125k:| Southwest Shasta: | 7.1% (590) |
| State: | 10.2% (207,286) |
Number of households with income $125k - 150k:| Southwest Shasta: | 6.6% (554) |
| California: | 7.8% (158,259) |
Number of households with income $150k - 200k:| Southwest Shasta: | 7.2% (597) |
| State: | 10.3% (209,227) |
Number of households with income > $200k:| Southwest Shasta: | 4.1% (339) |
| California: | 13.0% (263,210) |
Aggregate household income in Southwest Shasta in 2022: $11,253,158
Median family income in Southwest Shasta in 2022:| Southwest Shasta: | $59,282 |
| State: | $87,642 |
Number of families with income < $10k:| Southwest Shasta: | 8.8% (6) |
| State: | 3.2% (48,017) |
Number of families with income $10k - 20k:| Southwest Shasta: | 9.6% (6) |
| California: | 4.1% (60,419) |
Number of families with income $20k - 30k:| Southwest Shasta: | 27.9% (18) |
| California: | 6.1% (89,742) |
Number of families with income $30k - 40k:| Southwest Shasta: | 7.4% (5) |
| State: | 6.2% (91,415) |
Number of families with income $40k - 50k:| Southwest Shasta: | 46.3% (31) |
| State: | 6.8% (100,085) |
Median non-family income in Southwest Shasta in 2022:| Southwest Shasta: | $56,881 |
| California: | $56,558 |
Change in median non-family income between 2000 and 2022:| Southwest Shasta, California: | +98.9% |
| State: | +100.2% |
Median per capita income in Southwest Shasta in 2022:| Southwest Shasta: | $25,745 |
| State: | $32,124 |
Change in median per capita income between 2000 and 2022:| Southwest Shasta, California: | +94.3% |
| California: | +120.4% |
Income statistics for other residents
Number of households with income < $10k:| Southwest Shasta: | 4.5% (13) |
| California: | 4.6% (93,035) |
Number of households with income $10k - 20k:| Southwest Shasta: | 6.5% (19) |
| State: | 6.3% (126,222) |
Number of households with income $20k - 30k:| Southwest Shasta: | 7.2% (21) |
| California: | 7.1% (142,656) |
Number of households with income $30k - 40k:| Southwest Shasta: | 8.2% (24) |
| California: | 8.2% (165,018) |
Number of households with income $40k - 50k:| Southwest Shasta: | 8.2% (24) |
| California: | 8.0% (161,732) |
Number of households with income $50k - 60k:| Southwest Shasta: | 7.5% (22) |
| State: | 7.6% (152,152) |
Number of households with income $60k - 75k:| Southwest Shasta: | 10.3% (30) |
| State: | 10.4% (209,951) |
Number of households with income $75k - 100k:| Southwest Shasta: | 14.7% (43) |
| California: | 14.7% (296,102) |
Number of households with income $100k - 125k:| Southwest Shasta: | 10.6% (31) |
| State: | 10.7% (214,281) |
Number of households with income $125k - 150k:| Southwest Shasta: | 7.2% (21) |
| California: | 7.1% (143,092) |
Number of households with income $150k - 200k:| Southwest Shasta: | 8.6% (25) |
| State: | 8.6% (172,215) |
Number of households with income > $200k:| Southwest Shasta: | 6.5% (19) |
| State: | 6.7% (134,102) |
Aggregate household income in Southwest Shasta in 2022: $1,473,888
Median family income in Southwest Shasta in 2022:| Southwest Shasta: | $84,808 |
| California: | $72,756 |
Number of families with income $30k - 40k:| Southwest Shasta: | 16.3% (2) |
| California: | 8.4% (135,938) |
Number of families with income $100k - 125k:| Southwest Shasta: | 83.7% (12) |
| State: | 10.9% (176,716) |
Median per capita income in Southwest Shasta in 2022:| Southwest Shasta: | $46,796 |
| State: | $25,164 |
Change in median per capita income between 2000 and 2022:| Southwest Shasta, California: | +59.6% |
| State: | +137.9% |