The median household income in Southbridge Town, MA in 2022 was $53,769, which was 75.7% less than the median annual income of $94,488 across the entire state of Massachusetts. Compared to the median income of $47,874 in 2000 this represents an increase of 11.0%. The per capita income in 2022 was $30,676, which means an increase of 25.1% compared to 2000 when it was $22,983.
Whole page based on the data from 2000 / 2022 when the population of Southbridge Town, Massachusetts was 16,719 / 17,752
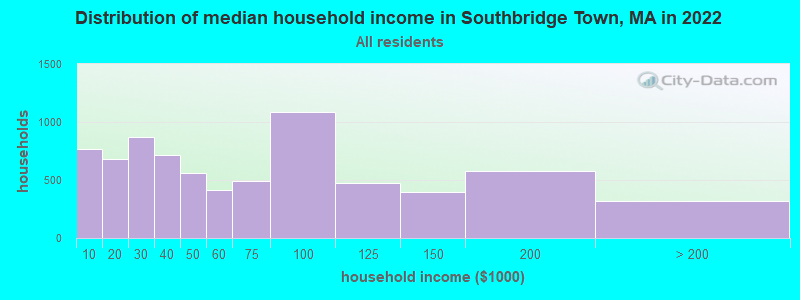
Income statistics for all residents
Median household income in Southbridge Town, MA in 2022:
Southbridge Town:
$53,769
State:
$94,488
Change in median household income between 2000 and 2022:
Southbridge Town, Massachusetts:
+12.3%
State:
+87.1%
Number of households with income < $10k:
Southbridge Town:
10.4% (766)
Massachusetts:
5.2% (146,170)
Number of households with income $10k - 20k:
Southbridge Town:
9.3% (681)
Massachusetts:
6.4% (180,001)
Number of households with income $20k - 30k:
Southbridge Town:
11.9% (874)
State:
5.6% (156,667)
Number of households with income $30k - 40k:
Southbridge Town:
9.8% (718)
State:
5.6% (157,168)
Number of households with income $40k - 50k:
Southbridge Town:
7.6% (559)
Massachusetts:
5.4% (151,455)
Number of households with income $50k - 60k:
Southbridge Town:
5.6% (414)
State:
5.1% (142,726)
Number of households with income $60k - 75k:
Southbridge Town:
6.7% (494)
State:
7.6% (212,203)
Number of households with income $75k - 100k:
Southbridge Town:
14.8% (1,086)
State:
11.3% (317,064)
Number of households with income $100k - 125k:
Southbridge Town:
6.5% (478)
Massachusetts:
9.7% (270,603)
Number of households with income $125k - 150k:
Southbridge Town:
5.4% (394)
Massachusetts:
8.0% (223,140)
Number of households with income $150k - 200k:
Southbridge Town:
7.8% (576)
State:
11.0% (308,695)
Number of households with income > $200k:
Southbridge Town:
4.3% (319)
State:
19.0% (531,884)
Aggregate household income in Southbridge Town in 2022: $512,506,749
Median family income in Southbridge Town in 2022:
Southbridge Town:
$69,174
State:
$120,263
Number of families with income < $10k:
Southbridge Town:
4.9% (226)
State:
2.9% (49,671)
Number of families with income $10k - 20k:
Southbridge Town:
5.0% (234)
State:
2.9% (50,542)
Number of families with income $20k - 30k:
Southbridge Town:
12.5% (581)
State:
3.9% (66,398)
Number of families with income $30k - 40k:
Southbridge Town:
8.8% (410)
Massachusetts:
4.5% (78,234)
Number of families with income $40k - 50k:
Southbridge Town:
8.7% (407)
State:
4.5% (77,656)
Number of families with income $50k - 60k:
Southbridge Town:
6.6% (308)
State:
4.5% (77,928)
Number of families with income $60k - 75k:
Southbridge Town:
5.9% (275)
State:
7.0% (120,295)
Number of families with income $75k - 100k:
Southbridge Town:
20.1% (936)
State:
11.1% (192,172)
Number of families with income $100k - 125k:
Southbridge Town:
6.9% (319)
Massachusetts:
10.6% (182,105)
Number of families with income $125k - 150k:
Southbridge Town:
4.6% (214)
Massachusetts:
9.3% (159,566)
Number of families with income $150k - 200k:
Southbridge Town:
9.3% (434)
Massachusetts:
13.4% (231,410)
Number of families with income > $200k:
Southbridge Town:
6.7% (310)
State:
25.4% (438,378)
Median non-family income in Southbridge Town in 2022:
Southbridge Town:
$29,405
State:
$55,979
Change in median non-family income between 2000 and 2022:
Southbridge Town, Massachusetts:
+15.0%
Massachusetts:
+88.0%
Median per capita income in Southbridge Town in 2022:
Southbridge Town:
$30,677
Massachusetts:
$54,025
Change in median per capita income between 2000 and 2022:
Southbridge Town, Massachusetts:
+33.5%
Massachusetts:
+108.2%
Income statistics for White residents
Median household income in Southbridge Town, MA in 2022:
Southbridge Town:
$55,204
State:
$101,391
Change in median household income between 2000 and 2022:
Southbridge Town, Massachusetts:
+11.8%
State:
+93.3%
Number of households with income < $10k:
Southbridge Town:
10.3% (559)
State:
4.4% (91,120)
Number of households with income $10k - 20k:
Southbridge Town:
10.6% (573)
State:
5.9% (122,055)
Number of households with income $20k - 30k:
Southbridge Town:
11.3% (611)
State:
5.1% (105,311)
Number of households with income $30k - 40k:
Southbridge Town:
9.3% (504)
State:
5.3% (110,239)
Number of households with income $40k - 50k:
Southbridge Town:
6.4% (344)
State:
5.0% (104,636)
Number of households with income $50k - 60k:
Southbridge Town:
4.3% (234)
State:
4.8% (99,486)
Number of households with income $60k - 75k:
Southbridge Town:
6.0% (323)
State:
7.5% (155,124)
Number of households with income $75k - 100k:
Southbridge Town:
11.9% (644)
Massachusetts:
11.4% (236,252)
Number of households with income $100k - 125k:
Southbridge Town:
8.2% (445)
Massachusetts:
9.9% (204,731)
Number of households with income $125k - 150k:
Southbridge Town:
6.4% (346)
State:
8.5% (175,324)
Number of households with income $150k - 200k:
Southbridge Town:
10.1% (544)
Massachusetts:
11.7% (242,980)
Number of households with income > $200k:
Southbridge Town:
5.1% (278)
State:
20.5% (425,966)
Aggregate household income in Southbridge Town in 2022: $402,751,962
Median family income in Southbridge Town in 2022:
Southbridge Town:
$80,382
Massachusetts:
$133,153
Number of families with income < $10k:
Southbridge Town:
4.5% (141)
Massachusetts:
2.0% (25,038)
Number of families with income $10k - 20k:
Southbridge Town:
5.0% (157)
State:
2.1% (26,403)
Number of families with income $20k - 30k:
Southbridge Town:
11.7% (364)
State:
2.6% (32,525)
Number of families with income $30k - 40k:
Southbridge Town:
7.4% (232)
State:
3.9% (48,079)
Number of families with income $40k - 50k:
Southbridge Town:
7.2% (223)
Massachusetts:
3.8% (46,908)
Number of families with income $50k - 60k:
Southbridge Town:
4.1% (128)
Massachusetts:
3.8% (46,476)
Number of families with income $60k - 75k:
Southbridge Town:
6.3% (196)
State:
6.4% (79,040)
Number of families with income $75k - 100k:
Southbridge Town:
17.4% (542)
State:
11.1% (137,395)
Number of families with income $100k - 125k:
Southbridge Town:
9.0% (282)
Massachusetts:
11.1% (136,771)
Number of families with income $125k - 150k:
Southbridge Town:
5.6% (175)
State:
10.0% (123,709)
Number of families with income $150k - 200k:
Southbridge Town:
13.1% (407)
Massachusetts:
14.7% (181,602)
Number of families with income > $200k:
Southbridge Town:
8.7% (270)
Massachusetts:
28.5% (351,887)
Median non-family income in Southbridge Town in 2022:
Southbridge Town:
$31,583
State:
$59,323
Change in median non-family income between 2000 and 2022:
Southbridge Town, Massachusetts:
+22.0%
State:
+94.3%
Median per capita income in Southbridge Town in 2022:
Southbridge Town:
$36,157
State:
$60,804
Change in median per capita income between 2000 and 2022:
Southbridge Town, Massachusetts:
+50.7%
State:
+118.7%
Income statistics for Black or African American residents
Median household income in Southbridge Town, MA in 2022:
Southbridge Town:
$37,759
State:
$63,189
Change in median household income between 2000 and 2022:
Southbridge Town, Massachusetts:
+8.4%
State:
+87.4%
Number of households with income < $10k:
Southbridge Town:
5.1% (18)
State:
9.1% (15,797)
Number of households with income $10k - 20k:
Southbridge Town:
8.9% (31)
State:
9.4% (16,267)
Number of households with income $20k - 30k:
Southbridge Town:
18.3% (64)
State:
7.8% (13,520)
Number of households with income $30k - 40k:
Southbridge Town:
7.1% (25)
Massachusetts:
8.3% (14,412)
Number of households with income $40k - 50k:
Southbridge Town:
24.9% (87)
Massachusetts:
7.9% (13,790)
Number of households with income $50k - 60k:
Southbridge Town:
4.0% (14)
State:
5.8% (10,041)
Number of households with income $60k - 75k:
Southbridge Town:
0.0% (0)
State:
8.5% (14,822)
Number of households with income $75k - 100k:
Southbridge Town:
28.3% (99)
State:
11.0% (19,122)
Number of households with income $100k - 125k:
Southbridge Town:
1.4% (5)
Massachusetts:
8.4% (14,575)
Number of households with income $125k - 150k:
Southbridge Town:
2.0% (7)
State:
6.0% (10,429)
Number of households with income $150k - 200k:
Southbridge Town:
0.0% (0)
State:
7.2% (12,539)
Number of households with income > $200k:
Southbridge Town:
0.0% (0)
State:
10.5% (18,185)
Aggregate household income in Southbridge Town in 2022: $15,701,873
Median family income in Southbridge Town in 2022:
Southbridge Town:
$34,056
State:
$79,815
Number of families with income < $10k:
Southbridge Town:
6.6% (20)
State:
6.3% (6,915)
Number of families with income $20k - 30k:
Southbridge Town:
23.2% (70)
State:
6.6% (7,274)
Number of families with income $30k - 40k:
Southbridge Town:
6.6% (20)
State:
6.4% (7,002)
Number of families with income $40k - 50k:
Southbridge Town:
34.8% (105)
State:
7.9% (8,656)
Number of families with income $50k - 60k:
Southbridge Town:
1.7% (5)
State:
6.4% (6,986)
Number of families with income $75k - 100k:
Southbridge Town:
25.6% (78)
State:
11.5% (12,654)
Number of families with income $100k - 125k:
Southbridge Town:
1.5% (5)
State:
10.4% (11,452)
Median per capita income in Southbridge Town in 2022:
Southbridge Town:
$21,154
Massachusetts:
$33,524
Change in median per capita income between 2000 and 2022:
Southbridge Town, Massachusetts:
+47.1%
State:
+109.4%
Income statistics for Asian residents
Median household income in Southbridge Town, MA in 2022:
Southbridge Town:
$80,002
State:
$117,855
Change in median household income between 2000 and 2022:
Southbridge Town, Massachusetts:
+50.2%
State:
+129.9%
Number of households with income < $10k:
Southbridge Town:
16.9% (11)
State:
6.8% (11,982)
Number of households with income $10k - 20k:
Southbridge Town:
0.0% (0)
Massachusetts:
4.8% (8,376)
Number of households with income $20k - 30k:
Southbridge Town:
0.0% (0)
State:
3.7% (6,558)
Number of households with income $30k - 40k:
Southbridge Town:
7.7% (5)
State:
3.3% (5,748)
Number of households with income $40k - 50k:
Southbridge Town:
0.0% (0)
State:
4.1% (7,192)
Number of households with income $50k - 60k:
Southbridge Town:
0.0% (0)
State:
5.0% (8,734)
Number of households with income $60k - 75k:
Southbridge Town:
27.7% (18)
Massachusetts:
5.8% (10,203)
Number of households with income $75k - 100k:
Southbridge Town:
9.2% (6)
State:
8.6% (15,154)
Number of households with income $100k - 125k:
Southbridge Town:
13.8% (9)
State:
10.8% (18,942)
Number of households with income $125k - 150k:
Southbridge Town:
0.0% (0)
State:
8.0% (14,037)
Number of households with income $150k - 200k:
Southbridge Town:
24.6% (16)
State:
12.5% (21,856)
Number of households with income > $200k:
Southbridge Town:
0.0% (0)
Massachusetts:
26.6% (46,694)
Aggregate household income in Southbridge Town in 2022: $6,164,995
Median family income in Southbridge Town in 2022:
Southbridge Town:
$114,183
Massachusetts:
$140,113
Number of families with income $30k - 40k:
Southbridge Town:
20.2% (7)
State:
2.8% (3,234)
Number of families with income $75k - 100k:
Southbridge Town:
9.0% (3)
Massachusetts:
8.5% (10,022)
Number of families with income $100k - 125k:
Southbridge Town:
28.2% (10)
Massachusetts:
10.0% (11,697)
Number of families with income $150k - 200k:
Southbridge Town:
42.6% (15)
State:
13.2% (15,478)
Median per capita income in Southbridge Town in 2022:
Southbridge Town:
$29,151
Massachusetts:
$58,900
Change in median per capita income between 2000 and 2022:
Southbridge Town, Massachusetts:
+43.9%
Massachusetts:
+174.6%
Income statistics for Hispanic or Latino residents
Median household income in Southbridge Town, MA in 2022:
Southbridge Town:
$41,212
State:
$61,523
Change in median household income between 2000 and 2022:
Southbridge Town, Massachusetts:
+62.3%
State:
+125.4%
Number of households with income < $10k:
Southbridge Town:
14.1% (314)
State:
8.8% (25,307)
Number of households with income $10k - 20k:
Southbridge Town:
5.6% (125)
Massachusetts:
10.0% (28,653)
Number of households with income $20k - 30k:
Southbridge Town:
12.2% (272)
Massachusetts:
8.8% (25,189)
Number of households with income $30k - 40k:
Southbridge Town:
15.5% (344)
State:
7.2% (20,822)
Number of households with income $40k - 50k:
Southbridge Town:
7.9% (175)
State:
7.2% (20,817)
Number of households with income $50k - 60k:
Southbridge Town:
8.8% (195)
State:
6.5% (18,748)
Number of households with income $60k - 75k:
Southbridge Town:
7.8% (173)
Massachusetts:
8.8% (25,390)
Number of households with income $75k - 100k:
Southbridge Town:
16.8% (373)
State:
12.0% (34,488)
Number of households with income $100k - 125k:
Southbridge Town:
3.9% (86)
Massachusetts:
8.6% (24,599)
Number of households with income $125k - 150k:
Southbridge Town:
1.5% (34)
State:
6.2% (17,743)
Number of households with income $150k - 200k:
Southbridge Town:
3.6% (80)
State:
7.3% (21,017)
Number of households with income > $200k:
Southbridge Town:
2.4% (54)
State:
8.6% (24,606)
Aggregate household income in Southbridge Town in 2022: $124,568,649
Median family income in Southbridge Town in 2022:
Southbridge Town:
$41,980
State:
$66,072
Number of families with income < $10k:
Southbridge Town:
9.0% (149)
State:
6.2% (12,456)
Number of families with income $10k - 20k:
Southbridge Town:
4.6% (77)
Massachusetts:
6.0% (12,071)
Number of families with income $20k - 30k:
Southbridge Town:
13.0% (217)
State:
10.1% (20,376)
Number of families with income $30k - 40k:
Southbridge Town:
14.5% (242)
State:
8.2% (16,470)
Number of families with income $40k - 50k:
Southbridge Town:
12.0% (200)
State:
7.4% (14,829)
Number of families with income $50k - 60k:
Southbridge Town:
11.4% (190)
Massachusetts:
7.3% (14,643)
Number of families with income $60k - 75k:
Southbridge Town:
5.3% (89)
Massachusetts:
10.6% (21,252)
Number of families with income $75k - 100k:
Southbridge Town:
19.7% (327)
Massachusetts:
12.0% (24,088)
Number of families with income $100k - 125k:
Southbridge Town:
1.7% (28)
State:
8.9% (17,954)
Number of families with income $125k - 150k:
Southbridge Town:
2.4% (40)
Massachusetts:
6.9% (13,837)
Number of families with income $150k - 200k:
Southbridge Town:
3.1% (51)
State:
7.3% (14,683)
Number of families with income > $200k:
Southbridge Town:
3.2% (54)
State:
9.3% (18,741)
Median non-family income in Southbridge Town in 2022:
Southbridge Town:
$34,063
State:
$37,563
Change in median non-family income between 2000 and 2022:
Southbridge Town, Massachusetts:
+124.6%
State:
+115.0%
Median per capita income in Southbridge Town in 2022:
Southbridge Town:
$19,722
Massachusetts:
$28,993
Change in median per capita income between 2000 and 2022:
Southbridge Town, Massachusetts:
+78.0%
Massachusetts:
+142.4%
Income statistics for American Indian and Alaska Native residents
Number of households with income < $10k:
Southbridge Town:
0.0% (0)
State:
6.6% (451)
Number of households with income $10k - 20k:
Southbridge Town:
0.0% (0)
State:
7.0% (476)
Number of households with income $20k - 30k:
Southbridge Town:
28.8% (15)
State:
2.8% (192)
Number of households with income $30k - 40k:
Southbridge Town:
71.2% (37)
Massachusetts:
3.2% (218)
Number of households with income $40k - 50k:
Southbridge Town:
0.0% (0)
State:
2.9% (199)
Number of households with income $50k - 60k:
Southbridge Town:
0.0% (0)
State:
9.9% (677)
Number of households with income $60k - 75k:
Southbridge Town:
0.0% (0)
State:
11.5% (781)
Number of households with income $75k - 100k:
Southbridge Town:
0.0% (0)
Massachusetts:
9.2% (629)
Number of households with income $100k - 125k:
Southbridge Town:
0.0% (0)
Massachusetts:
6.0% (406)
Number of households with income $125k - 150k:
Southbridge Town:
0.0% (0)
State:
13.5% (921)
Number of households with income $150k - 200k:
Southbridge Town:
0.0% (0)
State:
12.6% (859)
Number of households with income > $200k:
Southbridge Town:
0.0% (0)
State:
14.7% (1,003)
Aggregate household income in Southbridge Town in 2022: $1,546,857
Median per capita income in Southbridge Town in 2022:
Southbridge Town:
$14,009
State:
$39,434
Change in median per capita income between 2000 and 2022:: -17.5%
Southbridge Town, Massachusetts:
-17.5%
Massachusetts:
+148.2%
Income statistics for Multirace residents
Median household income in Southbridge Town, MA in 2022:
Southbridge Town:
$35,733
Massachusetts:
$71,552
Change in median household income between 2000 and 2022:
Southbridge Town, Massachusetts:
+19.7%
State:
+109.0%
Number of households with income < $10k:
Southbridge Town:
26.3% (308)
Massachusetts:
6.6% (15,127)
Number of households with income $10k - 20k:
Southbridge Town:
1.3% (15)
State:
9.2% (21,158)
Number of households with income $20k - 30k:
Southbridge Town:
15.4% (180)
Massachusetts:
7.8% (18,016)
Number of households with income $30k - 40k:
Southbridge Town:
9.3% (109)
State:
7.9% (18,260)
Number of households with income $40k - 50k:
Southbridge Town:
7.9% (92)
Massachusetts:
5.6% (13,027)
Number of households with income $50k - 60k:
Southbridge Town:
5.3% (62)
Massachusetts:
5.6% (12,909)
Number of households with income $60k - 75k:
Southbridge Town:
2.0% (23)
Massachusetts:
9.0% (20,800)
Number of households with income $75k - 100k:
Southbridge Town:
27.5% (322)
State:
12.1% (27,875)
Number of households with income $100k - 125k:
Southbridge Town:
0.7% (8)
State:
8.1% (18,754)
Number of households with income $125k - 150k:
Southbridge Town:
1.8% (21)
State:
6.8% (15,621)
Number of households with income $150k - 200k:
Southbridge Town:
0.6% (7)
Massachusetts:
9.4% (21,618)
Number of households with income > $200k:
Southbridge Town:
2.0% (23)
State:
12.0% (27,592)
Aggregate household income in Southbridge Town in 2022: $51,220,403
Median family income in Southbridge Town in 2022:
Southbridge Town:
$45,012
State:
$78,380
Number of families with income < $10k:
Southbridge Town:
11.6% (91)
Massachusetts:
4.5% (7,017)
Number of families with income $10k - 20k:
Southbridge Town:
1.6% (12)
Massachusetts:
4.9% (7,678)
Number of families with income $20k - 30k:
Southbridge Town:
11.0% (87)
State:
8.5% (13,245)
Number of families with income $30k - 40k:
Southbridge Town:
11.3% (89)
Massachusetts:
8.2% (12,705)
Number of families with income $40k - 50k:
Southbridge Town:
7.6% (60)
State:
5.3% (8,255)
Number of families with income $50k - 60k:
Southbridge Town:
11.5% (91)
State:
6.7% (10,445)
Number of families with income $75k - 100k:
Southbridge Town:
37.7% (296)
Massachusetts:
12.1% (18,758)
Number of families with income $100k - 125k:
Southbridge Town:
1.9% (15)
State:
7.9% (12,321)
Number of families with income $125k - 150k:
Southbridge Town:
2.9% (23)
State:
7.2% (11,128)
Number of families with income > $200k:
Southbridge Town:
2.9% (23)
State:
14.0% (21,838)
Median per capita income in Southbridge Town in 2022:
Southbridge Town:
$17,540
Massachusetts:
$34,029
Change in median per capita income between 2000 and 2022:
Southbridge Town, Massachusetts:
+42.2%
Massachusetts:
+132.1%
Income statistics for other residents
Median household income in Southbridge Town, MA in 2022:
Southbridge Town:
$64,220
Massachusetts:
$61,039
Number of households with income < $10k:
Southbridge Town:
0.0% (0)
Massachusetts:
8.4% (11,559)
Number of households with income $10k - 20k:
Southbridge Town:
3.1% (19)
State:
8.4% (11,499)
Number of households with income $20k - 30k:
Southbridge Town:
7.4% (45)
State:
9.5% (13,070)
Number of households with income $30k - 40k:
Southbridge Town:
10.8% (66)
Massachusetts:
6.0% (8,291)
Number of households with income $40k - 50k:
Southbridge Town:
1.5% (9)
Massachusetts:
9.2% (12,611)
Number of households with income $50k - 60k:
Southbridge Town:
24.7% (151)
State:
7.9% (10,879)
Number of households with income $60k - 75k:
Southbridge Town:
23.4% (143)
State:
7.5% (10,239)
Number of households with income $75k - 100k:
Southbridge Town:
22.9% (140)
State:
13.1% (18,032)
Number of households with income $100k - 125k:
Southbridge Town:
1.6% (10)
State:
9.6% (13,141)
Number of households with income $125k - 150k:
Southbridge Town:
2.0% (12)
State:
5.0% (6,808)
Number of households with income $150k - 200k:
Southbridge Town:
0.0% (0)
Massachusetts:
6.4% (8,843)
Number of households with income > $200k:
Southbridge Town:
2.8% (17)
Massachusetts:
9.0% (12,396)
Aggregate household income in Southbridge Town in 2022: $43,659,683
Median family income in Southbridge Town in 2022:
Southbridge Town:
$56,795
Massachusetts:
$66,840
Number of families with income $10k - 20k:
Southbridge Town:
1.5% (9)
State:
4.7% (4,798)
Number of families with income $20k - 30k:
Southbridge Town:
14.3% (87)
State:
10.4% (10,595)
Number of families with income $30k - 40k:
Southbridge Town:
13.1% (80)
State:
7.0% (7,154)
Number of families with income $40k - 50k:
Southbridge Town:
4.9% (30)
State:
8.9% (9,052)
Number of families with income $50k - 60k:
Southbridge Town:
20.1% (122)
State:
8.7% (8,850)
Number of families with income $60k - 75k:
Southbridge Town:
12.4% (75)
State:
8.5% (8,683)
Number of families with income $75k - 100k:
Southbridge Town:
27.2% (165)
Massachusetts:
12.8% (12,997)
Number of families with income $100k - 125k:
Southbridge Town:
1.5% (9)
State:
9.3% (9,480)
Number of families with income $125k - 150k:
Southbridge Town:
2.0% (12)
Massachusetts:
5.3% (5,373)
Number of families with income > $200k:
Southbridge Town:
3.1% (19)
State:
10.0% (10,188)
Median non-family income in Southbridge Town in 2022:
Southbridge Town:
$60,074
State:
$36,127
Median per capita income in Southbridge Town in 2022:
Southbridge Town:
$22,293
Massachusetts:
$30,797
Change in median per capita income between 2000 and 2022:
Southbridge Town, Massachusetts:
+120.1%
Massachusetts:
+188.5%
Discuss Southbridge Town, Massachusetts (MA) on our hugely popular Massachusetts forum.