South Gull Lake, Michigan (MI) income map, earnings map, and wages data

Data:
The per capita income in 2022 was $128,560, which means an increase of 64.9% compared to 2000 when it was $45,175.
Whole page based on the data from 2000 / 2022 when the population of South Gull Lake, Michigan was 1,526 / 1,583
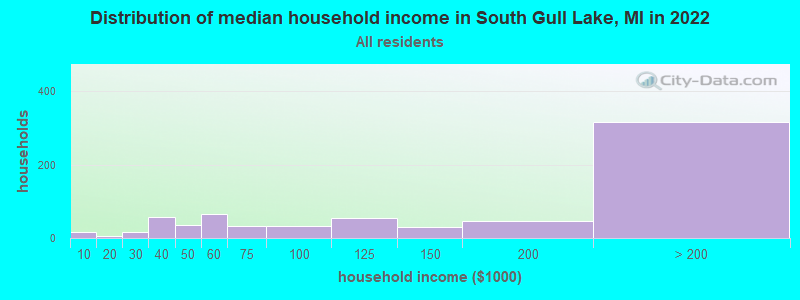
Income statistics for all residents
Number of households with income < $10k:| South Gull Lake: | 2.1% (15) |
| Michigan: | 5.7% (231,223) |
Number of households with income $10k - 20k:| South Gull Lake: | 0.8% (6) |
| Michigan: | 7.5% (306,955) |
Number of households with income $20k - 30k:| South Gull Lake: | 2.4% (17) |
| State: | 7.9% (324,153) |
Number of households with income $30k - 40k:| South Gull Lake: | 7.9% (56) |
| State: | 8.3% (341,408) |
Number of households with income $40k - 50k:| South Gull Lake: | 5.1% (36) |
| Michigan: | 7.9% (322,255) |
Number of households with income $50k - 60k:| South Gull Lake: | 9.3% (66) |
| State: | 7.5% (305,914) |
Number of households with income $60k - 75k:| South Gull Lake: | 4.7% (33) |
| State: | 10.1% (414,440) |
Number of households with income $75k - 100k:| South Gull Lake: | 4.5% (32) |
| Michigan: | 13.2% (538,299) |
Number of households with income $100k - 125k:| South Gull Lake: | 7.8% (55) |
| State: | 9.7% (396,282) |
Number of households with income $125k - 150k:| South Gull Lake: | 4.1% (29) |
| Michigan: | 6.7% (273,144) |
Number of households with income $150k - 200k:| South Gull Lake: | 6.6% (47) |
| Michigan: | 7.5% (305,077) |
Number of households with income > $200k:| South Gull Lake: | 44.6% (316) |
| Michigan: | 8.1% (330,644) |
Aggregate household income in South Gull Lake in 2022: $200,282,526
Median family income in South Gull Lake in 2022:| South Gull Lake: | $175,365 |
| State: | $85,865 |
Number of families with income $20k - 30k:| South Gull Lake: | 0.4% (2) |
| State: | 5.0% (127,320) |
Number of families with income $30k - 40k:| South Gull Lake: | 10.9% (61) |
| State: | 6.4% (163,565) |
Number of families with income $40k - 50k:| South Gull Lake: | 2.9% (16) |
| State: | 6.8% (172,384) |
Number of families with income $50k - 60k:| South Gull Lake: | 4.2% (23) |
| State: | 7.1% (179,870) |
Number of families with income $60k - 75k:| South Gull Lake: | 5.4% (30) |
| Michigan: | 10.3% (263,723) |
Number of families with income $75k - 100k:| South Gull Lake: | 5.1% (28) |
| Michigan: | 15.0% (383,364) |
Number of families with income $100k - 125k:| South Gull Lake: | 6.3% (35) |
| State: | 11.8% (301,751) |
Number of families with income $125k - 150k:| South Gull Lake: | 6.7% (37) |
| State: | 8.6% (220,338) |
Number of families with income $150k - 200k:| South Gull Lake: | 8.7% (49) |
| Michigan: | 10.2% (259,462) |
Number of families with income > $200k:| South Gull Lake: | 49.3% (275) |
| Michigan: | 11.3% (287,206) |
Median non-family income in South Gull Lake in 2022:| South Gull Lake: | $57,502 |
| State: | $40,459 |
Change in median non-family income between 2000 and 2022:| South Gull Lake, Michigan: | +24.9% |
| State: | +54.5% |
Median per capita income in South Gull Lake in 2022:| South Gull Lake: | $128,560 |
| Michigan: | $38,151 |
Income statistics for White residents
Median household income in South Gull Lake, MI in 2022:| South Gull Lake: | $148,346 |
| State: | $71,609 |
Change in median household income between 2000 and 2022:| South Gull Lake, Michigan: | +121.1% |
| State: | +52.9% |
Number of households with income < $10k:| South Gull Lake: | 2.1% (14) |
| Michigan: | 4.4% (140,440) |
Number of households with income $10k - 20k:| South Gull Lake: | 1.1% (7) |
| State: | 6.5% (205,547) |
Number of households with income $20k - 30k:| South Gull Lake: | 2.3% (15) |
| State: | 7.6% (242,254) |
Number of households with income $30k - 40k:| South Gull Lake: | 4.8% (31) |
| State: | 8.1% (257,175) |
Number of households with income $40k - 50k:| South Gull Lake: | 5.5% (36) |
| State: | 7.8% (246,839) |
Number of households with income $50k - 60k:| South Gull Lake: | 10.4% (68) |
| State: | 7.4% (233,723) |
Number of households with income $60k - 75k:| South Gull Lake: | 5.2% (34) |
| State: | 10.4% (328,664) |
Number of households with income $75k - 100k:| South Gull Lake: | 4.6% (30) |
| State: | 13.6% (431,867) |
Number of households with income $100k - 125k:| South Gull Lake: | 8.0% (52) |
| State: | 10.3% (325,164) |
Number of households with income $125k - 150k:| South Gull Lake: | 4.4% (29) |
| State: | 7.1% (226,232) |
Number of households with income $150k - 200k:| South Gull Lake: | 7.1% (46) |
| State: | 8.1% (255,445) |
Number of households with income > $200k:| South Gull Lake: | 44.5% (290) |
| State: | 8.7% (276,727) |
Aggregate household income in South Gull Lake in 2022: $190,303,360
Median family income in South Gull Lake in 2022:| South Gull Lake: | $203,391 |
| State: | $90,317 |
Number of families with income $20k - 30k:| South Gull Lake: | 0.3% (2) |
| State: | 4.6% (91,551) |
Number of families with income $30k - 40k:| South Gull Lake: | 5.4% (28) |
| State: | 5.9% (117,356) |
Number of families with income $40k - 50k:| South Gull Lake: | 3.7% (19) |
| Michigan: | 6.4% (127,491) |
Number of families with income $50k - 60k:| South Gull Lake: | 5.0% (25) |
| State: | 6.8% (135,883) |
Number of families with income $60k - 75k:| South Gull Lake: | 6.6% (34) |
| State: | 10.5% (209,130) |
Number of families with income $75k - 100k:| South Gull Lake: | 5.5% (28) |
| Michigan: | 15.5% (309,815) |
Number of families with income $100k - 125k:| South Gull Lake: | 6.3% (32) |
| Michigan: | 12.4% (248,235) |
Number of families with income $125k - 150k:| South Gull Lake: | 5.7% (29) |
| State: | 9.2% (182,895) |
Number of families with income $150k - 200k:| South Gull Lake: | 9.6% (49) |
| State: | 11.0% (218,573) |
Number of families with income > $200k:| South Gull Lake: | 51.7% (262) |
| State: | 12.0% (239,713) |
Median non-family income in South Gull Lake in 2022:| South Gull Lake: | $55,240 |
| State: | $42,438 |
Change in median non-family income between 2000 and 2022:| South Gull Lake, Michigan: | +20.0% |
| State: | +56.8% |
Median per capita income in South Gull Lake in 2022:| South Gull Lake: | $131,471 |
| Michigan: | $41,514 |
Income statistics for Black or African American residents
Median per capita income in South Gull Lake in 2022:| South Gull Lake: | $37,420 |
| State: | $25,207 |
Change in median per capita income between 2000 and 2022:| South Gull Lake, Michigan: | +92.3% |
| Michigan: | +60.4% |
Income statistics for Multirace residents
Number of households with income < $10k:| South Gull Lake: | 0.0% (0) |
| State: | 6.1% (12,463) |
Number of households with income $10k - 20k:| South Gull Lake: | 0.0% (0) |
| Michigan: | 8.7% (17,830) |
Number of households with income $20k - 30k:| South Gull Lake: | 0.0% (0) |
| State: | 7.6% (15,686) |
Number of households with income $30k - 40k:| South Gull Lake: | 89.4% (42) |
| State: | 9.5% (19,444) |
Number of households with income $40k - 50k:| South Gull Lake: | 0.0% (0) |
| State: | 7.5% (15,476) |
Number of households with income $50k - 60k:| South Gull Lake: | 0.0% (0) |
| State: | 8.1% (16,622) |
Number of households with income $60k - 75k:| South Gull Lake: | 0.0% (0) |
| State: | 10.6% (21,725) |
Number of households with income $75k - 100k:| South Gull Lake: | 0.0% (0) |
| State: | 14.4% (29,501) |
Number of households with income $100k - 125k:| South Gull Lake: | 0.0% (0) |
| State: | 8.9% (18,231) |
Number of households with income $125k - 150k:| South Gull Lake: | 0.0% (0) |
| State: | 5.8% (11,923) |
Number of households with income $150k - 200k:| South Gull Lake: | 0.0% (0) |
| State: | 6.8% (13,956) |
Number of households with income > $200k:| South Gull Lake: | 10.6% (5) |
| State: | 6.2% (12,672) |
Median per capita income in South Gull Lake in 2022:| South Gull Lake: | $47,245 |
| State: | $26,098 |