The median household income in South Barrington, IL in 2022 was $221,215, which was 65.3% greater than the median annual income of $76,708 across the entire state of Illinois. Compared to the median income of $170,755 in 2000 this represents an increase of 22.8%. The per capita income in 2022 was $91,061, which means an increase of 16.5% compared to 2000 when it was $76,078.
Whole page based on the data from 2000 / 2022 when the population of South Barrington, Illinois was 3,760 / 4,890
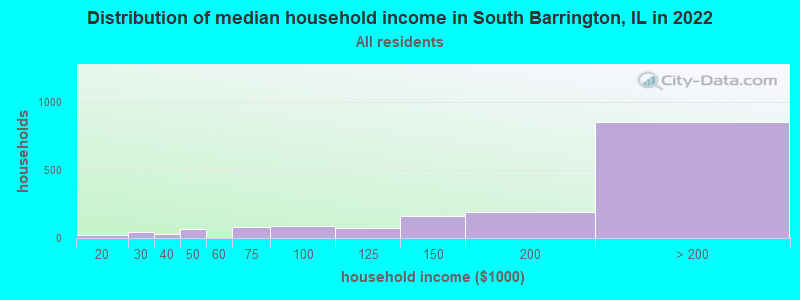
Income statistics for all residents
Median household income in South Barrington, IL in 2022:
South Barrington:
$221,215
Illinois:
$76,708
Change in median household income between 2000 and 2022:
South Barrington, Illinois:
+29.6%
Illinois:
+64.6%
Number of households with income < $10k:
South Barrington:
0.0% (0)
State:
5.9% (296,090)
Number of households with income $10k - 20k:
South Barrington:
1.2% (19)
State:
6.6% (333,259)
Number of households with income $20k - 30k:
South Barrington:
2.6% (42)
State:
6.8% (342,921)
Number of households with income $30k - 40k:
South Barrington:
1.9% (30)
State:
7.0% (355,254)
Number of households with income $40k - 50k:
South Barrington:
4.0% (65)
State:
6.7% (340,678)
Number of households with income $50k - 60k:
South Barrington:
0.0% (0)
State:
6.7% (339,405)
Number of households with income $60k - 75k:
South Barrington:
5.2% (83)
State:
9.2% (465,709)
Number of households with income $75k - 100k:
South Barrington:
5.5% (88)
State:
12.9% (651,353)
Number of households with income $100k - 125k:
South Barrington:
4.5% (73)
Illinois:
10.3% (522,359)
Number of households with income $125k - 150k:
South Barrington:
10.1% (162)
State:
7.3% (367,136)
Number of households with income $150k - 200k:
South Barrington:
12.0% (193)
State:
9.0% (455,249)
Number of households with income > $200k:
South Barrington:
53.0% (850)
State:
11.6% (586,947)
Aggregate household income in South Barrington in 2022: $449,159,353
Median family income in South Barrington in 2022:
South Barrington:
$221,168
State:
$96,948
Number of families with income $10k - 20k:
South Barrington:
1.2% (18)
Illinois:
3.3% (105,017)
Number of families with income $20k - 30k:
South Barrington:
2.7% (41)
State:
4.7% (146,403)
Number of families with income $30k - 40k:
South Barrington:
1.2% (19)
State:
5.3% (167,069)
Number of families with income $40k - 50k:
South Barrington:
4.1% (63)
State:
5.8% (181,164)
Number of families with income $60k - 75k:
South Barrington:
4.6% (70)
State:
9.0% (282,985)
Number of families with income $75k - 100k:
South Barrington:
5.2% (79)
State:
13.8% (432,725)
Number of families with income $100k - 125k:
South Barrington:
4.5% (70)
Illinois:
11.9% (373,296)
Number of families with income $125k - 150k:
South Barrington:
9.6% (147)
State:
8.9% (279,791)
Number of families with income $150k - 200k:
South Barrington:
12.4% (190)
State:
11.9% (372,004)
Number of families with income > $200k:
South Barrington:
54.4% (832)
State:
15.9% (500,033)
Median non-family income in South Barrington in 2022:
South Barrington:
$94,672
Illinois:
$46,533
Change in median non-family income between 2000 and 2022:
South Barrington, Illinois:
+129.5%
State:
+64.0%
Median per capita income in South Barrington in 2022:
South Barrington:
$91,061
State:
$43,317
Change in median per capita income between 2000 and 2022:
South Barrington, Illinois:
+19.7%
Illinois:
+87.5%
Income statistics for White residents
Median household income in South Barrington, IL in 2022:
South Barrington:
$166,247
State:
$83,346
Change in median household income between 2000 and 2022:
South Barrington, Illinois:
+3.2%
State:
+67.5%
Number of households with income < $10k:
South Barrington:
0.0% (0)
Illinois:
4.5% (149,895)
Number of households with income $10k - 20k:
South Barrington:
1.8% (16)
State:
5.5% (184,529)
Number of households with income $20k - 30k:
South Barrington:
2.8% (25)
State:
6.1% (205,767)
Number of households with income $30k - 40k:
South Barrington:
0.9% (8)
Illinois:
6.7% (225,572)
Number of households with income $40k - 50k:
South Barrington:
6.2% (55)
State:
6.5% (216,965)
Number of households with income $50k - 60k:
South Barrington:
0.0% (0)
Illinois:
6.6% (222,841)
Number of households with income $60k - 75k:
South Barrington:
8.7% (78)
State:
9.3% (312,758)
Number of households with income $75k - 100k:
South Barrington:
1.8% (16)
State:
12.9% (433,180)
Number of households with income $100k - 125k:
South Barrington:
6.2% (55)
State:
10.7% (360,753)
Number of households with income $125k - 150k:
South Barrington:
17.0% (152)
State:
7.9% (266,532)
Number of households with income $150k - 200k:
South Barrington:
10.0% (89)
State:
10.0% (337,357)
Number of households with income > $200k:
South Barrington:
44.7% (400)
State:
13.3% (446,069)
Aggregate household income in South Barrington in 2022: $213,203,642
Median family income in South Barrington in 2022:
South Barrington:
$194,290
Illinois:
$107,938
Number of families with income $10k - 20k:
South Barrington:
1.9% (16)
State:
2.5% (50,574)
Number of families with income $20k - 30k:
South Barrington:
2.5% (20)
Illinois:
3.5% (70,927)
Number of families with income $40k - 50k:
South Barrington:
6.0% (48)
State:
5.0% (102,597)
Number of families with income $60k - 75k:
South Barrington:
7.3% (58)
State:
8.8% (179,665)
Number of families with income $75k - 100k:
South Barrington:
0.9% (7)
Illinois:
13.5% (276,887)
Number of families with income $100k - 125k:
South Barrington:
6.4% (52)
State:
12.5% (256,099)
Number of families with income $125k - 150k:
South Barrington:
16.4% (132)
Illinois:
9.8% (199,855)
Number of families with income $150k - 200k:
South Barrington:
10.7% (86)
State:
13.4% (274,569)
Number of families with income > $200k:
South Barrington:
47.8% (385)
State:
18.6% (381,354)
Median non-family income in South Barrington in 2022:
South Barrington:
$97,638
State:
$50,934
Change in median non-family income between 2000 and 2022:
South Barrington, Illinois:
+136.7%
State:
+70.7%
Median per capita income in South Barrington in 2022:
South Barrington:
$91,390
Illinois:
$50,738
Change in median per capita income between 2000 and 2022:
South Barrington, Illinois:
+20.8%
State:
+95.5%
Income statistics for Black or African American residents
Median per capita income in South Barrington in 2022:
South Barrington:
$56,841
State:
$28,045
Change in median per capita income between 2000 and 2022:
South Barrington, Illinois:
+14.6%
State:
+90.2%
Income statistics for Asian residents
Median household income in South Barrington, IL in 2022:
South Barrington:
$236,546
State:
$104,287
Change in median household income between 2000 and 2022:
South Barrington, Illinois:
+18.3%
State:
+81.9%
Number of households with income < $10k:
South Barrington:
0.0% (0)
State:
5.3% (14,653)
Number of households with income $10k - 20k:
South Barrington:
0.0% (0)
Illinois:
4.5% (12,283)
Number of households with income $20k - 30k:
South Barrington:
2.4% (15)
State:
4.8% (13,135)
Number of households with income $30k - 40k:
South Barrington:
0.8% (5)
Illinois:
5.0% (13,655)
Number of households with income $40k - 50k:
South Barrington:
0.0% (0)
State:
4.5% (12,357)
Number of households with income $50k - 60k:
South Barrington:
0.0% (0)
Illinois:
4.9% (13,568)
Number of households with income $60k - 75k:
South Barrington:
0.0% (0)
State:
7.1% (19,606)
Number of households with income $75k - 100k:
South Barrington:
11.6% (74)
Illinois:
12.1% (33,349)
Number of households with income $100k - 125k:
South Barrington:
1.7% (11)
Illinois:
9.7% (26,669)
Number of households with income $125k - 150k:
South Barrington:
0.0% (0)
State:
7.3% (20,172)
Number of households with income $150k - 200k:
South Barrington:
16.6% (106)
Illinois:
11.5% (31,711)
Number of households with income > $200k:
South Barrington:
66.9% (427)
Illinois:
23.1% (63,411)
Aggregate household income in South Barrington in 2022: $218,655,993
Median family income in South Barrington in 2022:
South Barrington:
$242,598
Illinois:
$124,630
Number of families with income $20k - 30k:
South Barrington:
2.3% (15)
State:
4.4% (8,618)
Number of families with income $30k - 40k:
South Barrington:
0.8% (5)
State:
4.4% (8,628)
Number of families with income $75k - 100k:
South Barrington:
12.1% (79)
State:
12.3% (24,156)
Number of families with income $100k - 125k:
South Barrington:
1.6% (11)
Illinois:
9.6% (18,808)
Number of families with income $150k - 200k:
South Barrington:
17.5% (114)
State:
13.9% (27,222)
Number of families with income > $200k:
South Barrington:
65.7% (427)
Illinois:
28.0% (54,999)
Median per capita income in South Barrington in 2022:
South Barrington:
$102,054
Illinois:
$52,977
Change in median per capita income between 2000 and 2022:
South Barrington, Illinois:
+23.9%
Illinois:
+119.5%
Income statistics for Multirace residents
Number of households with income < $10k:
South Barrington:
0.0% (0)
Illinois:
5.3% (21,595)
Number of households with income $10k - 20k:
South Barrington:
0.0% (0)
State:
6.5% (26,720)
Number of households with income $20k - 30k:
South Barrington:
0.0% (0)
State:
8.0% (32,573)
Number of households with income $30k - 40k:
South Barrington:
46.4% (26)
State:
8.4% (34,383)
Number of households with income $40k - 50k:
South Barrington:
0.0% (0)
State:
7.4% (30,234)
Number of households with income $50k - 60k:
South Barrington:
0.0% (0)
State:
6.9% (28,432)
Number of households with income $60k - 75k:
South Barrington:
0.0% (0)
Illinois:
10.2% (41,780)
Number of households with income $75k - 100k:
South Barrington:
0.0% (0)
State:
13.0% (53,426)
Number of households with income $100k - 125k:
South Barrington:
0.0% (0)
State:
10.5% (43,126)
Number of households with income $125k - 150k:
South Barrington:
0.0% (0)
State:
7.6% (31,153)
Number of households with income $150k - 200k:
South Barrington:
0.0% (0)
State:
7.6% (30,946)
Number of households with income > $200k:
South Barrington:
53.6% (30)
State:
8.6% (35,208)
Aggregate household income in South Barrington in 2022: $75,687,473
Median per capita income in South Barrington in 2022:
South Barrington:
$131,666
State:
$29,285
Change in median per capita income between 2000 and 2022:
South Barrington, Illinois:
+135.1%
State:
+112.9%
Discuss South Barrington, Illinois (IL) on our hugely popular Illinois forum.