Sierra Village, California (CA) income map, earnings map, and wages data

Data:
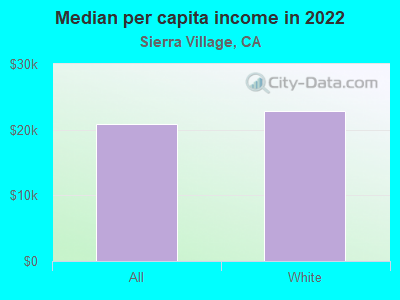
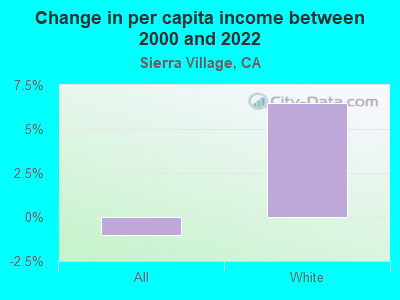
The per capita income in 2022 was $20,795, which means a constant level compared to 2000 when it was $21,015.
Whole page based on the data from 2000 / 2022 when the population of Sierra Village, California was 456 / 89
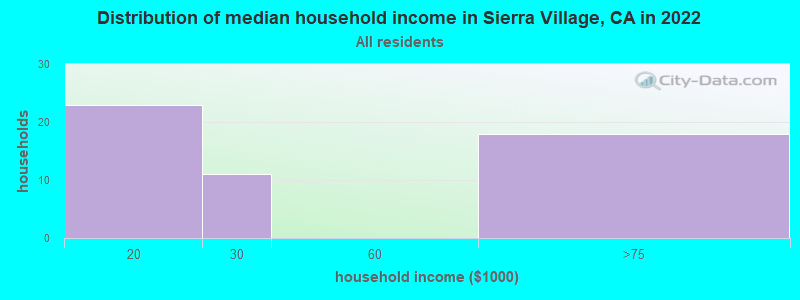
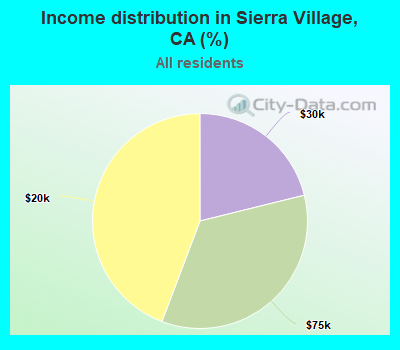
Income statistics for all residents
Number of households with income < $10k:| Sierra Village: | 0.0% (0) |
| State: | 4.8% (654,370) |
Number of households with income $10k - 20k:| Sierra Village: | 44.2% (23) |
| California: | 5.8% (789,493) |
Number of households with income $20k - 30k:| Sierra Village: | 21.2% (11) |
| State: | 5.7% (778,318) |
Number of households with income $30k - 40k:| Sierra Village: | 0.0% (0) |
| California: | 5.8% (783,170) |
Number of households with income $40k - 50k:| Sierra Village: | 0.0% (0) |
| California: | 5.8% (781,352) |
Number of households with income $50k - 60k:| Sierra Village: | 0.0% (0) |
| California: | 5.6% (760,175) |
Number of households with income $60k - 75k:| Sierra Village: | 34.6% (18) |
| California: | 8.2% (1,104,699) |
Number of households with income $75k - 100k:| Sierra Village: | 0.0% (0) |
| State: | 12.0% (1,627,633) |
Number of households with income $100k - 125k:| Sierra Village: | 0.0% (0) |
| State: | 10.0% (1,358,619) |
Number of households with income $125k - 150k:| Sierra Village: | 0.0% (0) |
| State: | 7.6% (1,027,455) |
Number of households with income $150k - 200k:| Sierra Village: | 0.0% (0) |
| California: | 10.6% (1,439,811) |
Number of households with income > $200k:| Sierra Village: | 0.0% (0) |
| State: | 18.0% (2,445,491) |
Aggregate household income in Sierra Village in 2022: $1,865,993
Median per capita income in Sierra Village in 2022:| Sierra Village: | $20,796 |
| State: | $46,661 |
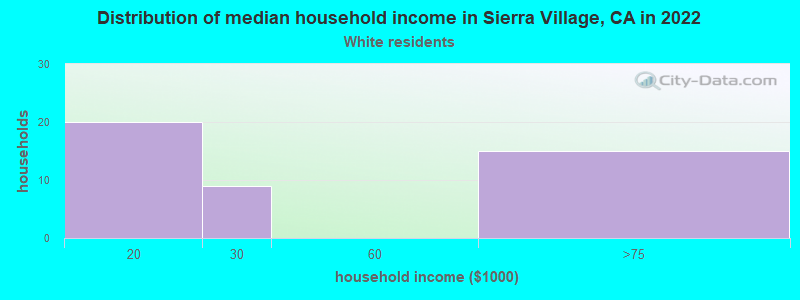
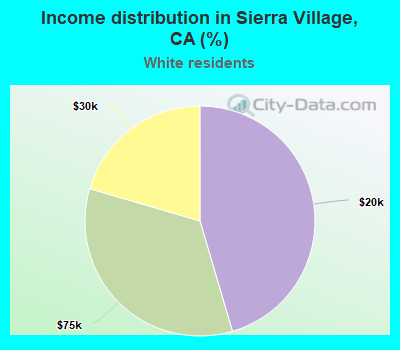
Income statistics for White residents
Number of households with income < $10k:| Sierra Village: | 0.0% (0) |
| State: | 4.4% (284,109) |
Number of households with income $10k - 20k:| Sierra Village: | 45.5% (20) |
| State: | 5.3% (340,330) |
Number of households with income $20k - 30k:| Sierra Village: | 20.5% (9) |
| State: | 5.3% (343,145) |
Number of households with income $30k - 40k:| Sierra Village: | 0.0% (0) |
| California: | 5.1% (330,146) |
Number of households with income $40k - 50k:| Sierra Village: | 0.0% (0) |
| State: | 5.2% (335,310) |
Number of households with income $50k - 60k:| Sierra Village: | 0.0% (0) |
| California: | 5.1% (326,299) |
Number of households with income $60k - 75k:| Sierra Village: | 34.1% (15) |
| California: | 7.6% (487,640) |
Number of households with income $75k - 100k:| Sierra Village: | 0.0% (0) |
| State: | 11.5% (736,578) |
Number of households with income $100k - 125k:| Sierra Village: | 0.0% (0) |
| State: | 10.1% (648,782) |
Number of households with income $125k - 150k:| Sierra Village: | 0.0% (0) |
| State: | 7.8% (499,671) |
Number of households with income $150k - 200k:| Sierra Village: | 0.0% (0) |
| State: | 11.4% (729,603) |
Number of households with income > $200k:| Sierra Village: | 0.0% (0) |
| State: | 21.2% (1,364,246) |
Aggregate household income in Sierra Village in 2022: $1,650,444
Median per capita income in Sierra Village in 2022:| Sierra Village: | $22,768 |
| California: | $61,706 |
Change in median per capita income between 2000 and 2022:| Sierra Village, California: | +6.5% |
| California: | +122.7% |