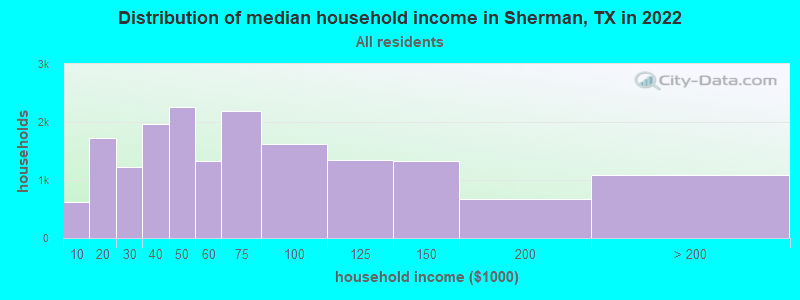
The median household income in Sherman, TX in 2022 was $57,582, which was 25.5% less than the median annual income of $72,284 across the entire state of Texas. Compared to the median income of $34,211 in 2000 this represents an increase of 40.6%. The per capita income in 2022 was $32,612, which means an increase of 42.6% compared to 2000 when it was $18,717.
Whole page based on the data from 2000 / 2022 when the population of Sherman, Texas was 35,082 / 46,021
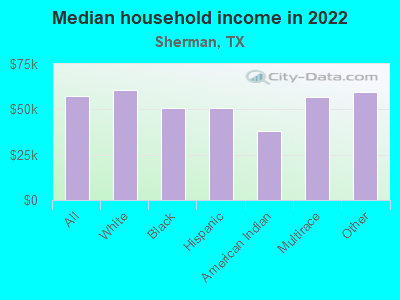
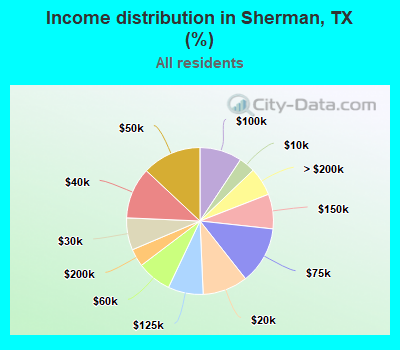
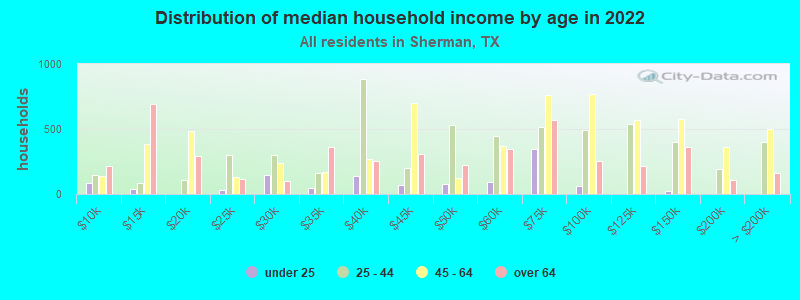
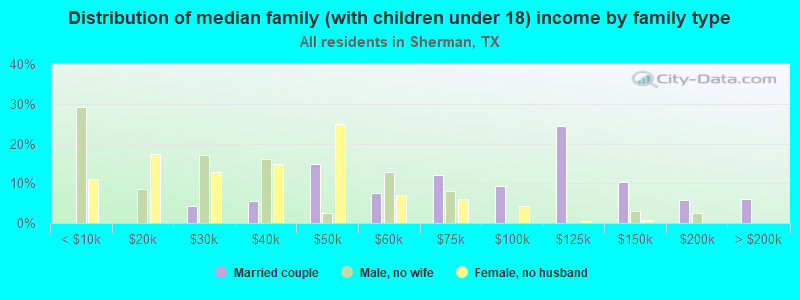
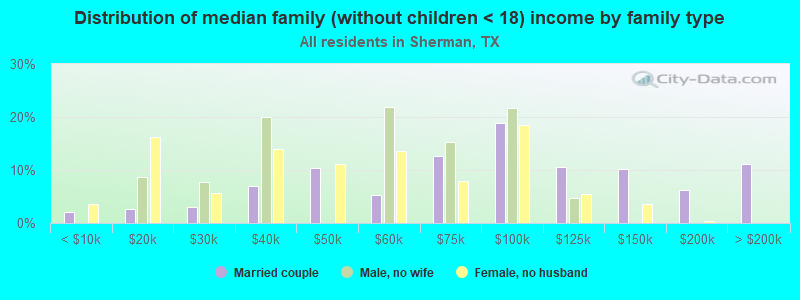
Income statistics for all residents
Median household income in Sherman, TX in 2022:
Sherman:
$57,583
Texas:
$72,284
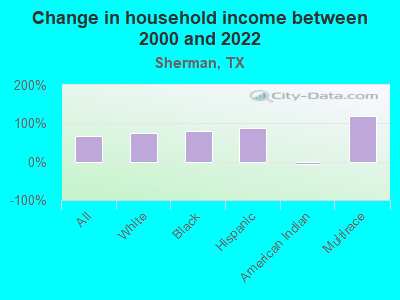
Change in median household income between 2000 and 2022:
Sherman, Texas:
+68.3%
State:
+81.0%
Number of households with income < $10k:
Sherman:
3.6% (620)
Texas:
5.5% (611,011)
Number of households with income $10k - 20k:
Sherman:
9.9% (1,725)
State:
6.7% (743,157)
Number of households with income $20k - 30k:
Sherman:
7.1% (1,229)
Texas:
7.2% (803,381)
Number of households with income $30k - 40k:
Sherman:
11.3% (1,961)
Texas:
7.8% (866,080)
Number of households with income $40k - 50k:
Sherman:
13.0% (2,256)
State:
7.3% (810,440)
Number of households with income $50k - 60k:
Sherman:
7.6% (1,323)
Texas:
7.2% (799,783)
Number of households with income $60k - 75k:
Sherman:
12.6% (2,192)
State:
9.9% (1,095,384)
Number of households with income $75k - 100k:
Sherman:
9.3% (1,614)
Texas:
12.8% (1,419,057)
Number of households with income $100k - 125k:
Sherman:
7.7% (1,344)
State:
9.5% (1,054,577)
Number of households with income $125k - 150k:
Sherman:
7.6% (1,325)
State:
6.7% (741,518)
Number of households with income $150k - 200k:
Sherman:
3.9% (680)
State:
8.7% (961,776)
Number of households with income > $200k:
Sherman:
6.2% (1,078)
Texas:
10.7% (1,181,544)
Aggregate household income in Sherman in 2022: $1,440,127,886
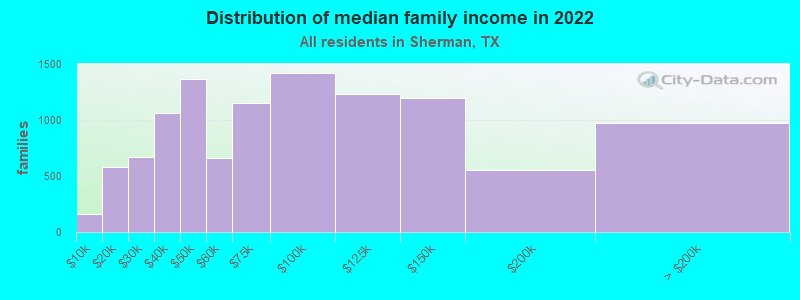
Median family income in Sherman in 2022:
Sherman:
$73,937
State:
$86,267
Number of families with income < $10k:
Sherman:
1.4% (157)
State:
4.0% (297,884)
Number of families with income $10k - 20k:
Sherman:
5.3% (580)
Texas:
4.3% (324,514)
Number of families with income $20k - 30k:
Sherman:
6.1% (667)
State:
5.8% (430,949)
Number of families with income $30k - 40k:
Sherman:
9.6% (1,061)
State:
6.6% (493,535)
Number of families with income $40k - 50k:
Sherman:
12.4% (1,367)
State:
6.7% (499,663)
Number of families with income $50k - 60k:
Sherman:
6.0% (660)
State:
6.6% (492,203)
Number of families with income $60k - 75k:
Sherman:
10.5% (1,154)
State:
9.5% (710,229)
Number of families with income $75k - 100k:
Sherman:
12.9% (1,418)
State:
13.6% (1,015,480)
Number of families with income $100k - 125k:
Sherman:
11.2% (1,230)
State:
10.7% (797,961)
Number of families with income $125k - 150k:
Sherman:
10.9% (1,199)
State:
8.1% (602,985)
Number of families with income $150k - 200k:
Sherman:
5.0% (555)
Texas:
10.7% (804,459)
Number of families with income > $200k:
Sherman:
8.8% (972)
Texas:
13.5% (1,013,514)
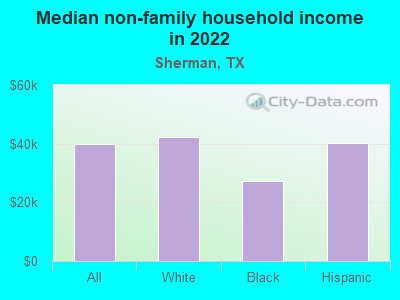
Median non-family income in Sherman in 2022:
Sherman:
$39,805
Texas:
$45,999
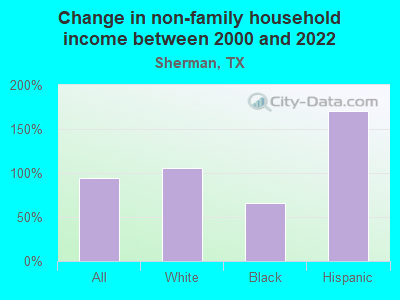
Change in median non-family income between 2000 and 2022:
Sherman, Texas:
+93.7%
Texas:
+79.5%
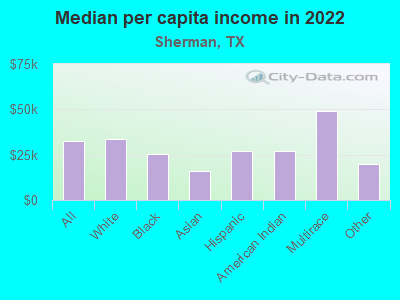
Median per capita income in Sherman in 2022:
Sherman:
$32,612
Texas:
$38,123
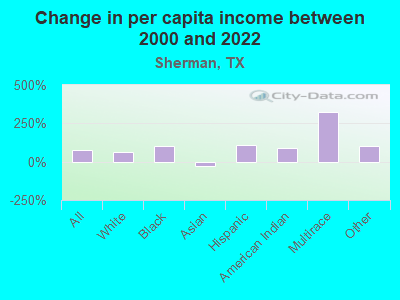
Change in median per capita income between 2000 and 2022:
Sherman, Texas:
+74.2%
State:
+94.3%
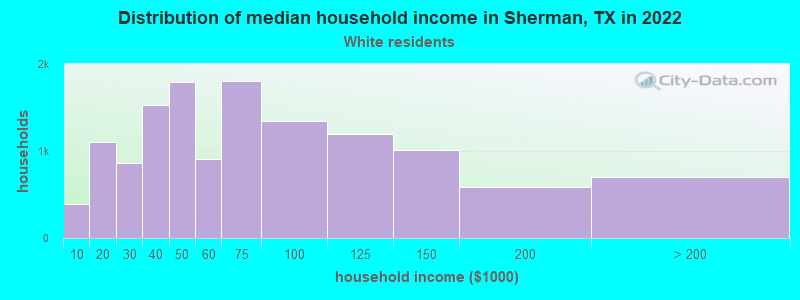
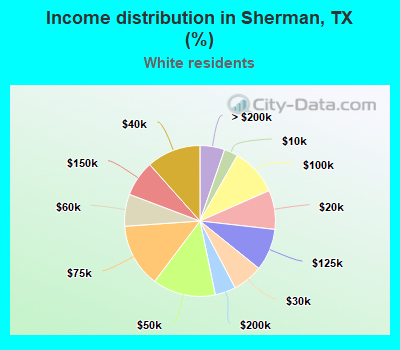
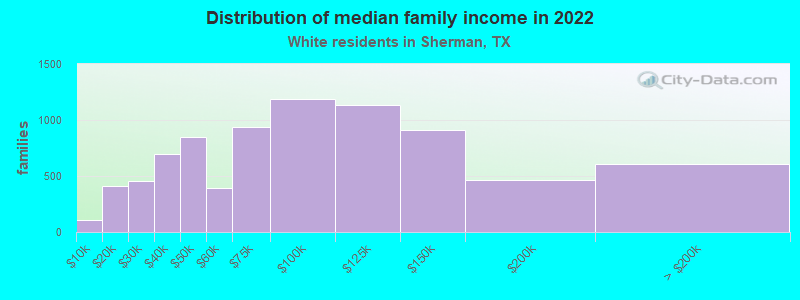
Income statistics for White residents
Median household income in Sherman, TX in 2022:
Sherman:
$60,507
State:
$82,032
Change in median household income between 2000 and 2022:
Sherman, Texas:
+73.8%
State:
+91.0%
Number of households with income < $10k:
Sherman:
2.9% (390)
State:
4.7% (273,716)
Number of households with income $10k - 20k:
Sherman:
8.4% (1,109)
State:
5.5% (322,702)
Number of households with income $20k - 30k:
Sherman:
6.5% (863)
State:
6.2% (363,947)
Number of households with income $30k - 40k:
Sherman:
11.6% (1,532)
Texas:
6.8% (399,275)
Number of households with income $40k - 50k:
Sherman:
13.5% (1,788)
Texas:
6.5% (383,417)
Number of households with income $50k - 60k:
Sherman:
6.9% (908)
State:
6.6% (388,535)
Number of households with income $60k - 75k:
Sherman:
13.6% (1,804)
Texas:
9.7% (566,295)
Number of households with income $75k - 100k:
Sherman:
10.2% (1,345)
State:
13.0% (760,276)
Number of households with income $100k - 125k:
Sherman:
9.0% (1,191)
State:
10.2% (597,596)
Number of households with income $125k - 150k:
Sherman:
7.7% (1,015)
State:
7.4% (436,830)
Number of households with income $150k - 200k:
Sherman:
4.4% (589)
State:
9.9% (583,067)
Number of households with income > $200k:
Sherman:
5.3% (702)
State:
13.5% (792,647)
Aggregate household income in Sherman in 2022: $1,061,763,396
Median family income in Sherman in 2022:
Sherman:
$80,831
State:
$101,788
Number of families with income < $10k:
Sherman:
1.4% (110)
State:
2.8% (108,142)
Number of families with income $10k - 20k:
Sherman:
5.0% (407)
State:
2.9% (113,421)
Number of families with income $20k - 30k:
Sherman:
5.5% (452)
State:
4.1% (157,688)
Number of families with income $30k - 40k:
Sherman:
8.6% (699)
State:
5.2% (198,847)
Number of families with income $40k - 50k:
Sherman:
10.4% (852)
Texas:
5.6% (216,490)
Number of families with income $50k - 60k:
Sherman:
4.9% (396)
State:
5.7% (220,689)
Number of families with income $60k - 75k:
Sherman:
11.5% (938)
State:
9.0% (346,106)
Number of families with income $75k - 100k:
Sherman:
14.6% (1,190)
State:
13.7% (527,363)
Number of families with income $100k - 125k:
Sherman:
13.9% (1,134)
Texas:
11.6% (448,411)
Number of families with income $125k - 150k:
Sherman:
11.2% (915)
State:
9.2% (355,798)
Number of families with income $150k - 200k:
Sherman:
5.7% (463)
State:
12.5% (480,185)
Number of families with income > $200k:
Sherman:
7.4% (605)
Texas:
17.6% (677,490)
Median non-family income in Sherman in 2022:
Sherman:
$42,323
Texas:
$50,587
Change in median non-family income between 2000 and 2022:
Sherman, Texas:
+106.3%
Texas:
+87.7%
Median per capita income in Sherman in 2022:
Sherman:
$33,736
State:
$47,740
Change in median per capita income between 2000 and 2022:
Sherman, Texas:
+65.2%
Texas:
+114.3%
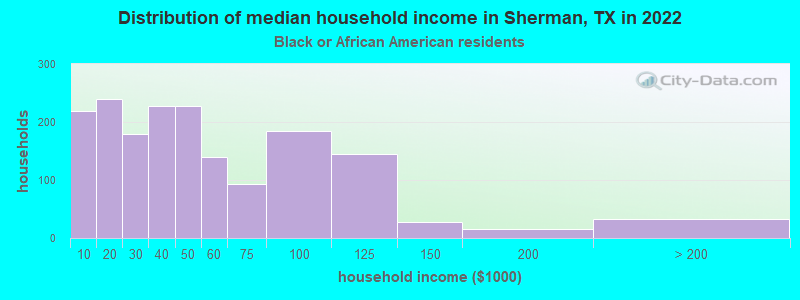
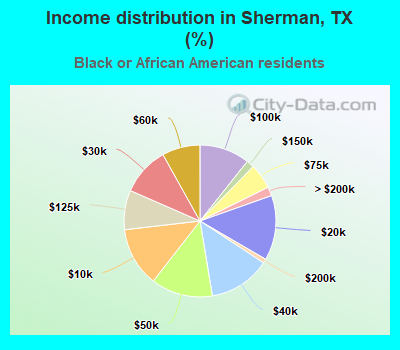
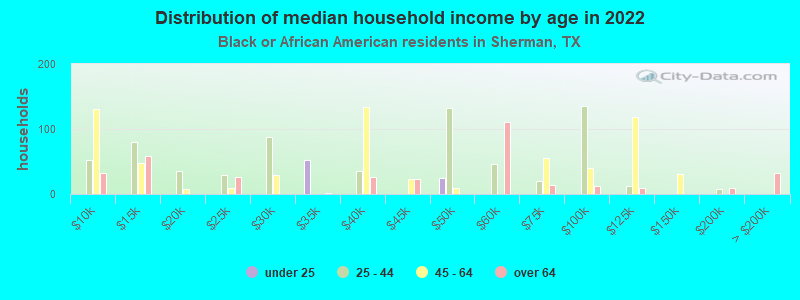
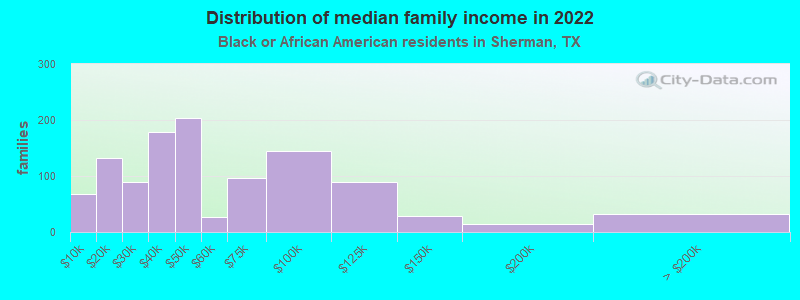
Income statistics for Black or African American residents
Median household income in Sherman, TX in 2022:
Sherman:
$50,845
Texas:
$55,759
Change in median household income between 2000 and 2022:
Sherman, Texas:
+80.1%
State:
+90.3%
Number of households with income < $10k:
Sherman:
12.7% (219)
State:
8.9% (126,378)
Number of households with income $10k - 20k:
Sherman:
13.8% (239)
Texas:
9.9% (140,369)
Number of households with income $20k - 30k:
Sherman:
10.3% (179)
Texas:
8.5% (120,639)
Number of households with income $30k - 40k:
Sherman:
13.1% (227)
State:
9.7% (137,517)
Number of households with income $40k - 50k:
Sherman:
13.1% (227)
State:
8.0% (112,973)
Number of households with income $50k - 60k:
Sherman:
8.1% (140)
Texas:
8.3% (117,156)
Number of households with income $60k - 75k:
Sherman:
5.4% (93)
State:
10.4% (147,462)
Number of households with income $75k - 100k:
Sherman:
10.7% (185)
State:
11.5% (162,718)
Number of households with income $100k - 125k:
Sherman:
8.4% (145)
Texas:
8.2% (115,829)
Number of households with income $125k - 150k:
Sherman:
1.6% (28)
State:
4.9% (69,556)
Number of households with income $150k - 200k:
Sherman:
0.9% (15)
State:
6.4% (90,701)
Number of households with income > $200k:
Sherman:
1.9% (33)
State:
5.5% (77,988)
Aggregate household income in Sherman in 2022: $122,211,633
Median family income in Sherman in 2022:
Sherman:
$64,376
Texas:
$69,134
Number of families with income < $10k:
Sherman:
6.1% (67)
State:
6.8% (55,625)
Number of families with income $10k - 20k:
Sherman:
12.0% (132)
State:
6.8% (55,300)
Number of families with income $20k - 30k:
Sherman:
8.1% (90)
State:
7.1% (57,877)
Number of families with income $30k - 40k:
Sherman:
16.2% (179)
State:
8.5% (68,776)
Number of families with income $40k - 50k:
Sherman:
18.4% (203)
State:
7.1% (57,907)
Number of families with income $50k - 60k:
Sherman:
2.4% (26)
State:
7.3% (59,511)
Number of families with income $60k - 75k:
Sherman:
8.8% (97)
State:
10.1% (81,994)
Number of families with income $75k - 100k:
Sherman:
13.0% (144)
Texas:
12.7% (103,723)
Number of families with income $100k - 125k:
Sherman:
8.1% (89)
State:
9.4% (76,609)
Number of families with income $125k - 150k:
Sherman:
2.6% (29)
State:
6.8% (55,615)
Number of families with income $150k - 200k:
Sherman:
1.4% (15)
Texas:
9.4% (76,146)
Number of families with income > $200k:
Sherman:
2.9% (32)
Texas:
7.9% (64,439)
Median non-family income in Sherman in 2022:
Sherman:
$27,265
State:
$40,133
Change in median non-family income between 2000 and 2022:
Sherman, Texas:
+66.4%
State:
+102.2%
Median per capita income in Sherman in 2022:
Sherman:
$25,423
State:
$30,490
Change in median per capita income between 2000 and 2022:
Sherman, Texas:
+101.6%
State:
+113.9%
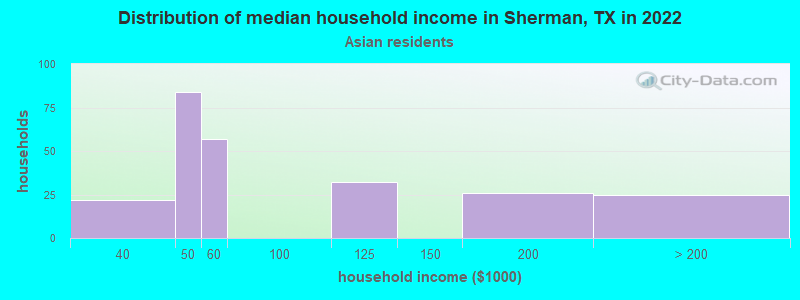
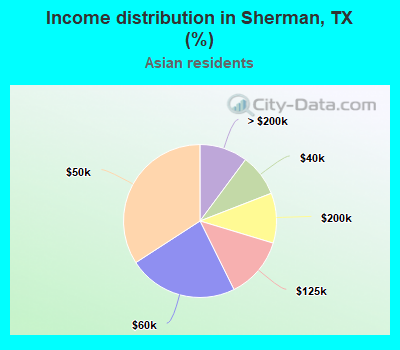
Income statistics for Asian residents
Number of households with income < $10k:
Sherman:
0.0% (0)
State:
5.2% (29,885)
Number of households with income $10k - 20k:
Sherman:
0.0% (0)
State:
4.7% (27,044)
Number of households with income $20k - 30k:
Sherman:
0.0% (0)
State:
4.1% (23,363)
Number of households with income $30k - 40k:
Sherman:
8.9% (22)
State:
4.1% (23,309)
Number of households with income $40k - 50k:
Sherman:
34.1% (84)
Texas:
5.2% (29,826)
Number of households with income $50k - 60k:
Sherman:
23.2% (57)
Texas:
4.7% (26,512)
Number of households with income $60k - 75k:
Sherman:
0.0% (0)
State:
6.5% (36,905)
Number of households with income $75k - 100k:
Sherman:
0.0% (0)
Texas:
11.3% (64,350)
Number of households with income $100k - 125k:
Sherman:
13.0% (32)
Texas:
11.4% (64,714)
Number of households with income $125k - 150k:
Sherman:
0.0% (0)
Texas:
9.3% (52,719)
Number of households with income $150k - 200k:
Sherman:
10.6% (26)
Texas:
12.5% (70,953)
Number of households with income > $200k:
Sherman:
10.2% (25)
State:
21.1% (120,260)
Aggregate household income in Sherman in 2022: $25,674,131
Median per capita income in Sherman in 2022:
Sherman:
$15,815
Texas:
$48,626
Change in median per capita income between 2000 and 2022:: -30.9%
Sherman, Texas:
-30.9%
State:
+132.0%
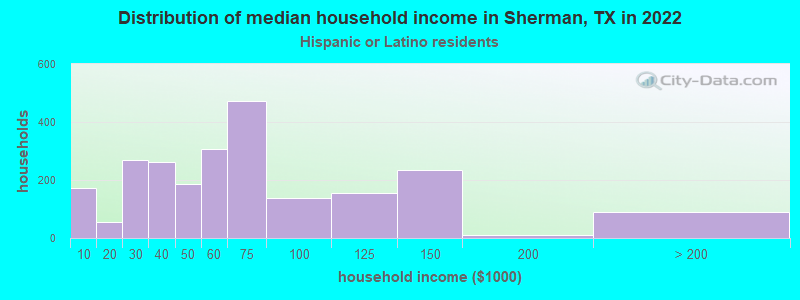
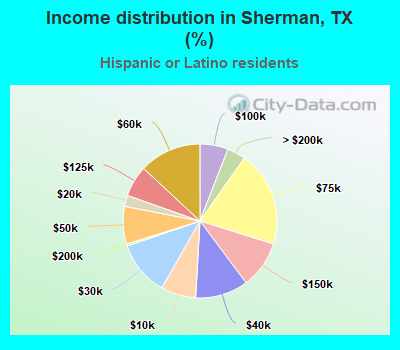
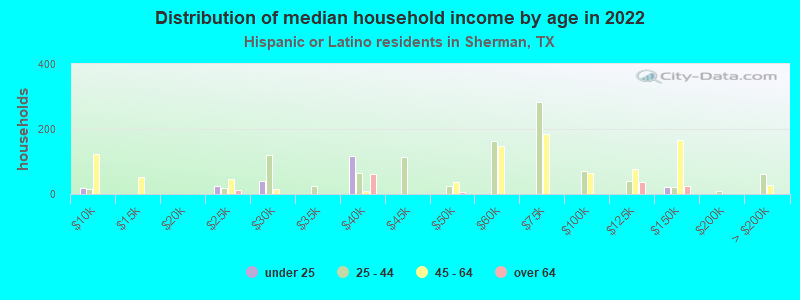
Income statistics for Hispanic or Latino residents
Median household income in Sherman, TX in 2022:
Sherman:
$50,834
Texas:
$60,504
Change in median household income between 2000 and 2022:
Sherman, Texas:
+87.0%
Texas:
+102.5%
Number of households with income < $10k:
Sherman:
7.4% (173)
State:
5.8% (213,953)
Number of households with income $10k - 20k:
Sherman:
2.3% (55)
State:
8.0% (297,456)
Number of households with income $20k - 30k:
Sherman:
11.5% (270)
State:
9.2% (340,166)
Number of households with income $30k - 40k:
Sherman:
11.1% (261)
State:
9.5% (354,336)
Number of households with income $40k - 50k:
Sherman:
7.9% (186)
State:
8.8% (327,013)
Number of households with income $50k - 60k:
Sherman:
13.0% (307)
State:
8.3% (308,818)
Number of households with income $60k - 75k:
Sherman:
20.1% (472)
State:
10.9% (405,109)
Number of households with income $75k - 100k:
Sherman:
5.9% (139)
Texas:
13.8% (511,639)
Number of households with income $100k - 125k:
Sherman:
6.5% (154)
Texas:
8.6% (319,728)
Number of households with income $125k - 150k:
Sherman:
10.0% (235)
State:
5.7% (210,932)
Number of households with income $150k - 200k:
Sherman:
0.4% (10)
Texas:
6.4% (236,055)
Number of households with income > $200k:
Sherman:
3.9% (91)
State:
5.1% (189,259)
Aggregate household income in Sherman in 2022: $286,629,940
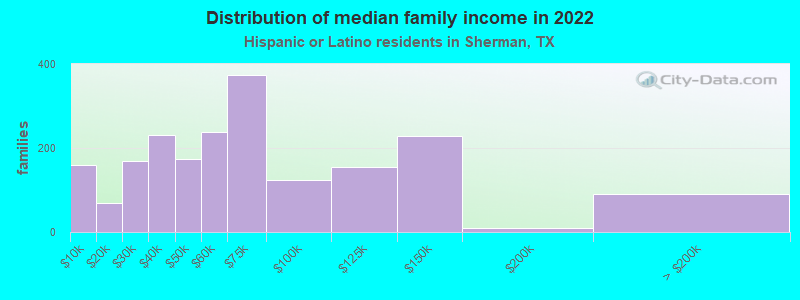
Median family income in Sherman in 2022:
Sherman:
$50,503
Texas:
$65,080
Number of families with income < $10k:
Sherman:
7.9% (160)
Texas:
5.3% (147,493)
Number of families with income $10k - 20k:
Sherman:
3.5% (70)
Texas:
6.3% (174,531)
Number of families with income $20k - 30k:
Sherman:
8.3% (168)
State:
8.6% (238,528)
Number of families with income $30k - 40k:
Sherman:
11.4% (230)
Texas:
9.1% (251,999)
Number of families with income $40k - 50k:
Sherman:
8.6% (174)
State:
8.6% (240,188)
Number of families with income $50k - 60k:
Sherman:
11.8% (238)
State:
8.0% (223,566)
Number of families with income $60k - 75k:
Sherman:
18.5% (375)
Texas:
10.9% (302,688)
Number of families with income $75k - 100k:
Sherman:
6.1% (123)
Texas:
14.3% (398,554)
Number of families with income $100k - 125k:
Sherman:
7.6% (154)
State:
9.5% (264,007)
Number of families with income $125k - 150k:
Sherman:
11.3% (228)
State:
6.2% (171,274)
Number of families with income $150k - 200k:
Sherman:
0.5% (10)
Texas:
7.3% (202,259)
Number of families with income > $200k:
Sherman:
4.5% (91)
Texas:
5.9% (165,129)
Median non-family income in Sherman in 2022:
Sherman:
$40,226
State:
$39,934
Median per capita income in Sherman in 2022:
Sherman:
$26,981
State:
$24,862
Change in median per capita income between 2000 and 2022:
Sherman, Texas:
+105.6%
State:
+130.8%
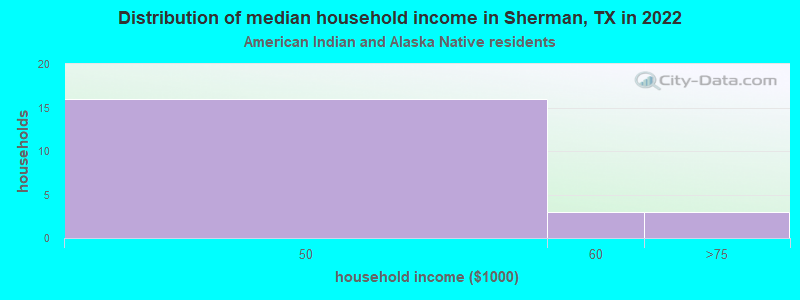
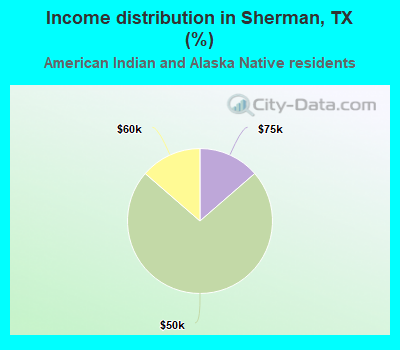
Income statistics for American Indian and Alaska Native residents
Median household income in Sherman, TX in 2022:
Sherman:
$38,296
State:
$65,765
Change in median household income between 2000 and 2022:: -4.9%
Sherman, Texas:
-4.9%
State:
+88.3%
Number of households with income < $10k:
Sherman:
0.0% (0)
State:
4.1% (3,398)
Number of households with income $10k - 20k:
Sherman:
0.0% (0)
Texas:
8.3% (6,949)
Number of households with income $20k - 30k:
Sherman:
0.0% (0)
State:
9.3% (7,742)
Number of households with income $30k - 40k:
Sherman:
0.0% (0)
Texas:
9.1% (7,627)
Number of households with income $40k - 50k:
Sherman:
72.7% (16)
Texas:
7.1% (5,922)
Number of households with income $50k - 60k:
Sherman:
13.6% (3)
State:
8.1% (6,761)
Number of households with income $60k - 75k:
Sherman:
13.6% (3)
State:
12.7% (10,588)
Number of households with income $75k - 100k:
Sherman:
0.0% (0)
State:
13.0% (10,903)
Number of households with income $100k - 125k:
Sherman:
0.0% (0)
State:
9.9% (8,256)
Number of households with income $125k - 150k:
Sherman:
0.0% (0)
Texas:
5.2% (4,355)
Number of households with income $150k - 200k:
Sherman:
0.0% (0)
State:
6.7% (5,623)
Number of households with income > $200k:
Sherman:
0.0% (0)
State:
6.6% (5,522)
Aggregate household income in Sherman in 2022: $458,044
Median per capita income in Sherman in 2022:
Sherman:
$27,221
State:
$28,166
Change in median per capita income between 2000 and 2022:
Sherman, Texas:
+86.7%
Texas:
+77.2%
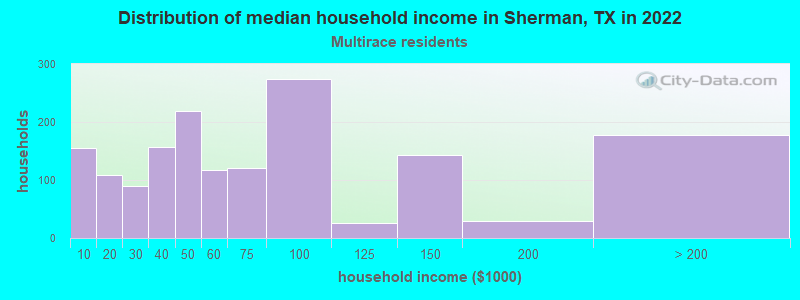
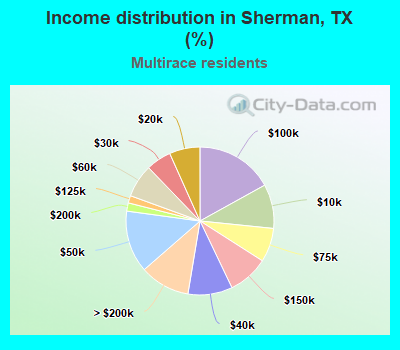
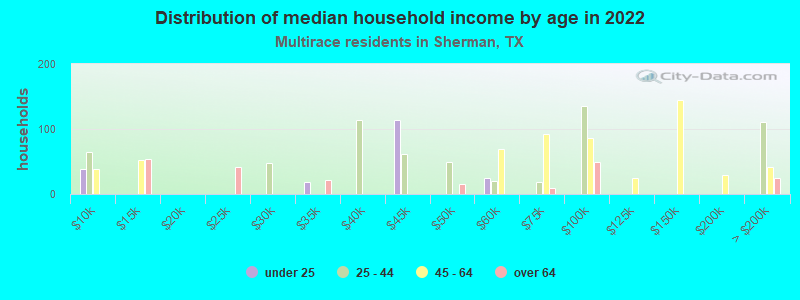
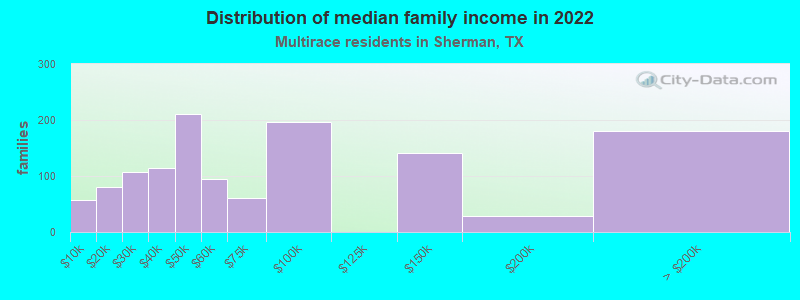
Income statistics for Multirace residents
Median household income in Sherman, TX in 2022:
Sherman:
$56,681
State:
$62,748
Change in median household income between 2000 and 2022:
Sherman, Texas:
+117.8%
State:
+92.3%
Number of households with income < $10k:
Sherman:
9.7% (156)
State:
5.5% (122,324)
Number of households with income $10k - 20k:
Sherman:
6.7% (108)
Texas:
8.2% (182,232)
Number of households with income $20k - 30k:
Sherman:
5.5% (89)
State:
8.5% (189,456)
Number of households with income $30k - 40k:
Sherman:
9.7% (157)
State:
8.9% (197,499)
Number of households with income $40k - 50k:
Sherman:
13.6% (219)
State:
8.7% (191,735)
Number of households with income $50k - 60k:
Sherman:
7.2% (117)
Texas:
8.0% (177,535)
Number of households with income $60k - 75k:
Sherman:
7.4% (120)
State:
10.5% (232,479)
Number of households with income $75k - 100k:
Sherman:
17.0% (274)
State:
13.1% (290,448)
Number of households with income $100k - 125k:
Sherman:
1.6% (26)
State:
8.6% (191,595)
Number of households with income $125k - 150k:
Sherman:
8.9% (143)
Texas:
6.0% (133,361)
Number of households with income $150k - 200k:
Sherman:
1.8% (29)
State:
7.2% (159,195)
Number of households with income > $200k:
Sherman:
11.0% (177)
State:
6.7% (148,064)
Aggregate household income in Sherman in 2022: $232,738,338
Median family income in Sherman in 2022:
Sherman:
$56,298
Texas:
$69,780
Number of families with income < $10k:
Sherman:
4.4% (57)
State:
4.4% (70,825)
Number of families with income $10k - 20k:
Sherman:
6.4% (81)
State:
5.9% (95,279)
Number of families with income $20k - 30k:
Sherman:
8.5% (108)
State:
7.8% (126,627)
Number of families with income $30k - 40k:
Sherman:
9.0% (115)
State:
8.5% (137,626)
Number of families with income $40k - 50k:
Sherman:
16.6% (211)
State:
8.4% (135,809)
Number of families with income $50k - 60k:
Sherman:
7.4% (94)
Texas:
7.9% (127,739)
Number of families with income $60k - 75k:
Sherman:
4.8% (61)
State:
10.5% (169,549)
Number of families with income $75k - 100k:
Sherman:
15.5% (197)
Texas:
14.0% (226,284)
Number of families with income $125k - 150k:
Sherman:
11.1% (141)
State:
6.7% (107,900)
Number of families with income $150k - 200k:
Sherman:
2.3% (29)
State:
8.5% (137,607)
Number of families with income > $200k:
Sherman:
14.1% (180)
Texas:
7.9% (127,299)
Median per capita income in Sherman in 2022:
Sherman:
$49,043
State:
$26,785
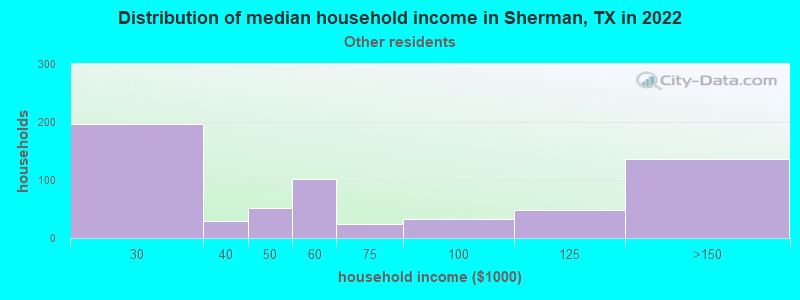
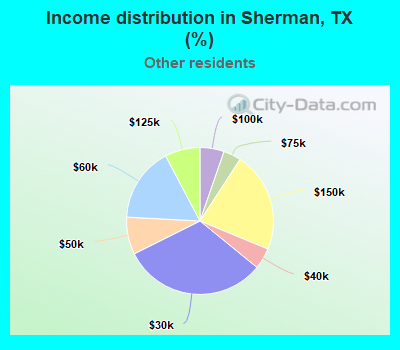
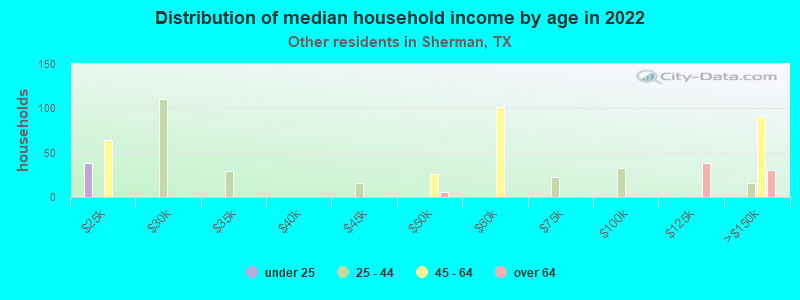
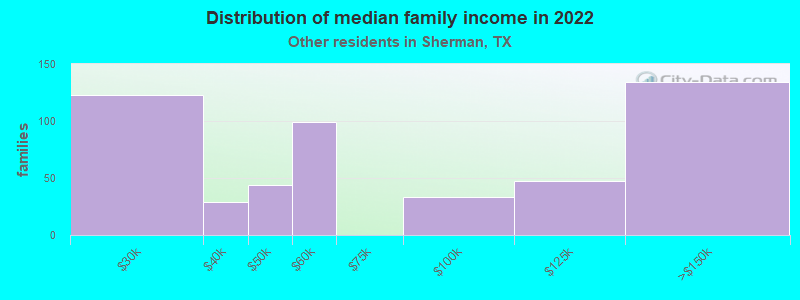
Income statistics for other residents
Median household income in Sherman, TX in 2022:
Sherman:
$59,406
State:
$57,114
Number of households with income < $10k:
Sherman:
0.0% (0)
State:
5.9% (54,162)
Number of households with income $10k - 20k:
Sherman:
0.0% (0)
State:
6.8% (62,891)
Number of households with income $20k - 30k:
Sherman:
31.7% (197)
Texas:
10.6% (97,294)
Number of households with income $30k - 40k:
Sherman:
4.7% (29)
State:
10.8% (99,670)
Number of households with income $40k - 50k:
Sherman:
8.2% (51)
State:
9.3% (85,548)
Number of households with income $50k - 60k:
Sherman:
16.4% (102)
State:
9.0% (82,757)
Number of households with income $60k - 75k:
Sherman:
3.9% (24)
Texas:
10.9% (100,326)
Number of households with income $75k - 100k:
Sherman:
5.3% (33)
Texas:
14.0% (128,767)
Number of households with income $100k - 125k:
Sherman:
7.7% (48)
Texas:
8.2% (75,218)
Number of households with income $125k - 150k:
Sherman:
22.1% (137)
State:
4.8% (44,223)
Number of households with income $150k - 200k:
Sherman:
0.0% (0)
State:
5.6% (51,376)
Number of households with income > $200k:
Sherman:
0.0% (0)
State:
4.0% (36,393)
Aggregate household income in Sherman in 2022: $67,412,016
Median family income in Sherman in 2022:
Sherman:
$59,451
State:
$60,064
Number of families with income $20k - 30k:
Sherman:
24.1% (123)
State:
9.9% (68,761)
Number of families with income $30k - 40k:
Sherman:
5.8% (29)
State:
9.7% (67,685)
Number of families with income $40k - 50k:
Sherman:
8.7% (44)
Texas:
9.0% (62,441)
Number of families with income $50k - 60k:
Sherman:
19.3% (99)
Texas:
8.5% (59,321)
Number of families with income $75k - 100k:
Sherman:
6.5% (33)
State:
14.5% (101,032)
Number of families with income $100k - 125k:
Sherman:
9.3% (47)
State:
8.8% (61,439)
Number of families with income $125k - 150k:
Sherman:
26.3% (134)
Texas:
5.1% (35,727)
Median per capita income in Sherman in 2022:
Sherman:
$19,581
State:
$23,899
Change in median per capita income between 2000 and 2022:
Sherman, Texas:
+98.6%
State:
+135.2%
Discuss Sherman, Texas (TX) on our hugely popular Texas forum.