The median household income in Seymour, IL in 2022 was $118,881, which was 35.5% greater than the median annual income of $76,708 across the entire state of Illinois. Compared to the median income of $37,780 in 2000 this represents an increase of 68.2%. The per capita income in 2022 was $36,793, which means an increase of 46.4% compared to 2000 when it was $19,708.
Whole page based on the data from 2000 / 2022 when the population of Seymour, Illinois was 303 / 283
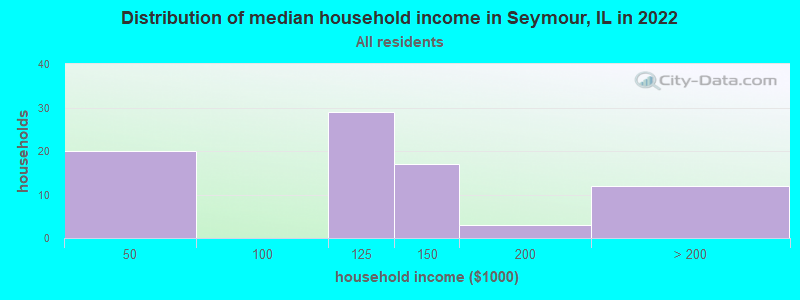
Income statistics for all residents
Median household income in Seymour, IL in 2022:
Seymour:
$118,881
State:
$76,708
Number of households with income < $10k:
Seymour:
0.0% (0)
Illinois:
5.9% (296,090)
Number of households with income $10k - 20k:
Seymour:
0.0% (0)
State:
6.6% (333,259)
Number of households with income $20k - 30k:
Seymour:
0.0% (0)
Illinois:
6.8% (342,921)
Number of households with income $30k - 40k:
Seymour:
0.0% (0)
State:
7.0% (355,254)
Number of households with income $40k - 50k:
Seymour:
24.7% (20)
State:
6.7% (340,678)
Number of households with income $50k - 60k:
Seymour:
0.0% (0)
State:
6.7% (339,405)
Number of households with income $60k - 75k:
Seymour:
0.0% (0)
Illinois:
9.2% (465,709)
Number of households with income $75k - 100k:
Seymour:
0.0% (0)
State:
12.9% (651,353)
Number of households with income $100k - 125k:
Seymour:
35.8% (29)
State:
10.3% (522,359)
Number of households with income $125k - 150k:
Seymour:
21.0% (17)
Illinois:
7.3% (367,136)
Number of households with income $150k - 200k:
Seymour:
3.7% (3)
State:
9.0% (455,249)
Number of households with income > $200k:
Seymour:
14.8% (12)
Illinois:
11.6% (586,947)
Aggregate household income in Seymour in 2022: $9,803,660
Median family income in Seymour in 2022:
Seymour:
$121,445
State:
$96,948
Number of families with income $40k - 50k:
Seymour:
22.8% (18)
State:
5.8% (181,164)
Number of families with income $100k - 125k:
Seymour:
38.4% (30)
Illinois:
11.9% (373,296)
Number of families with income $125k - 150k:
Seymour:
19.0% (15)
Illinois:
8.9% (279,791)
Number of families with income $150k - 200k:
Seymour:
3.9% (3)
Illinois:
11.9% (372,004)
Number of families with income > $200k:
Seymour:
15.9% (13)
Illinois:
15.9% (500,033)
Median income for 4 person families:
Seymour:
$95,677
State:
$120,079
Median income for families with 0 earners:
Seymour:
$0
State:
$51,619
Median income for families with 1 earner:
Seymour:
$0
Illinois:
$64,303
Median income for families with 2 earners:
Seymour:
$146,681
State:
$122,565
Median income for families with 3+ earners:
Seymour:
$0
State:
$145,010
Median per capita income in Seymour in 2022:
Seymour:
$36,794
State:
$43,317
Change in median per capita income between 2000 and 2022:
Seymour, Illinois:
+86.7%
State:
+87.5%
Income statistics for White residents
Median household income in Seymour, IL in 2022:
Seymour:
$118,582
Illinois:
$83,346
Number of households with income < $10k:
Seymour:
0.0% (0)
State:
4.5% (149,895)
Number of households with income $10k - 20k:
Seymour:
0.0% (0)
State:
5.5% (184,529)
Number of households with income $20k - 30k:
Seymour:
0.0% (0)
State:
6.1% (205,767)
Number of households with income $30k - 40k:
Seymour:
0.0% (0)
Illinois:
6.7% (225,572)
Number of households with income $40k - 50k:
Seymour:
26.2% (21)
State:
6.5% (216,965)
Number of households with income $50k - 60k:
Seymour:
0.0% (0)
Illinois:
6.6% (222,841)
Number of households with income $60k - 75k:
Seymour:
0.0% (0)
State:
9.3% (312,758)
Number of households with income $75k - 100k:
Seymour:
0.0% (0)
State:
12.9% (433,180)
Number of households with income $100k - 125k:
Seymour:
36.2% (29)
State:
10.7% (360,753)
Number of households with income $125k - 150k:
Seymour:
18.8% (15)
Illinois:
7.9% (266,532)
Number of households with income $150k - 200k:
Seymour:
3.8% (3)
State:
10.0% (337,357)
Number of households with income > $200k:
Seymour:
15.0% (12)
State:
13.3% (446,069)
Aggregate household income in Seymour in 2022: $9,333,380
Median family income in Seymour in 2022:
Seymour:
$125,439
State:
$107,938
Number of families with income $40k - 50k:
Seymour:
26.4% (22)
Illinois:
5.0% (102,597)
Number of families with income $100k - 125k:
Seymour:
38.2% (31)
Illinois:
12.5% (256,099)
Number of families with income $125k - 150k:
Seymour:
15.6% (13)
State:
9.8% (199,855)
Number of families with income $150k - 200k:
Seymour:
4.0% (3)
Illinois:
13.4% (274,569)
Number of families with income > $200k:
Seymour:
15.8% (13)
Illinois:
18.6% (381,354)
Median per capita income in Seymour in 2022:
Seymour:
$36,612
State:
$50,738
Change in median per capita income between 2000 and 2022:
Seymour, Illinois:
+68.7%
State:
+95.5%
Discuss Seymour, Illinois (IL) on our hugely popular Illinois forum.