The median household income in Scranton, SC in 2022 was $25,386, which was 152.6% less than the median annual income of $64,115 across the entire state of South Carolina. Compared to the median income of $24,605 in 2000 this represents an increase of 3.1%. The per capita income in 2022 was $19,610, which means an increase of 33.2% compared to 2000 when it was $13,094.
Whole page based on the data from 2000 / 2022 when the population of Scranton, South Carolina was 942 / 895
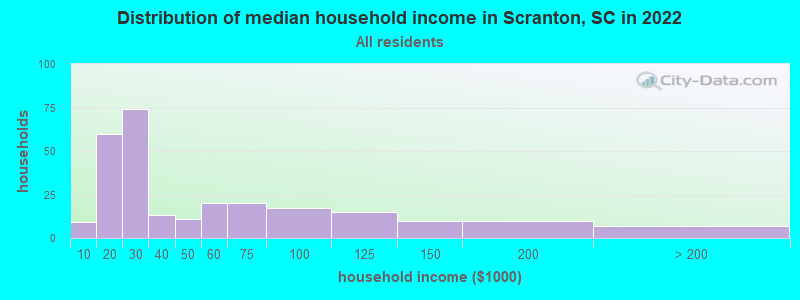
Income statistics for all residents
Median household income in Scranton, SC in 2022:
Scranton:
$25,387
South Carolina:
$64,115
Change in median household income between 2000 and 2022:
Scranton, South Carolina:
+3.2%
State:
+72.9%
Number of households with income < $10k:
Scranton:
3.4% (9)
South Carolina:
6.1% (130,922)
Number of households with income $10k - 20k:
Scranton:
22.6% (60)
South Carolina:
7.9% (168,918)
Number of households with income $20k - 30k:
Scranton:
27.8% (74)
State:
8.0% (171,564)
Number of households with income $30k - 40k:
Scranton:
4.9% (13)
State:
9.2% (195,662)
Number of households with income $40k - 50k:
Scranton:
4.1% (11)
State:
8.2% (176,179)
Number of households with income $50k - 60k:
Scranton:
7.5% (20)
South Carolina:
7.5% (159,159)
Number of households with income $60k - 75k:
Scranton:
7.5% (20)
South Carolina:
9.9% (211,862)
Number of households with income $75k - 100k:
Scranton:
6.4% (17)
State:
13.5% (287,601)
Number of households with income $100k - 125k:
Scranton:
5.6% (15)
State:
9.3% (199,068)
Number of households with income $125k - 150k:
Scranton:
3.8% (10)
State:
6.2% (133,330)
Number of households with income $150k - 200k:
Scranton:
3.8% (10)
South Carolina:
6.6% (141,363)
Number of households with income > $200k:
Scranton:
2.6% (7)
State:
7.5% (160,452)
Aggregate household income in Scranton in 2022: $13,957,776
Median non-family income in Scranton in 2022:
Scranton:
$27,243
South Carolina:
$38,426
Change in median non-family income between 2000 and 2022:
Scranton, South Carolina:
+130.2%
State:
+78.7%
Median per capita income in Scranton in 2022:
Scranton:
$19,611
State:
$36,675
Change in median per capita income between 2000 and 2022:
Scranton, South Carolina:
+49.8%
State:
+95.1%
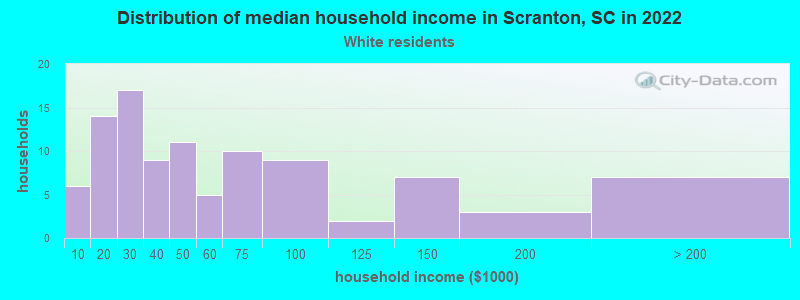
Income statistics for White residents
Median household income in Scranton, SC in 2022:
Scranton:
$43,798
State:
$73,516
Change in median household income between 2000 and 2022:
Scranton, South Carolina:
+13.6%
State:
+74.8%
Number of households with income < $10k:
Scranton:
6.0% (6)
South Carolina:
4.8% (68,379)
Number of households with income $10k - 20k:
Scranton:
14.0% (14)
State:
5.9% (85,105)
Number of households with income $20k - 30k:
Scranton:
17.0% (17)
State:
7.1% (101,178)
Number of households with income $30k - 40k:
Scranton:
9.0% (9)
State:
8.0% (114,877)
Number of households with income $40k - 50k:
Scranton:
11.0% (11)
South Carolina:
7.9% (112,749)
Number of households with income $50k - 60k:
Scranton:
5.0% (5)
South Carolina:
7.1% (101,835)
Number of households with income $60k - 75k:
Scranton:
10.0% (10)
South Carolina:
10.2% (145,879)
Number of households with income $75k - 100k:
Scranton:
9.0% (9)
State:
14.0% (200,068)
Number of households with income $100k - 125k:
Scranton:
2.0% (2)
South Carolina:
10.4% (148,542)
Number of households with income $125k - 150k:
Scranton:
7.0% (7)
State:
7.3% (105,118)
Number of households with income $150k - 200k:
Scranton:
3.0% (3)
State:
8.0% (114,506)
Number of households with income > $200k:
Scranton:
7.0% (7)
State:
9.3% (133,550)
Aggregate household income in Scranton in 2022: $6,207,103
Median family income in Scranton in 2022:
Scranton:
$61,506
State:
$90,709
Number of families with income $10k - 20k:
Scranton:
36.5% (27)
South Carolina:
3.0% (28,325)
Number of families with income $20k - 30k:
Scranton:
2.2% (2)
South Carolina:
4.4% (42,131)
Number of families with income $30k - 40k:
Scranton:
0.6% (0)
State:
6.1% (57,510)
Number of families with income $40k - 50k:
Scranton:
8.5% (6)
State:
7.0% (66,712)
Number of families with income $50k - 60k:
Scranton:
9.9% (7)
State:
6.6% (62,489)
Number of families with income $60k - 75k:
Scranton:
13.8% (10)
South Carolina:
10.0% (94,724)
Number of families with income $75k - 100k:
Scranton:
3.5% (3)
State:
15.5% (147,207)
Number of families with income $100k - 125k:
Scranton:
3.0% (2)
State:
12.5% (118,160)
Number of families with income $125k - 150k:
Scranton:
10.1% (7)
State:
9.5% (90,395)
Number of families with income $150k - 200k:
Scranton:
4.1% (3)
South Carolina:
10.6% (100,043)
Number of families with income > $200k:
Scranton:
7.7% (6)
South Carolina:
12.4% (117,500)
Median non-family income in Scranton in 2022:
Scranton:
$23,478
State:
$42,596
Change in median non-family income between 2000 and 2022:
Scranton, South Carolina:
+34.2%
State:
+74.9%
Median per capita income in Scranton in 2022:
Scranton:
$22,098
State:
$42,728
Change in median per capita income between 2000 and 2022:
Scranton, South Carolina:
+29.0%
State:
+93.4%
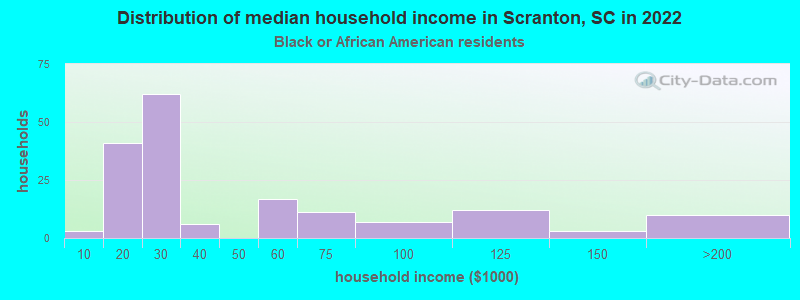
Income statistics for Black or African American residents
Median household income in Scranton, SC in 2022:
Scranton:
$22,010
South Carolina:
$44,187
Change in median household income between 2000 and 2022:
Scranton, South Carolina:
+43.3%
South Carolina:
+76.5%
Number of households with income < $10k:
Scranton:
1.7% (3)
State:
10.0% (52,303)
Number of households with income $10k - 20k:
Scranton:
23.8% (41)
South Carolina:
13.4% (69,913)
Number of households with income $20k - 30k:
Scranton:
36.0% (62)
State:
10.4% (54,216)
Number of households with income $30k - 40k:
Scranton:
3.5% (6)
South Carolina:
12.0% (62,722)
Number of households with income $40k - 50k:
Scranton:
0.0% (0)
State:
9.2% (47,773)
Number of households with income $50k - 60k:
Scranton:
9.9% (17)
South Carolina:
8.3% (43,083)
Number of households with income $60k - 75k:
Scranton:
6.4% (11)
South Carolina:
9.3% (48,640)
Number of households with income $75k - 100k:
Scranton:
4.1% (7)
South Carolina:
12.2% (63,723)
Number of households with income $100k - 125k:
Scranton:
7.0% (12)
State:
6.4% (33,117)
Number of households with income $125k - 150k:
Scranton:
1.7% (3)
State:
3.2% (16,465)
Number of households with income $150k - 200k:
Scranton:
5.8% (10)
State:
3.2% (16,672)
Number of households with income > $200k:
Scranton:
0.0% (0)
South Carolina:
2.3% (12,213)
Aggregate household income in Scranton in 2022: $7,637,762
Median family income in Scranton in 2022:
Scranton:
$20,045
State:
$54,267
Number of families with income < $10k:
Scranton:
2.1% (3)
State:
7.3% (23,752)
Number of families with income $10k - 20k:
Scranton:
22.8% (37)
South Carolina:
8.5% (27,789)
Number of families with income $20k - 30k:
Scranton:
46.5% (75)
South Carolina:
9.4% (30,766)
Number of families with income $30k - 40k:
Scranton:
0.9% (2)
State:
11.6% (37,651)
Number of families with income $50k - 60k:
Scranton:
11.3% (18)
South Carolina:
8.7% (28,419)
Number of families with income $75k - 100k:
Scranton:
1.1% (2)
State:
15.2% (49,441)
Number of families with income $100k - 125k:
Scranton:
8.0% (13)
State:
8.6% (27,974)
Number of families with income $150k - 200k:
Scranton:
7.4% (12)
South Carolina:
4.5% (14,809)
Median per capita income in Scranton in 2022:
Scranton:
$16,637
State:
$24,863
Change in median per capita income between 2000 and 2022:
Scranton, South Carolina:
+79.7%
State:
+111.1%
Income statistics for Hispanic or Latino residents
Number of households with income < $10k:
Scranton:
0.0% (0)
State:
7.1% (7,036)
Number of households with income $10k - 20k:
Scranton:
0.0% (0)
South Carolina:
5.4% (5,379)
Number of households with income $20k - 30k:
Scranton:
0.0% (0)
South Carolina:
10.0% (9,993)
Number of households with income $30k - 40k:
Scranton:
0.0% (0)
South Carolina:
11.9% (11,872)
Number of households with income $40k - 50k:
Scranton:
0.0% (0)
South Carolina:
8.3% (8,239)
Number of households with income $50k - 60k:
Scranton:
100.0% (15)
State:
8.5% (8,475)
Number of households with income $60k - 75k:
Scranton:
0.0% (0)
State:
9.4% (9,330)
Number of households with income $75k - 100k:
Scranton:
0.0% (0)
South Carolina:
14.5% (14,491)
Number of households with income $100k - 125k:
Scranton:
0.0% (0)
South Carolina:
8.1% (8,026)
Number of households with income $125k - 150k:
Scranton:
0.0% (0)
State:
6.3% (6,313)
Number of households with income $150k - 200k:
Scranton:
0.0% (0)
State:
5.0% (4,963)
Number of households with income > $200k:
Scranton:
0.0% (0)
State:
5.6% (5,548)
Median per capita income in Scranton in 2022:
Scranton:
$17,833
State:
$23,692
Income statistics for Multirace residents
Median per capita income in Scranton in 2022:
Scranton:
$10,619
State:
$26,391
Change in median per capita income between 2000 and 2022:
Scranton, South Carolina:
+125.9%
South Carolina:
+120.8%
Discuss Scranton, South Carolina (SC) on our hugely popular South Carolina forum.