Rutland, Wisconsin (WI) income map, earnings map, and wages data
The median household income in Rutland, WI in 2022 was $111,573, which was 36.4% greater than the median annual income of $70,996 across the entire state of Wisconsin. Compared to the median income of $64,740 in 2000 this represents an increase of 42.0%. The per capita income in 2022 was $56,901, which means an increase of 51.3% compared to 2000 when it was $27,695.
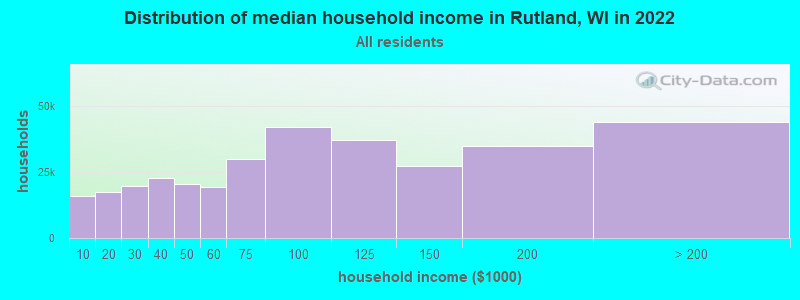
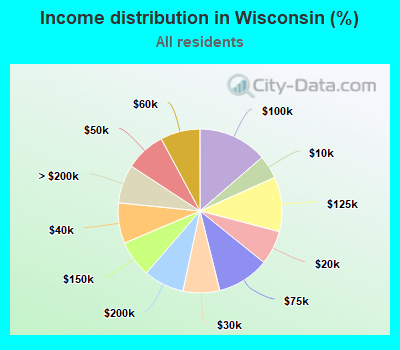
Income statistics for all residents
Median household income in Rutland, WI in 2022:| Rutland: | $111,573 |
| State: | $70,996 |
Change in median household income between 2000 and 2022:| Rutland, Wisconsin: | +72.3% |
| State: | +62.1% |
Number of households with income < $10k:| Rutland: | 4.8% (16,010) |
| State: | 4.6% (115,058) |
Number of households with income $10k - 20k:| Rutland: | 5.3% (17,523) |
| State: | 6.7% (167,685) |
Number of households with income $20k - 30k:| Rutland: | 6.0% (19,777) |
| State: | 7.2% (180,435) |
Number of households with income $30k - 40k:| Rutland: | 6.9% (22,730) |
| Wisconsin: | 8.0% (199,167) |
Number of households with income $40k - 50k:| Rutland: | 6.1% (20,350) |
| State: | 7.9% (197,648) |
Number of households with income $50k - 60k:| Rutland: | 5.8% (19,392) |
| Wisconsin: | 7.8% (195,297) |
Number of households with income $60k - 75k:| Rutland: | 9.1% (30,074) |
| Wisconsin: | 10.3% (256,633) |
Number of households with income $75k - 100k:| Rutland: | 12.7% (42,224) |
| State: | 13.7% (340,492) |
Number of households with income $100k - 125k:| Rutland: | 11.2% (37,078) |
| Wisconsin: | 10.8% (268,847) |
Number of households with income $125k - 150k:| Rutland: | 8.2% (27,268) |
| State: | 7.3% (180,911) |
Number of households with income $150k - 200k:| Rutland: | 10.6% (35,130) |
| State: | 8.0% (199,297) |
Number of households with income > $200k:| Rutland: | 13.3% (44,062) |
| State: | 7.6% (189,651) |
Aggregate household income in Rutland in 2022: $704,234,080
Median family income in Rutland in 2022:| Rutland: | $124,966 |
| Wisconsin: | $91,700 |
Median non-family income in Rutland in 2022:| Rutland: | $81,155 |
| Wisconsin: | $42,812 |
Change in median non-family income between 2000 and 2022:| Rutland, Wisconsin: | +66.5% |
| State: | +65.7% |
Median per capita income in Rutland in 2022:| Rutland: | $56,902 |
| Wisconsin: | $40,188 |
Change in median per capita income between 2000 and 2022:| Rutland, Wisconsin: | +105.5% |
| Wisconsin: | +88.9% |
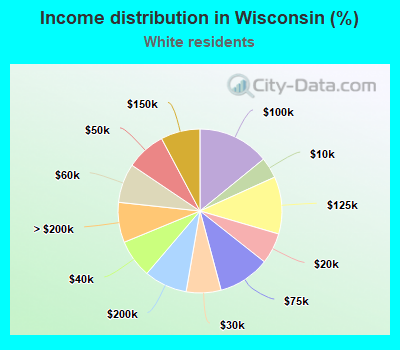
Income statistics for White residents
Median household income in Rutland, WI in 2022:| Rutland: | $113,407 |
| State: | $74,405 |
Change in median household income between 2000 and 2022:| Rutland, Wisconsin: | +74.3% |
| State: | +64.5% |
Number of households with income < $10k:| Rutland: | 4.2% (11,190) |
| State: | 4.1% (87,410) |
Number of households with income $10k - 20k:| Rutland: | 4.6% (12,143) |
| State: | 6.1% (129,511) |
Number of households with income $20k - 30k:| Rutland: | 5.9% (15,686) |
| Wisconsin: | 6.9% (145,235) |
Number of households with income $30k - 40k:| Rutland: | 6.2% (16,421) |
| State: | 7.6% (160,205) |
Number of households with income $40k - 50k:| Rutland: | 5.9% (15,832) |
| State: | 7.8% (165,627) |
Number of households with income $50k - 60k:| Rutland: | 6.0% (15,989) |
| State: | 7.7% (163,506) |
Number of households with income $60k - 75k:| Rutland: | 9.0% (23,981) |
| State: | 10.2% (216,479) |
Number of households with income $75k - 100k:| Rutland: | 13.1% (34,945) |
| State: | 14.1% (298,984) |
Number of households with income $100k - 125k:| Rutland: | 11.4% (30,297) |
| State: | 11.3% (239,588) |
Number of households with income $125k - 150k:| Rutland: | 9.1% (24,367) |
| Wisconsin: | 7.8% (164,502) |
Number of households with income $150k - 200k:| Rutland: | 11.1% (29,524) |
| State: | 8.5% (180,048) |
Number of households with income > $200k:| Rutland: | 13.6% (36,331) |
| State: | 7.9% (167,999) |
Aggregate household income in Rutland in 2022: $587,251,785
Median family income in Rutland in 2022:| Rutland: | $129,390 |
| State: | $96,327 |
Number of families with income $10k - 20k:| Rutland: | 1.8% (11) |
| Wisconsin: | 2.4% (30,426) |
Number of families with income $20k - 30k:| Rutland: | 2.1% (13) |
| Wisconsin: | 3.5% (45,298) |
Number of families with income $30k - 40k:| Rutland: | 2.4% (15) |
| State: | 4.9% (62,935) |
Number of families with income $40k - 50k:| Rutland: | 3.5% (21) |
| State: | 6.0% (76,575) |
Number of families with income $50k - 60k:| Rutland: | 3.3% (21) |
| State: | 6.9% (88,079) |
Number of families with income $60k - 75k:| Rutland: | 12.7% (79) |
| Wisconsin: | 10.6% (136,022) |
Number of families with income $75k - 100k:| Rutland: | 14.0% (87) |
| State: | 16.0% (204,807) |
Number of families with income $100k - 125k:| Rutland: | 18.5% (115) |
| State: | 14.3% (183,287) |
Number of families with income $125k - 150k:| Rutland: | 6.1% (38) |
| State: | 10.2% (131,464) |
Number of families with income $150k - 200k:| Rutland: | 24.6% (153) |
| State: | 12.1% (155,060) |
Number of families with income > $200k:| Rutland: | 10.9% (68) |
| State: | 11.2% (143,836) |
Median non-family income in Rutland in 2022:| Rutland: | $82,755 |
| State: | $44,213 |
Change in median non-family income between 2000 and 2022:| Rutland, Wisconsin: | +69.8% |
| State: | +68.5% |
Median per capita income in Rutland in 2022:| Rutland: | $58,730 |
| State: | $43,415 |
Change in median per capita income between 2000 and 2022:| Rutland, Wisconsin: | +109.5% |
| State: | +94.0% |
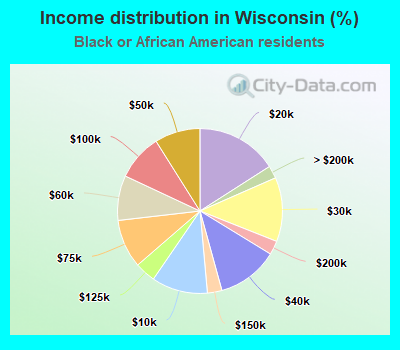
Income statistics for Black or African American residents
Median household income in Rutland, WI in 2022:| Rutland: | $144,755 |
| State: | $38,730 |
Change in median household income between 2000 and 2022:| Rutland, Wisconsin: | +59.1% |
| State: | +51.4% |
Number of households with income < $10k:| Rutland: | 9.5% (3,182) |
| State: | 11.0% (14,900) |
Number of households with income $10k - 20k:| Rutland: | 14.9% (4,985) |
| State: | 15.9% (21,616) |
Number of households with income $20k - 30k:| Rutland: | 7.6% (2,547) |
| Wisconsin: | 12.6% (17,065) |
Number of households with income $30k - 40k:| Rutland: | 11.9% (3,981) |
| State: | 12.0% (16,231) |
Number of households with income $40k - 50k:| Rutland: | 7.9% (2,654) |
| Wisconsin: | 8.9% (12,116) |
Number of households with income $50k - 60k:| Rutland: | 4.4% (1,473) |
| State: | 8.8% (11,937) |
Number of households with income $60k - 75k:| Rutland: | 7.1% (2,382) |
| State: | 9.5% (12,924) |
Number of households with income $75k - 100k:| Rutland: | 14.7% (4,942) |
| State: | 9.1% (12,306) |
Number of households with income $100k - 125k:| Rutland: | 4.4% (1,466) |
| Wisconsin: | 4.1% (5,525) |
Number of households with income $125k - 150k:| Rutland: | 2.8% (939) |
| State: | 2.9% (3,872) |
Number of households with income $150k - 200k:| Rutland: | 4.8% (1,618) |
| State: | 2.7% (3,690) |
Number of households with income > $200k:| Rutland: | 10.0% (3,363) |
| Wisconsin: | 2.5% (3,360) |
Aggregate household income in Rutland in 2022: $1,521,552
Median family income in Rutland in 2022:| Rutland: | $179,554 |
| State: | $50,061 |
Median per capita income in Rutland in 2022:| Rutland: | $121,727 |
| Wisconsin: | $22,861 |
Change in median per capita income between 2000 and 2022:| Rutland, Wisconsin: | +118.9% |
| State: | +87.6% |
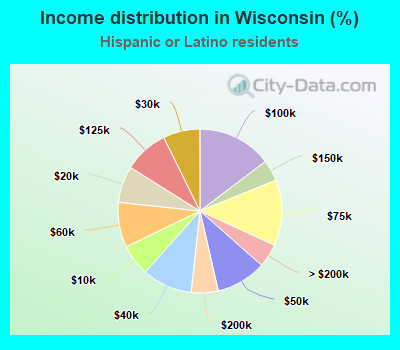
Income statistics for Hispanic or Latino residents
Median household income in Rutland, WI in 2022:| Rutland: | $196,164 |
| State: | $60,422 |
Change in median household income between 2000 and 2022:| Rutland, Wisconsin: | +88.4% |
| Wisconsin: | +72.7% |
Number of households with income < $10k:| Rutland: | 6.0% (2,225) |
| Wisconsin: | 6.2% (7,841) |
Number of households with income $10k - 20k:| Rutland: | 2.5% (912) |
| Wisconsin: | 7.2% (9,100) |
Number of households with income $20k - 30k:| Rutland: | 7.2% (2,671) |
| Wisconsin: | 7.3% (9,213) |
Number of households with income $30k - 40k:| Rutland: | 14.0% (5,200) |
| State: | 9.9% (12,505) |
Number of households with income $40k - 50k:| Rutland: | 6.7% (2,466) |
| State: | 9.9% (12,552) |
Number of households with income $50k - 60k:| Rutland: | 7.7% (2,836) |
| Wisconsin: | 8.9% (11,263) |
Number of households with income $60k - 75k:| Rutland: | 15.5% (5,739) |
| State: | 13.0% (16,458) |
Number of households with income $75k - 100k:| Rutland: | 10.7% (3,974) |
| State: | 14.7% (18,587) |
Number of households with income $100k - 125k:| Rutland: | 11.6% (4,294) |
| State: | 8.8% (11,136) |
Number of households with income $125k - 150k:| Rutland: | 2.6% (970) |
| State: | 4.2% (5,292) |
Number of households with income $150k - 200k:| Rutland: | 6.6% (2,427) |
| Wisconsin: | 5.3% (6,737) |
Number of households with income > $200k:| Rutland: | 9.0% (3,333) |
| State: | 4.6% (5,851) |
Aggregate household income in Rutland in 2022: $9,445,727
Median family income in Rutland in 2022:| Rutland: | $230,633 |
| State: | $62,574 |
Number of families with income $10k - 20k:| Rutland: | 5.7% (2) |
| State: | 5.3% (4,663) |
Number of families with income $20k - 30k:| Rutland: | 2.2% (1) |
| Wisconsin: | 6.5% (5,706) |
Number of families with income $30k - 40k:| Rutland: | 12.5% (5) |
| State: | 10.7% (9,335) |
Number of families with income $40k - 50k:| Rutland: | 6.5% (3) |
| Wisconsin: | 9.6% (8,400) |
Number of families with income $50k - 60k:| Rutland: | 6.3% (2) |
| State: | 7.1% (6,250) |
Number of families with income $60k - 75k:| Rutland: | 7.6% (3) |
| State: | 12.1% (10,577) |
Number of families with income $75k - 100k:| Rutland: | 18.2% (7) |
| State: | 15.1% (13,191) |
Number of families with income $100k - 125k:| Rutland: | 20.2% (8) |
| Wisconsin: | 10.4% (9,073) |
Number of families with income $125k - 150k:| Rutland: | 0.8% (0) |
| State: | 5.1% (4,509) |
Number of families with income $150k - 200k:| Rutland: | 13.6% (5) |
| State: | 5.7% (5,013) |
Number of families with income > $200k:| Rutland: | 6.4% (2) |
| State: | 5.0% (4,360) |
Median per capita income in Rutland in 2022:| Rutland: | $62,719 |
| Wisconsin: | $23,991 |
Change in median per capita income between 2000 and 2022:| Rutland, Wisconsin: | +136.2% |
| Wisconsin: | +108.6% |
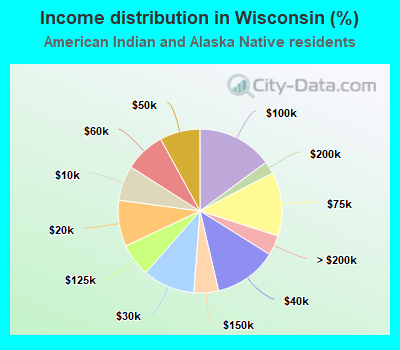
Income statistics for American Indian and Alaska Native residents
Median household income in Rutland, WI in 2022:| Rutland: | $31,661 |
| State: | $54,790 |
Number of households with income < $10k:| Rutland: | 6.9% (660) |
| Wisconsin: | 6.9% (1,103) |
Number of households with income $10k - 20k:| Rutland: | 9.2% (875) |
| State: | 9.1% (1,458) |
Number of households with income $20k - 30k:| Rutland: | 10.2% (979) |
| State: | 10.2% (1,636) |
Number of households with income $30k - 40k:| Rutland: | 12.4% (1,186) |
| State: | 12.5% (1,993) |
Number of households with income $40k - 50k:| Rutland: | 8.0% (762) |
| State: | 7.9% (1,269) |
Number of households with income $50k - 60k:| Rutland: | 8.0% (766) |
| Wisconsin: | 8.0% (1,284) |
Number of households with income $60k - 75k:| Rutland: | 12.6% (1,207) |
| State: | 12.6% (2,013) |
Number of households with income $75k - 100k:| Rutland: | 14.8% (1,418) |
| Wisconsin: | 14.9% (2,380) |
Number of households with income $100k - 125k:| Rutland: | 6.6% (627) |
| Wisconsin: | 6.5% (1,043) |
Number of households with income $125k - 150k:| Rutland: | 4.8% (463) |
| Wisconsin: | 4.9% (778) |
Number of households with income $150k - 200k:| Rutland: | 2.4% (234) |
| State: | 2.5% (392) |
Number of households with income > $200k:| Rutland: | 3.9% (376) |
| State: | 3.9% (631) |
Aggregate household income in Rutland in 2022: $203,449
Median family income in Rutland in 2022:| Rutland: | $72,343 |
| State: | $56,417 |
Median per capita income in Rutland in 2022:| Rutland: | $12,912 |
| Wisconsin: | $25,398 |
Change in median per capita income between 2000 and 2022:| Rutland, Wisconsin: | +38.2% |
| Wisconsin: | +87.6% |
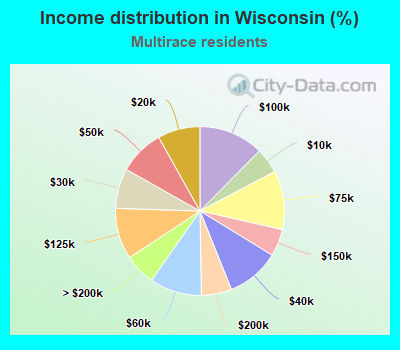
Income statistics for Multirace residents
Median household income in Rutland, WI in 2022:| Rutland: | $125,107 |
| State: | $60,490 |
Change in median household income between 2000 and 2022:| Rutland, Wisconsin: | +96.2% |
| State: | +69.6% |
Number of households with income < $10k:| Rutland: | 2.7% (819) |
| State: | 4.8% (6,288) |
Number of households with income $10k - 20k:| Rutland: | 8.3% (2,533) |
| State: | 8.1% (10,562) |
Number of households with income $20k - 30k:| Rutland: | 5.8% (1,765) |
| State: | 7.7% (9,975) |
Number of households with income $30k - 40k:| Rutland: | 12.8% (3,906) |
| State: | 10.2% (13,246) |
Number of households with income $40k - 50k:| Rutland: | 6.4% (1,938) |
| Wisconsin: | 8.7% (11,305) |
Number of households with income $50k - 60k:| Rutland: | 7.4% (2,260) |
| State: | 10.0% (12,968) |
Number of households with income $60k - 75k:| Rutland: | 12.2% (3,721) |
| Wisconsin: | 11.3% (14,655) |
Number of households with income $75k - 100k:| Rutland: | 9.5% (2,889) |
| Wisconsin: | 12.4% (16,181) |
Number of households with income $100k - 125k:| Rutland: | 13.6% (4,130) |
| State: | 9.8% (12,743) |
Number of households with income $125k - 150k:| Rutland: | 4.7% (1,430) |
| State: | 5.2% (6,773) |
Number of households with income $150k - 200k:| Rutland: | 5.6% (1,699) |
| Wisconsin: | 5.8% (7,552) |
Number of households with income > $200k:| Rutland: | 10.9% (3,325) |
| Wisconsin: | 6.0% (7,788) |
Aggregate household income in Rutland in 2022: $3,301,395
Median family income in Rutland in 2022:| Rutland: | $136,678 |
| Wisconsin: | $69,897 |
Number of families with income $60k - 75k:| Rutland: | 100.0% (24) |
| Wisconsin: | 10.7% (8,955) |
Median per capita income in Rutland in 2022:| Rutland: | $53,188 |
| Wisconsin: | $24,783 |