The median household income in Rothbury, MI in 2022 was $45,179, which was 48.3% less than the median annual income of $66,986 across the entire state of Michigan. Compared to the median income of $30,357 in 2000 this represents an increase of 32.8%. The per capita income in 2022 was $23,952, which means an increase of 38.0% compared to 2000 when it was $14,846.
Whole page based on the data from 2000 / 2022 when the population of Rothbury, Michigan was 416 / 354
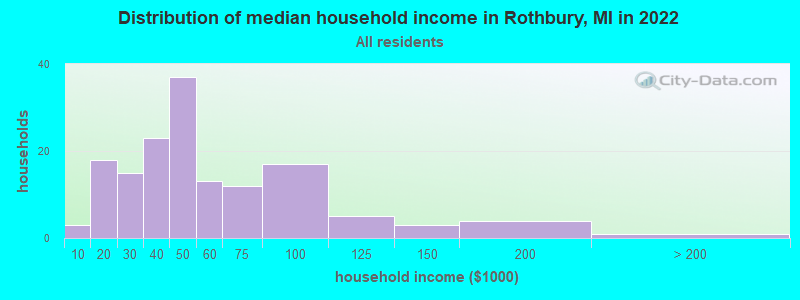
Income statistics for all residents
Median household income in Rothbury, MI in 2022:
Rothbury:
$45,179
State:
$66,986
Change in median household income between 2000 and 2022:
Rothbury, Michigan:
+48.8%
State:
+50.0%
Number of households with income < $10k:
Rothbury:
2.0% (3)
State:
5.7% (231,223)
Number of households with income $10k - 20k:
Rothbury:
11.9% (18)
State:
7.5% (306,955)
Number of households with income $20k - 30k:
Rothbury:
9.9% (15)
Michigan:
7.9% (324,153)
Number of households with income $30k - 40k:
Rothbury:
15.2% (23)
Michigan:
8.3% (341,408)
Number of households with income $40k - 50k:
Rothbury:
24.5% (37)
Michigan:
7.9% (322,255)
Number of households with income $50k - 60k:
Rothbury:
8.6% (13)
Michigan:
7.5% (305,914)
Number of households with income $60k - 75k:
Rothbury:
7.9% (12)
Michigan:
10.1% (414,440)
Number of households with income $75k - 100k:
Rothbury:
11.3% (17)
Michigan:
13.2% (538,299)
Number of households with income $100k - 125k:
Rothbury:
3.3% (5)
State:
9.7% (396,282)
Number of households with income $125k - 150k:
Rothbury:
2.0% (3)
State:
6.7% (273,144)
Number of households with income $150k - 200k:
Rothbury:
2.6% (4)
State:
7.5% (305,077)
Number of households with income > $200k:
Rothbury:
0.7% (1)
State:
8.1% (330,644)
Aggregate household income in Rothbury in 2022: $8,045,450
Median family income in Rothbury in 2022:
Rothbury:
$46,023
State:
$85,865
Number of families with income < $10k:
Rothbury:
1.3% (1)
Michigan:
3.5% (89,010)
Number of families with income $10k - 20k:
Rothbury:
10.4% (9)
State:
3.9% (100,567)
Number of families with income $20k - 30k:
Rothbury:
4.7% (4)
State:
5.0% (127,320)
Number of families with income $30k - 40k:
Rothbury:
9.3% (8)
State:
6.4% (163,565)
Number of families with income $40k - 50k:
Rothbury:
34.6% (30)
State:
6.8% (172,384)
Number of families with income $50k - 60k:
Rothbury:
4.7% (4)
State:
7.1% (179,870)
Number of families with income $60k - 75k:
Rothbury:
9.7% (8)
State:
10.3% (263,723)
Number of families with income $75k - 100k:
Rothbury:
11.6% (10)
State:
15.0% (383,364)
Number of families with income $100k - 125k:
Rothbury:
5.7% (5)
State:
11.8% (301,751)
Number of families with income $125k - 150k:
Rothbury:
3.4% (3)
Michigan:
8.6% (220,338)
Number of families with income $150k - 200k:
Rothbury:
3.4% (3)
State:
10.2% (259,462)
Number of families with income > $200k:
Rothbury:
1.2% (1)
State:
11.3% (287,206)
Median non-family income in Rothbury in 2022:
Rothbury:
$35,486
State:
$40,459
Change in median non-family income between 2000 and 2022:
Rothbury, Michigan:
+80.2%
Michigan:
+54.5%
Median per capita income in Rothbury in 2022:
Rothbury:
$23,952
State:
$38,151
Change in median per capita income between 2000 and 2022:
Rothbury, Michigan:
+61.3%
Michigan:
+72.1%
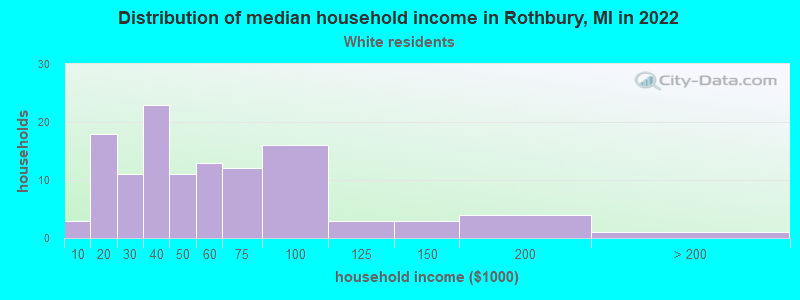
Income statistics for White residents
Median household income in Rothbury, MI in 2022:
Rothbury:
$43,813
State:
$71,609
Change in median household income between 2000 and 2022:
Rothbury, Michigan:
+47.6%
Michigan:
+52.9%
Number of households with income < $10k:
Rothbury:
2.5% (3)
Michigan:
4.4% (140,440)
Number of households with income $10k - 20k:
Rothbury:
15.3% (18)
State:
6.5% (205,547)
Number of households with income $20k - 30k:
Rothbury:
9.3% (11)
State:
7.6% (242,254)
Number of households with income $30k - 40k:
Rothbury:
19.5% (23)
State:
8.1% (257,175)
Number of households with income $40k - 50k:
Rothbury:
9.3% (11)
State:
7.8% (246,839)
Number of households with income $50k - 60k:
Rothbury:
11.0% (13)
State:
7.4% (233,723)
Number of households with income $60k - 75k:
Rothbury:
10.2% (12)
State:
10.4% (328,664)
Number of households with income $75k - 100k:
Rothbury:
13.6% (16)
State:
13.6% (431,867)
Number of households with income $100k - 125k:
Rothbury:
2.5% (3)
Michigan:
10.3% (325,164)
Number of households with income $125k - 150k:
Rothbury:
2.5% (3)
State:
7.1% (226,232)
Number of households with income $150k - 200k:
Rothbury:
3.4% (4)
Michigan:
8.1% (255,445)
Number of households with income > $200k:
Rothbury:
0.8% (1)
Michigan:
8.7% (276,727)
Aggregate household income in Rothbury in 2022: $6,309,798
Median family income in Rothbury in 2022:
Rothbury:
$55,235
State:
$90,317
Number of families with income $10k - 20k:
Rothbury:
15.4% (9)
State:
3.2% (64,106)
Number of families with income $20k - 30k:
Rothbury:
7.2% (4)
State:
4.6% (91,551)
Number of families with income $30k - 40k:
Rothbury:
13.4% (8)
Michigan:
5.9% (117,356)
Number of families with income $40k - 50k:
Rothbury:
10.2% (6)
Michigan:
6.4% (127,491)
Number of families with income $50k - 60k:
Rothbury:
6.7% (4)
State:
6.8% (135,883)
Number of families with income $60k - 75k:
Rothbury:
13.9% (8)
State:
10.5% (209,130)
Number of families with income $75k - 100k:
Rothbury:
16.8% (10)
Michigan:
15.5% (309,815)
Number of families with income $100k - 125k:
Rothbury:
5.0% (3)
State:
12.4% (248,235)
Number of families with income $125k - 150k:
Rothbury:
5.0% (3)
Michigan:
9.2% (182,895)
Number of families with income $150k - 200k:
Rothbury:
4.9% (3)
Michigan:
11.0% (218,573)
Number of families with income > $200k:
Rothbury:
1.7% (1)
State:
12.0% (239,713)
Median non-family income in Rothbury in 2022:
Rothbury:
$34,868
Michigan:
$42,438
Change in median non-family income between 2000 and 2022:
Rothbury, Michigan:
+77.1%
State:
+56.8%
Median per capita income in Rothbury in 2022:
Rothbury:
$22,964
Michigan:
$41,514
Change in median per capita income between 2000 and 2022:
Rothbury, Michigan:
+55.8%
State:
+75.2%
Income statistics for Hispanic or Latino residents
Median household income in Rothbury, MI in 2022:
Rothbury:
$91,228
State:
$62,497
Aggregate household income in Rothbury in 2022: $495,508
Median per capita income in Rothbury in 2022:
Rothbury:
$14,094
State:
$25,462
Change in median per capita income between 2000 and 2022:: -26.3%
Rothbury, Michigan:
-26.3%
Michigan:
+83.3%
Income statistics for American Indian and Alaska Native residents
Median per capita income in Rothbury in 2022:
Rothbury:
$18,078
State:
$27,661
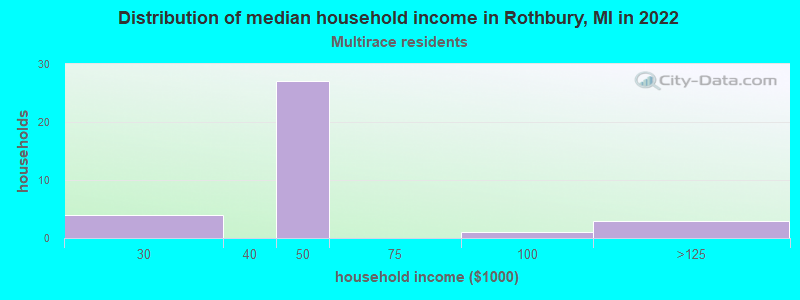
Income statistics for Multirace residents
Median household income in Rothbury, MI in 2022:
Rothbury:
$45,703
State:
$63,251
Number of households with income < $10k:
Rothbury:
0.0% (0)
Michigan:
6.1% (12,463)
Number of households with income $10k - 20k:
Rothbury:
0.0% (0)
State:
8.7% (17,830)
Number of households with income $20k - 30k:
Rothbury:
11.4% (4)
State:
7.6% (15,686)
Number of households with income $30k - 40k:
Rothbury:
0.0% (0)
State:
9.5% (19,444)
Number of households with income $40k - 50k:
Rothbury:
77.1% (27)
State:
7.5% (15,476)
Number of households with income $50k - 60k:
Rothbury:
0.0% (0)
State:
8.1% (16,622)
Number of households with income $60k - 75k:
Rothbury:
0.0% (0)
State:
10.6% (21,725)
Number of households with income $75k - 100k:
Rothbury:
2.9% (1)
Michigan:
14.4% (29,501)
Number of households with income $100k - 125k:
Rothbury:
8.6% (3)
State:
8.9% (18,231)
Number of households with income $125k - 150k:
Rothbury:
0.0% (0)
Michigan:
5.8% (11,923)
Number of households with income $150k - 200k:
Rothbury:
0.0% (0)
Michigan:
6.8% (13,956)
Number of households with income > $200k:
Rothbury:
0.0% (0)
Michigan:
6.2% (12,672)
Aggregate household income in Rothbury in 2022: $2,100,812
Median family income in Rothbury in 2022:
Rothbury:
$44,950
State:
$75,671
Number of families with income < $10k:
Rothbury:
4.3% (1)
Michigan:
4.0% (5,293)
Number of families with income $40k - 50k:
Rothbury:
86.6% (27)
Michigan:
7.0% (9,291)
Number of families with income $100k - 125k:
Rothbury:
9.1% (3)
Michigan:
11.1% (14,794)
Median per capita income in Rothbury in 2022:
Rothbury:
$37,561
Michigan:
$26,098
Income statistics for other residents
Aggregate household income in Rothbury in 2022: $1,586,515
Median per capita income in Rothbury in 2022:
Rothbury:
$13,102
State:
$27,114
Change in median per capita income between 2000 and 2022:: -43.2%
Rothbury, Michigan:
-43.2%
State:
+104.6%
Discuss Rothbury, Michigan (MI) on our hugely popular Michigan forum.