The median household income in Rome, WI in 2022 was $85,107, which was 16.6% greater than the median annual income of $70,996 across the entire state of Wisconsin. Compared to the median income of $55,357 in 2000 this represents an increase of 35.0%. The per capita income in 2022 was $40,225, which means an increase of 48.7% compared to 2000 when it was $20,622.
Whole page based on the data from 2000 / 2022 when the population of Rome, Wisconsin was 574 / 581
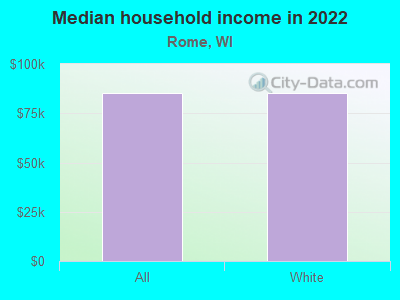
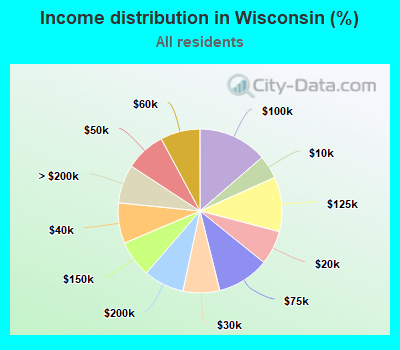
Income statistics for all residents
Median household income in Rome, WI in 2022:
Rome:
$85,108
Wisconsin:
$70,996
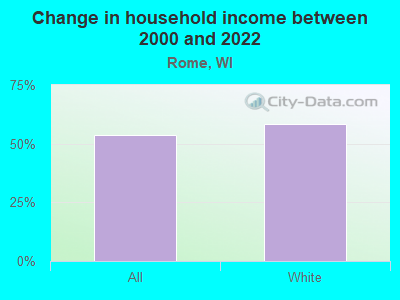
Change in median household income between 2000 and 2022:
Rome, Wisconsin:
+53.7%
State:
+62.1%
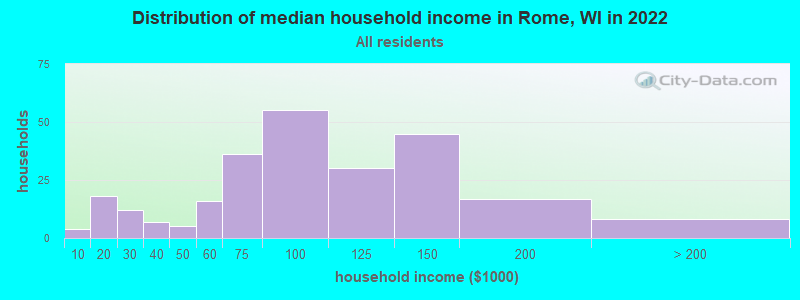
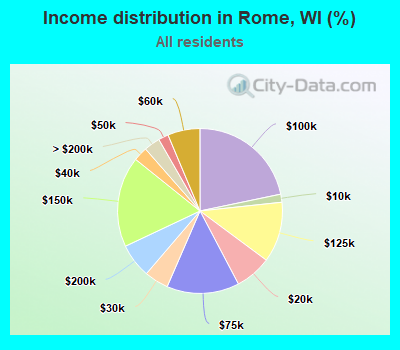
Number of households with income < $10k:
Rome:
1.6% (4)
State:
4.6% (115,058)
Number of households with income $10k - 20k:
Rome:
7.1% (18)
Wisconsin:
6.7% (167,685)
Number of households with income $20k - 30k:
Rome:
4.7% (12)
State:
7.2% (180,435)
Number of households with income $30k - 40k:
Rome:
2.8% (7)
State:
8.0% (199,167)
Number of households with income $40k - 50k:
Rome:
2.0% (5)
State:
7.9% (197,648)
Number of households with income $50k - 60k:
Rome:
6.3% (16)
State:
7.8% (195,297)
Number of households with income $60k - 75k:
Rome:
14.2% (36)
Wisconsin:
10.3% (256,633)
Number of households with income $75k - 100k:
Rome:
21.7% (55)
State:
13.7% (340,492)
Number of households with income $100k - 125k:
Rome:
11.9% (30)
State:
10.8% (268,847)
Number of households with income $125k - 150k:
Rome:
17.8% (45)
State:
7.3% (180,911)
Number of households with income $150k - 200k:
Rome:
6.7% (17)
Wisconsin:
8.0% (199,297)
Number of households with income > $200k:
Rome:
3.2% (8)
State:
7.6% (189,651)
Aggregate household income in Rome in 2022: $23,625,608
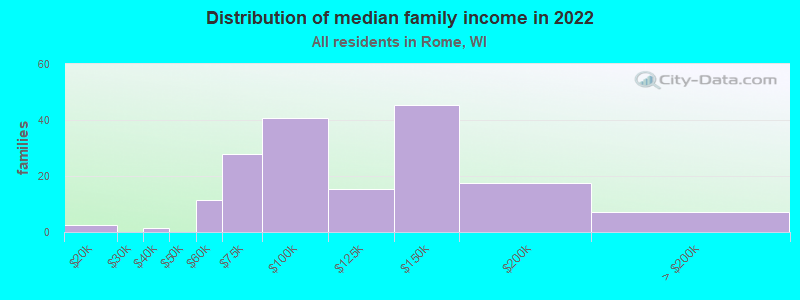
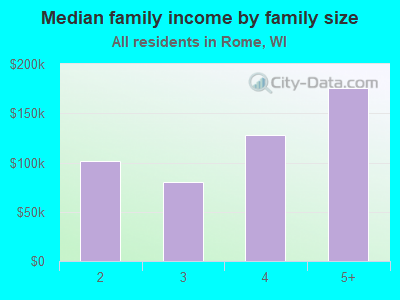
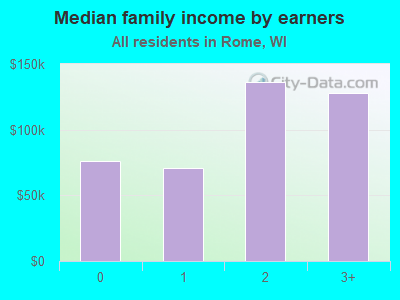
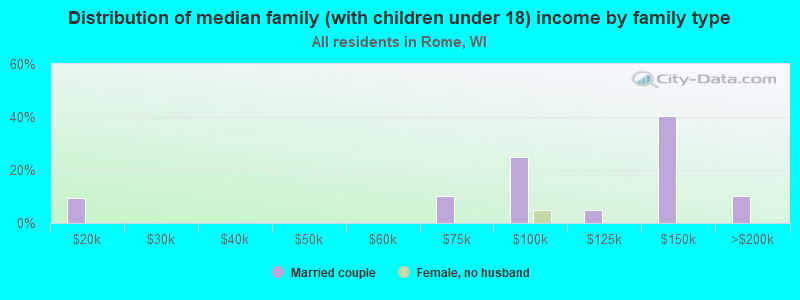
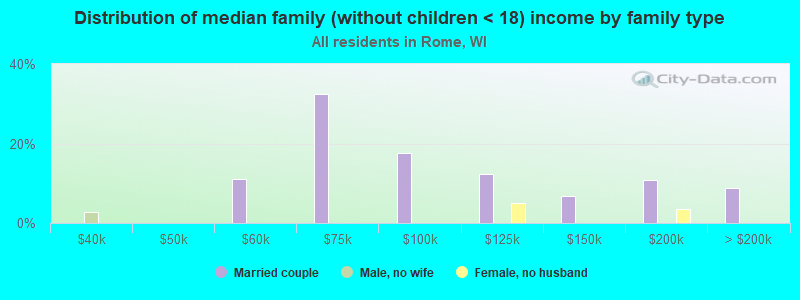
Median family income in Rome in 2022:
Rome:
$97,881
State:
$91,700
Number of families with income $10k - 20k:
Rome:
1.5% (3)
State:
3.1% (46,987)
Number of families with income $30k - 40k:
Rome:
0.9% (1)
State:
5.5% (83,582)
Number of families with income $50k - 60k:
Rome:
6.7% (11)
State:
7.0% (105,216)
Number of families with income $60k - 75k:
Rome:
16.4% (28)
Wisconsin:
10.6% (160,930)
Number of families with income $75k - 100k:
Rome:
24.0% (41)
State:
15.6% (235,445)
Number of families with income $100k - 125k:
Rome:
9.1% (15)
State:
13.6% (205,203)
Number of families with income $125k - 150k:
Rome:
26.7% (45)
State:
9.6% (145,052)
Number of families with income $150k - 200k:
Rome:
10.3% (18)
State:
11.3% (170,756)
Number of families with income > $200k:
Rome:
4.3% (7)
State:
10.7% (161,017)
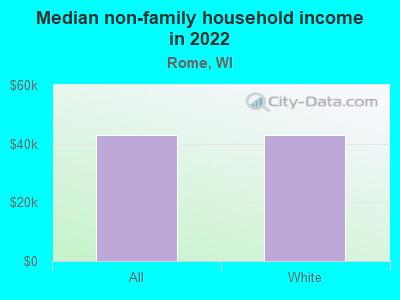
Median non-family income in Rome in 2022:
Rome:
$43,109
State:
$42,812
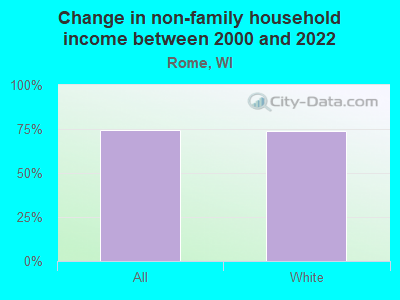
Change in median non-family income between 2000 and 2022:
Rome, Wisconsin:
+74.6%
Wisconsin:
+65.7%
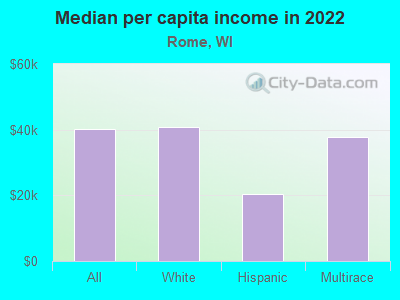
Median per capita income in Rome in 2022:
Rome:
$40,226
State:
$40,188
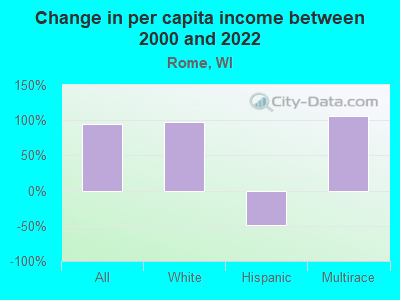
Change in median per capita income between 2000 and 2022:
Rome, Wisconsin:
+95.1%
State:
+88.9%
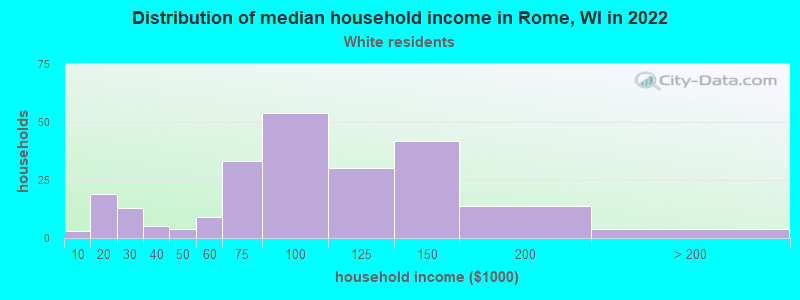
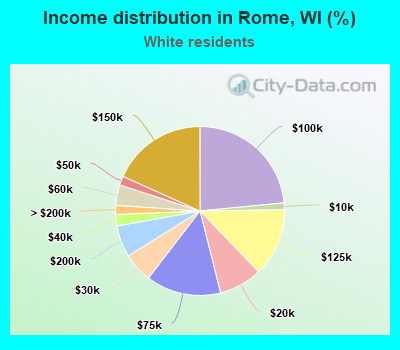
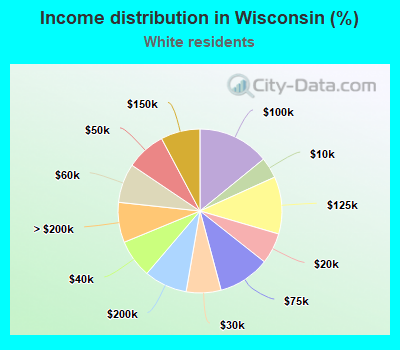
Income statistics for White residents
Median household income in Rome, WI in 2022:
Rome:
$85,117
State:
$74,405
Change in median household income between 2000 and 2022:
Rome, Wisconsin:
+58.4%
State:
+64.5%
Number of households with income < $10k:
Rome:
1.3% (3)
State:
4.1% (87,410)
Number of households with income $10k - 20k:
Rome:
8.3% (19)
State:
6.1% (129,511)
Number of households with income $20k - 30k:
Rome:
5.7% (13)
State:
6.9% (145,235)
Number of households with income $30k - 40k:
Rome:
2.2% (5)
State:
7.6% (160,205)
Number of households with income $40k - 50k:
Rome:
1.7% (4)
Wisconsin:
7.8% (165,627)
Number of households with income $50k - 60k:
Rome:
3.9% (9)
Wisconsin:
7.7% (163,506)
Number of households with income $60k - 75k:
Rome:
14.3% (33)
State:
10.2% (216,479)
Number of households with income $75k - 100k:
Rome:
23.5% (54)
State:
14.1% (298,984)
Number of households with income $100k - 125k:
Rome:
13.0% (30)
State:
11.3% (239,588)
Number of households with income $125k - 150k:
Rome:
18.3% (42)
State:
7.8% (164,502)
Number of households with income $150k - 200k:
Rome:
6.1% (14)
Wisconsin:
8.5% (180,048)
Number of households with income > $200k:
Rome:
1.7% (4)
Wisconsin:
7.9% (167,999)
Aggregate household income in Rome in 2022: $21,363,053
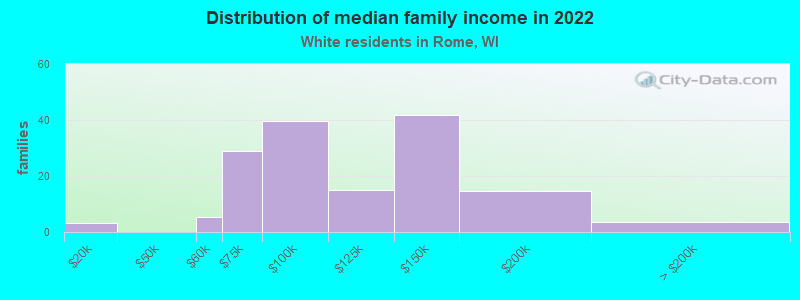
Median family income in Rome in 2022:
Rome:
$97,490
State:
$96,327
Number of families with income $10k - 20k:
Rome:
2.1% (3)
State:
2.4% (30,426)
Number of families with income $50k - 60k:
Rome:
3.4% (5)
State:
6.9% (88,079)
Number of families with income $60k - 75k:
Rome:
19.1% (29)
Wisconsin:
10.6% (136,022)
Number of families with income $75k - 100k:
Rome:
26.1% (40)
Wisconsin:
16.0% (204,807)
Number of families with income $100k - 125k:
Rome:
9.9% (15)
State:
14.3% (183,287)
Number of families with income $125k - 150k:
Rome:
27.3% (42)
State:
10.2% (131,464)
Number of families with income $150k - 200k:
Rome:
9.6% (15)
Wisconsin:
12.1% (155,060)
Number of families with income > $200k:
Rome:
2.4% (4)
State:
11.2% (143,836)
Median non-family income in Rome in 2022:
Rome:
$42,991
Wisconsin:
$44,213
Change in median non-family income between 2000 and 2022:
Rome, Wisconsin:
+74.1%
State:
+68.5%
Median per capita income in Rome in 2022:
Rome:
$40,705
Wisconsin:
$43,415
Change in median per capita income between 2000 and 2022:
Rome, Wisconsin:
+97.5%
State:
+94.0%
Income statistics for Hispanic or Latino residents
Median per capita income in Rome in 2022:
Rome:
$20,538
State:
$23,991
Change in median per capita income between 2000 and 2022:: -48.7%
Rome, Wisconsin:
-48.7%
Wisconsin:
+108.6%
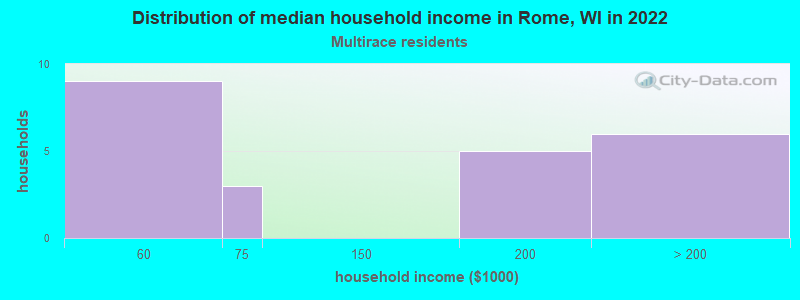
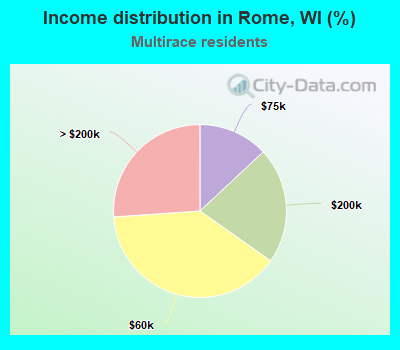
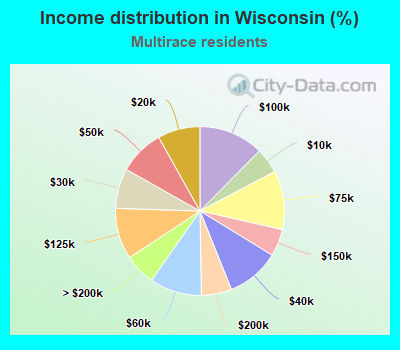
Income statistics for Multirace residents
Number of households with income < $10k:
Rome:
0.0% (0)
State:
4.8% (6,288)
Number of households with income $10k - 20k:
Rome:
0.0% (0)
State:
8.1% (10,562)
Number of households with income $20k - 30k:
Rome:
0.0% (0)
State:
7.7% (9,975)
Number of households with income $30k - 40k:
Rome:
0.0% (0)
State:
10.2% (13,246)
Number of households with income $40k - 50k:
Rome:
0.0% (0)
Wisconsin:
8.7% (11,305)
Number of households with income $50k - 60k:
Rome:
39.1% (9)
State:
10.0% (12,968)
Number of households with income $60k - 75k:
Rome:
13.0% (3)
Wisconsin:
11.3% (14,655)
Number of households with income $75k - 100k:
Rome:
0.0% (0)
State:
12.4% (16,181)
Number of households with income $100k - 125k:
Rome:
0.0% (0)
State:
9.8% (12,743)
Number of households with income $125k - 150k:
Rome:
0.0% (0)
State:
5.2% (6,773)
Number of households with income $150k - 200k:
Rome:
21.7% (5)
State:
5.8% (7,552)
Number of households with income > $200k:
Rome:
26.1% (6)
Wisconsin:
6.0% (7,788)
Aggregate household income in Rome in 2022: $3,792,276
Median per capita income in Rome in 2022:
Rome:
$37,705
State:
$24,783
Change in median per capita income between 2000 and 2022:
Rome, Wisconsin:
+106.0%
State:
+124.7%
Discuss Rome, Wisconsin (WI) on our hugely popular Wisconsin forum.