The median household income in Rome, IL in 2022 was $86,025, which was 10.8% greater than the median annual income of $76,708 across the entire state of Illinois. Compared to the median income of $40,962 in 2000 this represents an increase of 52.4%. The per capita income in 2022 was $37,513, which means an increase of 51.1% compared to 2000 when it was $18,345.
Whole page based on the data from 2000 / 2022 when the population of Rome, Illinois was 1,776 / 1,580
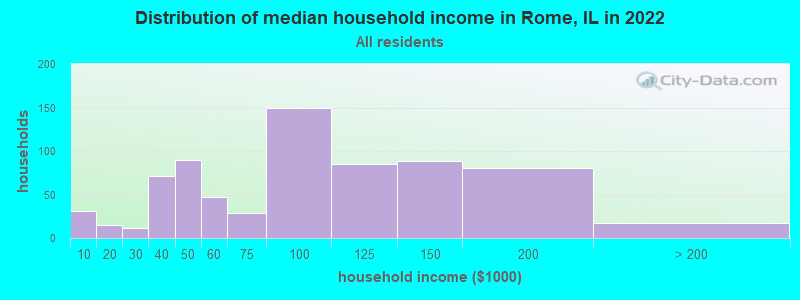
Income statistics for all residents
Median household income in Rome, IL in 2022:
Rome:
$86,025
State:
$76,708
Change in median household income between 2000 and 2022:
Rome, Illinois:
+110.0%
State:
+64.6%
Number of households with income < $10k:
Rome:
4.3% (31)
Illinois:
5.9% (296,090)
Number of households with income $10k - 20k:
Rome:
2.1% (15)
State:
6.6% (333,259)
Number of households with income $20k - 30k:
Rome:
1.5% (11)
State:
6.8% (342,921)
Number of households with income $30k - 40k:
Rome:
9.9% (71)
State:
7.0% (355,254)
Number of households with income $40k - 50k:
Rome:
12.6% (90)
Illinois:
6.7% (340,678)
Number of households with income $50k - 60k:
Rome:
6.6% (47)
State:
6.7% (339,405)
Number of households with income $60k - 75k:
Rome:
4.1% (29)
Illinois:
9.2% (465,709)
Number of households with income $75k - 100k:
Rome:
20.8% (149)
Illinois:
12.9% (651,353)
Number of households with income $100k - 125k:
Rome:
11.9% (85)
Illinois:
10.3% (522,359)
Number of households with income $125k - 150k:
Rome:
12.4% (89)
State:
7.3% (367,136)
Number of households with income $150k - 200k:
Rome:
11.3% (81)
State:
9.0% (455,249)
Number of households with income > $200k:
Rome:
2.4% (17)
Illinois:
11.6% (586,947)
Aggregate household income in Rome in 2022: $61,444,616
Median family income in Rome in 2022:
Rome:
$104,845
State:
$96,948
Number of families with income $10k - 20k:
Rome:
1.5% (7)
State:
3.3% (105,017)
Number of families with income $30k - 40k:
Rome:
1.3% (6)
Illinois:
5.3% (167,069)
Number of families with income $40k - 50k:
Rome:
3.7% (16)
State:
5.8% (181,164)
Number of families with income $50k - 60k:
Rome:
6.8% (30)
State:
6.1% (191,561)
Number of families with income $60k - 75k:
Rome:
2.8% (12)
Illinois:
9.0% (282,985)
Number of families with income $75k - 100k:
Rome:
28.9% (127)
State:
13.8% (432,725)
Number of families with income $100k - 125k:
Rome:
12.6% (56)
Illinois:
11.9% (373,296)
Number of families with income $125k - 150k:
Rome:
20.1% (88)
State:
8.9% (279,791)
Number of families with income $150k - 200k:
Rome:
18.8% (82)
State:
11.9% (372,004)
Number of families with income > $200k:
Rome:
3.5% (15)
Illinois:
15.9% (500,033)
Median non-family income in Rome in 2022:
Rome:
$43,405
State:
$46,533
Change in median non-family income between 2000 and 2022:
Rome, Illinois:
+67.3%
State:
+64.0%
Median per capita income in Rome in 2022:
Rome:
$37,513
State:
$43,317
Change in median per capita income between 2000 and 2022:
Rome, Illinois:
+104.5%
State:
+87.5%
Income statistics for White residents
Median household income in Rome, IL in 2022:
Rome:
$88,631
State:
$83,346
Change in median household income between 2000 and 2022:
Rome, Illinois:
+116.1%
State:
+67.5%
Number of households with income < $10k:
Rome:
4.4% (29)
State:
4.5% (149,895)
Number of households with income $10k - 20k:
Rome:
2.1% (14)
State:
5.5% (184,529)
Number of households with income $20k - 30k:
Rome:
1.5% (10)
State:
6.1% (205,767)
Number of households with income $30k - 40k:
Rome:
7.1% (47)
Illinois:
6.7% (225,572)
Number of households with income $40k - 50k:
Rome:
12.6% (83)
Illinois:
6.5% (216,965)
Number of households with income $50k - 60k:
Rome:
4.7% (31)
State:
6.6% (222,841)
Number of households with income $60k - 75k:
Rome:
4.3% (28)
State:
9.3% (312,758)
Number of households with income $75k - 100k:
Rome:
20.5% (135)
State:
12.9% (433,180)
Number of households with income $100k - 125k:
Rome:
13.8% (91)
Illinois:
10.7% (360,753)
Number of households with income $125k - 150k:
Rome:
13.8% (91)
State:
7.9% (266,532)
Number of households with income $150k - 200k:
Rome:
12.5% (82)
State:
10.0% (337,357)
Number of households with income > $200k:
Rome:
2.6% (17)
Illinois:
13.3% (446,069)
Aggregate household income in Rome in 2022: $60,346,555
Median family income in Rome in 2022:
Rome:
$109,415
State:
$107,938
Number of families with income $10k - 20k:
Rome:
2.1% (9)
State:
2.5% (50,574)
Number of families with income $30k - 40k:
Rome:
1.6% (7)
State:
4.4% (90,563)
Number of families with income $40k - 50k:
Rome:
3.7% (16)
Illinois:
5.0% (102,597)
Number of families with income $50k - 60k:
Rome:
5.5% (23)
State:
5.8% (119,129)
Number of families with income $60k - 75k:
Rome:
2.6% (11)
Illinois:
8.8% (179,665)
Number of families with income $75k - 100k:
Rome:
25.9% (110)
State:
13.5% (276,887)
Number of families with income $100k - 125k:
Rome:
14.4% (61)
Illinois:
12.5% (256,099)
Number of families with income $125k - 150k:
Rome:
20.8% (88)
State:
9.8% (199,855)
Number of families with income $150k - 200k:
Rome:
20.1% (85)
State:
13.4% (274,569)
Number of families with income > $200k:
Rome:
3.5% (15)
Illinois:
18.6% (381,354)
Median non-family income in Rome in 2022:
Rome:
$44,660
Illinois:
$50,934
Change in median non-family income between 2000 and 2022:
Rome, Illinois:
+47.5%
State:
+70.7%
Median per capita income in Rome in 2022:
Rome:
$39,955
State:
$50,738
Change in median per capita income between 2000 and 2022:
Rome, Illinois:
+118.3%
Illinois:
+95.5%
Income statistics for Hispanic or Latino residents
Number of households with income < $10k:
Rome:
0.0% (0)
State:
4.9% (33,145)
Number of households with income $10k - 20k:
Rome:
0.0% (0)
State:
5.4% (36,345)
Number of households with income $20k - 30k:
Rome:
0.0% (0)
Illinois:
7.5% (50,677)
Number of households with income $30k - 40k:
Rome:
0.0% (0)
State:
7.7% (52,008)
Number of households with income $40k - 50k:
Rome:
100.0% (37)
State:
8.1% (54,702)
Number of households with income $50k - 60k:
Rome:
0.0% (0)
State:
7.5% (51,062)
Number of households with income $60k - 75k:
Rome:
0.0% (0)
Illinois:
11.3% (76,576)
Number of households with income $75k - 100k:
Rome:
0.0% (0)
Illinois:
15.5% (105,152)
Number of households with income $100k - 125k:
Rome:
0.0% (0)
Illinois:
11.5% (77,760)
Number of households with income $125k - 150k:
Rome:
0.0% (0)
Illinois:
7.3% (49,310)
Number of households with income $150k - 200k:
Rome:
0.0% (0)
State:
7.6% (51,233)
Number of households with income > $200k:
Rome:
0.0% (0)
Illinois:
5.9% (40,028)
Median per capita income in Rome in 2022:
Rome:
$10,494
State:
$26,551
Change in median per capita income between 2000 and 2022:
Rome, Illinois:
+74.9%
Illinois:
+111.0%
Income statistics for Multirace residents
Median per capita income in Rome in 2022:
Rome:
$28,285
State:
$29,285
Discuss Rome, Illinois (IL) on our hugely popular Illinois forum.